Community Led Local Development in North Durham Local Development Strategy 2017-2022 - Durham County ...
←
→
Page content transcription
If your browser does not render page correctly, please read the page content below
Community Led Local Development in North Durham Local Development Strategy 2017-2022
Contents

1. The Area .................................................................................................................. 1
2. Needs and Potential .................................................................................................. 5
   2.1 Population .......................................................................................................... 5
   2.2 Economic Activity ................................................................................................ 7
       2.2.1 Economic Activity Rates ................................................................................ 7
       2.2.2 Employment ................................................................................................ 9
       2.2.3 Skills and Qualifications................................................................................14
       2.2.4 Unemployment and Economic Inactivity ........................................................15
       2.2.5 Business Base .............................................................................................19
   2.3 Local Services and Infrastructure .........................................................................22
   2.4 Deprivation and Disadvantage .............................................................................24
   2.5 SWOT Analysis ...................................................................................................25
3. Strategy and Objectives ............................................................................................28
   3.1 Intervention Logic ..............................................................................................28
       3.1.1 Local Needs and Opportunities .....................................................................28
       3.1.2 Local Objectives and Targets ........................................................................33
       3.1.3 Actions & Funding .......................................................................................34
       3.1.4 Monitoring & Evaluation ...............................................................................35
   3.2 Objectives .........................................................................................................35
   3.3 ESI Fund Outputs and Results .............................................................................36
   3.4 Consistency, Complementarity and Synergy ..........................................................37
   3.5 Equal Opportunities ............................................................................................40
   3.6 Environmental Sustainability................................................................................41
   3.7 Innovation .........................................................................................................41
4. Community Involvement ...........................................................................................43
   4.1 Developing the LDS ............................................................................................43
   4.2 Involvement Activities .........................................................................................44
       4.2.1 Web based Questionnaire ............................................................................44
       4.2.2 Consultation Events .....................................................................................45
       4.2.3 Stakeholder Interviews and Meetings ............................................................46
       4.2.4 LAG Consultation .........................................................................................47
   4.3 Summary ...........................................................................................................47
5. Action Plan ..............................................................................................................48
   5.1 Approach ...........................................................................................................48

NorthDurhamCLLDFinalDraft
5.1.1 Small Scale .................................................................................................48
       5.1.2 Locally Delivered .........................................................................................48
       5.1.3 Easy to Access ............................................................................................48
       5.1.4 Flexible.......................................................................................................49
   5.2 Investment Priorities ..........................................................................................49
       5.2.1 Sustainable Communities .............................................................................49
       5.2.2 Enhancing Economic Inclusion ......................................................................49
       5.2.3 Stimulating Entrepreneurialism .....................................................................49
       5.2.4 Enterprising Spaces .....................................................................................50
       5.2.5 Developing Growth and Enterprise ................................................................50
6. Management, Monitoring and Evaluation ....................................................................56
   6.1 Summary of the Local Action Group .....................................................................56
   6.2 The Accountable Body ........................................................................................57
   6.3 Project development and selection .......................................................................58
       6.3.1 Project Development ...................................................................................58
       6.3.2 Project applications .....................................................................................58
   6.4 Monitoring and Evaluation ...................................................................................60
   6.5 Communications and Publicity .............................................................................62
   6.6 Training and Development ..................................................................................62
7. Financial Plan...........................................................................................................64
   7.1 Targeting ..........................................................................................................64
   7.2 Management and Administration .........................................................................64
   7.3 Project Budget ...................................................................................................64
Annex A – LAG Member Roles and Responsibilities ..........................................................67
Annex B: Code of Conduct, including Conflict of Interest Policy ........................................69
Annex C: LAG Terms of Reference .................................................................................78
Annex D: Confirmation of Agreement in-principle ............................................................85

NorthDurhamCLLDFinalDraft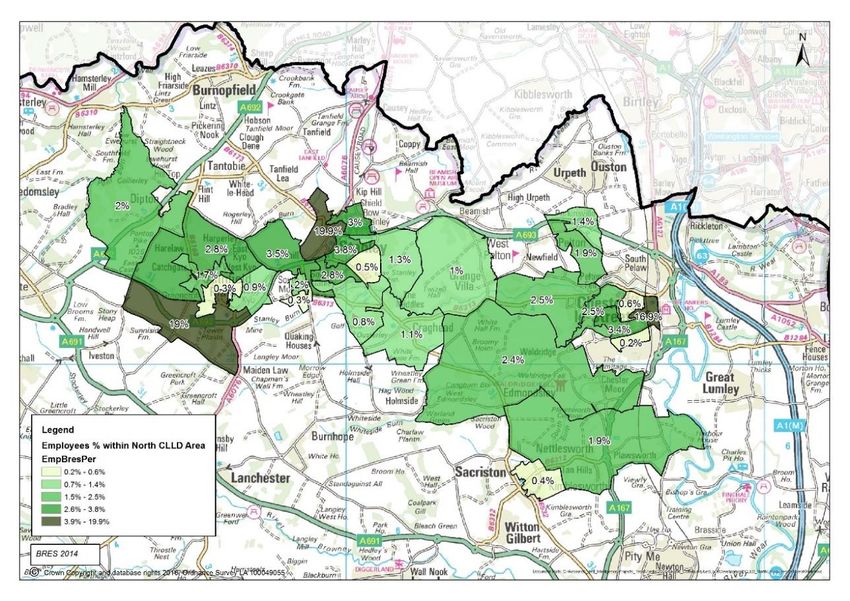
1. The Area
Figure 1.1: North Durham CLLD Area
The proposed area for Community Led Local Development in North Durham is shown in
Figure 1.1, above. The area covers 4,854 hectares and contains a population of around
45,9061 people of which 53% live in lower layer super output areas (LSOAs) identified as
being in the 20% most deprived areas in the country within the Indices of Multiple Deprivation
(IMD) 2010, with a further 38% living in LSOAs within the 20-30% most deprived.
In total there are 28 LSOAs in the area, 2 of which are within the top 10% most deprived
(highlighted in dark pink) and 12 of which are within the 10-20% most deprived (highlighted
in light pink) in the IMD 2010. Those LSOAs in the 20% most deprived are clustered around
four different areas in the west, centre, east and south of the CLLD area:
East - focussed around Chester-le-Street and the nearby areas of Pelton Fell, Whitehills
and Pelton;
South – the eastern half of Sacriston;
Centre – focussed around South Stanley and Craghead; and
West – focussed around the outskirts of Annfield Plain and Harelaw.
The area encompasses a number of former mining communities and the urban core of north
Durham with the North Pennines Dales LEADER Local Action Group (LAG) skirting around to
the North, West and South of the CLLD area. The area enjoys relatively good road linkages
throughout, with the A693 running from east to west from the A1 to the A692, as well as
mainline rail linkages and nearby access to the A1 (M) in Chester-le-Street. As a consequence
the area is home to a significant amount of people that commute relatively short distances to
1
ONS Population Estimates, 2013
NorthDurhamCLLDFinalDraft 1
access employment opportunities in Tyneside to the North, Sunderland in the East and
Durham City to the South. These linkages are important to the social, economic and
geographic coherence of the area.
The proposed CLLD area is comprised of a focussed geographic community across North
Durham which links all of the LSOAs within the top 20% most deprived that are eligible for
and the target of CLLD, with adjacent LSOAs incorporated to link the 4 core areas of need in
the west, centre, east and south of the proposed CLLD area. Therefore deprivation and health,
income and employment related deprivation in particular are a key feature. The area builds
on a history of shared industrial heritage and includes a number of towns, villages and
settlements with strong local identities and communities. This includes Chester-le-Street,
Stanley, Sacriston and Annfield Plain, all of which support a range of social and economic
activity. Consequently the areas of Area Action Partnerships (AAPs)
particular demand for support, in terms Durham County Council led AAPs provide a
of deprivation, are the most significant community involvement infrastructure which
communities and settlements in the give local people and organisations a say in the
North Durham CLLD area. However, the delivery of local services and the allocation of
area has a strong civil society with a some local resources.
strong tradition of community solidarity
and voluntary action and community Each AAP is comprised of an area forum and an
participation. The area has a history of area board which identify and tackle key issues
cross community collaboration through within their local communities.
shared initiatives and projects funded Area Forum: Open to all these meet
and supported in partnership by the local twice a year to consider and prioritise
authority led Area Action Partnerships2 key issues;
(AAPs) that cover the North Durham Area Board: Comprised of 21 elected
CLLD area. These present an important members from County Council, town and
mechanism for community engagement parish councils, community and
and empowerment across County voluntary groups, residents, businesses,
Durham and will work closely with CLLD and other key public and private sector
and the LAG in North Durham. agencies. These meet six times a year to
monitor progress, manage spending (see
This coherent geographical area was below) and work with local partners.
developed to focus specifically on areas
of greatest need with developmental Each AAP has a budget of £100,000 in 2016/17
work undertaken through a dedicated which the Board has devolved responsibility for
CLLD workstream3 under the County allocating to local projects and investments.
Durham European Union Investment This budget may be increased from other
Group, with further activity to refine and sources.
finalise the area through the local Area
Action Partnerships.
2
http://www.durham.gov.uk/article/1960/About-AAPs
3This involved Business Durham, local enterprise agencies, voluntary and community sector representatives and
Durham County Council.
NorthDurhamCLLDFinalDraft 2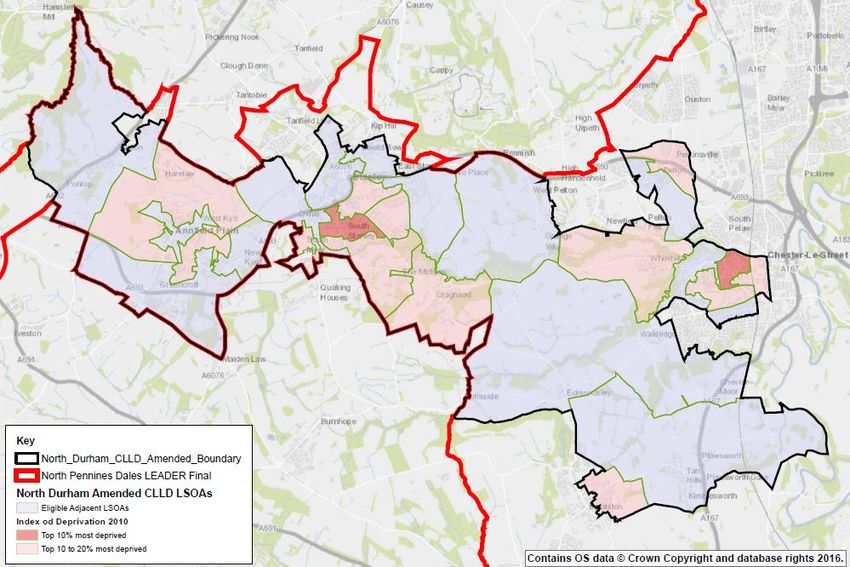
Figure 1.2 provides a summary overview of the table setting out which lower super output
areas (LSOAs) are included within the North Durham CLLD area.
Figure 1.2: Key Area Information
LSOAs included within the E01020592; E01020593; E01020599; E01020601;
North Durham CLLD area (28) E01020602; E01020604; E01020606; E01020607;
E01020615; E01020616; E01020618; E01020621;
E01020624; E01020625; E01020626; E01020638;
E01020639; E01020647; E01020648; E01020649;
E01020653; E01020661; E01020662; E01020670;
E01020671; E01020673; E01020674; E01020675.
LSOAs within the 20% most E01020592; E01020673; E01020593; E01020602;
disadvantaged areas in Indices E01020615; E01020618; E01020621; E01020626;
of Multiple Deprivation 2010 E01020639; E01020647; E01020648; E01020649;
(14) E01020671; E01020675
LSOAs adjacent to 20% most E01020601; E01020604; E01020625; E01020638;
disadvantaged (14) E01020662; E01020599; E01020606; E01020607;
E01020616; E01020624; E01020653; E01020661;
E01020670; E01020674.
LSOAs neither within 20% n/a
disadvantaged or adjacent to
them
Total population 45,906
Population within 20% most 23,353
disadvantaged
Population of LSOAs LSOA Population4 LSOA Population
E01020592 1,523 E01020626 1,563
E01020593 1,266 E01020638 1,541
E01020599 1,704 E01020639 1,521
E01020601 1,535 E01020647 2,177
E01020602 1,815 E01020648 1,952
E01020604 1,422 E01020649 1,544
E01020606 1,512 E01020653 1,502
E01020607 1,630 E01020661 1,907
E01020615 1,791 E01020662 1,809
E01020616 1,721 E01020670 1,513
E01020618 1,613 E01020671 1,320
E01020621 1,918 E01020673 1,607
E01020624 1,541 E01020674 1,578
E01020625 1,638 E01020675 1,743
Total 45,906
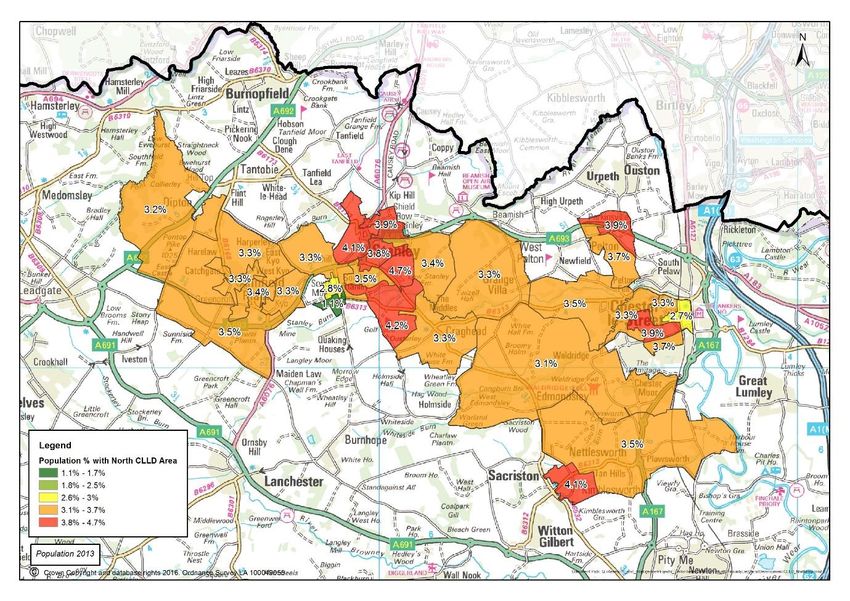
The population distribution across the CLLD area is shown in Figure 1.3, below. This shows
a concentration of population around the Stanley area.
4
ONS Population Estimates, 2013
NorthDurhamCLLDFinalDraft 3
Figure 1.3: CLLD Area Population by LSOA

NorthDurhamCLLDFinalDraft                  4
2. Needs and Potential

Population Summary

Sources: Source: ONS Population Estimates, 2013; Census, 2011; Claimant Count, June 2016.
Note: Figures round to the nearest 10.

2.1 Population

The area’s population broadly follows national trends but is marginally younger than the
Durham average with 44% of residents aged 45 years and over in the CLLD area compared
to 46% across Durham. Estimates suggest there are approximately 29,400 residents aged 16
to 64 (64%), with around 21,200 (46%) aged 30 to 64.

Figure 2.1: Age Profile
                        25%

                        20%
  % of the population

                        15%

                        10%

                        5%

                        0%
                              0-15     16-19   20-24    25-29   30-44   45-59   60-64   65+
                                                          Age band

                                     N.Durham CLLD     Durham   NELEP     England

Source: Census 2011

As with County Durham as a whole the North CLLD area has a largely homogenous population
in terms of ethnic group with around 44,865 or 98.7% of residents classifying their ethnic
group as white English/Scottish/Welsh/Northern Irish/British. This means that around 1,041
NorthDurhamCLLDFinalDraft                                                                     5
residents are from other ethnic groups, of which 435 are other white ethnic groups5 and 607
are from black and minority ethnic groups6 (BME). As this breakdown is for the total
population, including those not of working age, it has clear implications for potential ethnicity
based equalities targets for the CLLD programme.

Figure 2.2: Ethnicity Profile
                                                         N.Durham
                                                                          Durham           NELEP         England
    Ethnic Group                                           CLLD
    White                                                     98.7%           98.2%          95.5%          85.4%
    White: English/Welsh/Scottish/Northern
    Irish/British                                              97.7%           96.6%          93.8%          79.8%
    White: Irish                                                0.2%            0.2%           0.3%              1.0%
    White: Gypsy or Irish Traveller                             0.1%            0.1%           0.1%              0.1%
    White: Other White                                          0.7%            1.2%           1.4%              4.6%
    Mixed/multiple ethnic groups                               0.4%            0.6%           0.8%               2.3%
    Mixed/multiple ethnic groups: White and Black
    Caribbean                                                   0.2%            0.2%           0.2%              0.8%
    Mixed/multiple ethnic groups: White and Black
    African                                                     0.0%            0.1%           0.1%              0.3%
    Mixed/multiple ethnic groups: White and Asian               0.1%            0.2%           0.3%              0.6%
    Mixed/multiple ethnic groups: Other Mixed                   0.1%            0.1%           0.2%              0.5%
    Asian/Asian British                                        0.7%            0.9%           2.7%               7.8%
    Asian/Asian British: Indian                                 0.2%            0.3%           0.6%              2.6%
    Asian/Asian British: Pakistani                              0.1%            0.1%           0.5%              2.1%
    Asian/Asian British: Bangladeshi                            0.1%            0.0%           0.5%              0.8%
    Asian/Asian British: Chinese                                0.2%            0.3%           0.6%              0.7%
    Asian/Asian British: Other Asian                            0.2%            0.2%           0.5%              1.5%
    Black/African/Caribbean/Black British                      0.1%            0.1%           0.5%               3.5%
    Black/African/Caribbean/Black British: African              0.1%            0.1%           0.4%              1.8%
    Black/African/Caribbean/Black British:
    Caribbean                                                   0.0%            0.0%           0.0%              1.1%
    Black/African/Caribbean/Black British: Other
    Black                                                       0.0%            0.0%           0.0%              0.5%
    Other ethnic group                                          0.1%           0.2%           0.4%               1.0%
    Other ethnic group: Arab                                    0.0%            0.1%           0.2%              0.4%
    Total                                                   100.0%          100.0%         100.0%         100.0%
Source: Census 2011

Poor health is an issue in North Durham with around 10% of the population in bad or very
bad health, compared to 8% across Durham and 6% across England. A further 18% are in
fair health meaning that only 73% are in good or very good health, compared with 76% across
Durham, 77% across the NELEP area and 81% across England.

5Including white Irish, white Gypsy or Irish Traveller and other white.
6Including Mixed/multiple ethnic groups, Asian/Asian British, black/African/Caribbean/ Black British and other
ethnic groups.
NorthDurhamCLLDFinalDraft                                                                                         6
Figure 2.3: General Health
50%
45%
40%
35%
% of the population
30%
25%
20%
15%
10%
5%
0%
Very good Good health Fair health Bad health Very bad health Bad or very bad
health health
N.Durham CLLD Durham NELEP England
Source: Census 2011
This trend is further emphasised by data showing long term health problems or disabilities
with higher proportions of the total and 16-64 year old populations of North Durham having
limiting conditions (26% and 20% respectively) than across England (18% and 13%
respectively). Estimates suggest that almost 5,916 16-64 year olds in North Durham have a
long term health problem or disability which limits their day-to-day activities a little or a lot.
Figure 2.4: Long Term Health Problems or Disabilities
Long term health problem or N.Durham % Difference to Population
Population disability CLLD England average estimate
Day-to-day activities limited a lot 14% 5% 6,363
Day-to-day activities limited a little 12% 2% 5,530
Day-to-day activities not limited 74% -7% 34,013
All residents Total 100% - 45,906
Day-to-day activities limited a lot 10% 4% 2,972
Day-to-day activities limited a little 10% 2% 2,944
Day-to-day activities not limited 80% -7% 23,470
16-64 year olds Total 100% - 29,386
Source: ONS Population Estimates, 2013; Census 2011.
2.2 Economic Activity
2.2.1 Economic Activity Rates
Key findings from analysis of economic activity data, include the following for residents aged
16-74:
Higher economically active rates than those for County Durham (+1 difference) but
lower than those for NELEP (-1-2% difference) England as a whole (-4% difference
for both);
NorthDurhamCLLDFinalDraft 7 Employment rates equal to the Durham average (both at 57%) but lower than NELEP
(58%) and England (62%) averages;
Higher unemployment levels (6%) than Durham (4%), NELEP (5%) and England
(4%);
Lower self-employment rates than Durham (6%), NELEP (7%) and England (10%);
Higher economic inactivity levels (35%) than the national average (30%) but
marginally lower than the County Durham average (36%)
Higher levels of inactive due to long-term sickness or disability (8%) than County
Durham (6%), NELEP (6%) and particularly England (4%).
Figure 2.5: Economic Activity Rates (Residents)
North
Economic Activity Durham Durham NELEP England
CLLD
Economically active 65% 64% 66% 70%
Economically active: In employment 57% 57% 58% 62%
Economically active: Employee: Part-time 14% 13% 14% 14%
Economically active: Employee: Full-time 37% 37% 37% 39%
Economically active: Self-employed 6% 7% 7% 10%
Economically active: Unemployed 6% 4% 5% 4%
Economically active: Full-time student 2% 3% 3% 3%
Economically Inactive 35% 36% 34% 30%
Economically inactive: Retired 16% 17% 16% 14%
Economically inactive: Student (including
4% 6% 6% 6%
full-time students)
Economically inactive: Looking after home
5% 4% 4% 4%
or family
Economically inactive: Long-term sick or
8% 6% 6% 4%
disabled
Economically inactive: Other 2% 2% 2% 2%
Total 100% 100% 100% 100%
Source: Census 2011
Economic activity differs between the genders, as shown in Figure 2.6, over. Key highlights
include notably lower levels of economically active, employed, self-employed and full-time
employed among female residents, while the reverse is true for part-time employment,
economic inactivity and those that are inactive due to caring responsibilities. The gender gap
for self-employment is of particular interest to the North Durham LAG. In addition a local VCS
organisation that has been involved the CLLD and LDS development process has recently
secured funding for a 5 year project focussed on supporting women to tackle barriers and
enhance their health, wellbeing and participation. This includes flexible funding which could
be used as potential match for a female focussed entrepreneurship programme across North
Durham CLLD or other female focussed interventions to address the issues highlighted above.
NorthDurhamCLLDFinalDraft 8Figure 2.6: Economic Activity by Gender
Economically inactive: Other 3%
2%
Economically inactive: Long-term sick or disabled 7%
9%
Economically inactive: Looking after home or family 1%
8%
Economically Inactive 30%
39%
Economically active: Full-time student 3%
2%
Economically active: Unemployed 4%
8%
Economically active: Self-employed 3%
8%
Economically active: Employee: Full-time 29%
46%
Economically active: Employee: Part-time 6%
22%
Economically active: In employment 54%
60%
Economically active 61%
70%
0% 10% 20% 30% 40% 50% 60% 70% 80%
% of 16-74 year olds
Females Males
Source: Census 2011
2.2.2 Employment
While around 19,420 residents are in employment (either as employees or self-employed),
workplace population7 data from the 2011 Census suggests there are around 12,930 jobs in
the North Durham CLLD area. This represents an employment density rate of 2.7 jobs per
hectare, which compares favourably with rates of 0.9 across County Durham and 1.1 across
the NELEP area. Analysis of the workplace based population shows that part-time employment
is more commonplace among jobs in the CLLD area than across County Durham, the North
East and England (28% of all jobs in the area compared with 23%, 23% and 21%
respectively)8. Workplace population data also further highlights the relatively low levels of
self-employment in the area, when compared with national averages.
Figure 2.7 over, shows the distribution of workplace based employment by LSOA area across
North Durham, highlighting a substantial concentration of employment in a small number of
areas with just 3 LSOAs accounting for almost 56% of all jobs in the area. This includes Stanley
town centre and industrial and retail sites to the North and West, Greencroft Industrial estate
to the South of Annfield Plain and sections of Chester-le-Street town centre in the west.
7 The workplace population is an estimate of the population working in an area. It includes usual residents aged
16 to 74 whose usual place of work is in the area. People who work mainly at or from home or do not have a
fixed place of work are included in their area of their usual residence. The following population groups are
excluded from the workplace population of an area: those living in England and Wales but working in Scotland,
Northern Ireland, outside the UK or on offshore installations, those with a place of work in England and Wales
but who are not usually resident in England and Wales, and short-term residents.
8
It should be noted that this data is based on MSOAs within which the CLLD area is based rather than the CLLD
area alone, as MSOAs are the lowest geographical unit this data is available for.
NorthDurhamCLLDFinalDraft 9Figure 2.7: Workplace Based Employment by LSOA Source: Census 2011 Analysis of resident employment by LSOA reveals a much more even distribution with the largest proportion of total area resident employment in any one LSOA at 4.2% compared with 19.9% for workplace based employment (see Figure 2.8). Figure 2.8: Resident Based Employment by LSOA Source: Census 2011 NorthDurhamCLLDFinalDraft 10
Figure 2.9 below shows the distribution of employment by industry, both in terms of CLLD
area residents in work and jobs based within the CLLD area. This illustrates the importance of
key industries such as health & social care, wholesale and retail, manufacturing and
construction. All of these sectors account for a greater proportion of employment among CLLD
area residents than across England as a whole. The area contains a number of key
manufacturing and engineering employers with a number based in close proximity to each
other. Particular strengths in manufacturing include the automotive and food sectors.

Figure 2.9: Employment by Workplace and Residents
    Industry                                        Workplace9               Resident
    Agriculture, forestry & fishing (A)                 0.4%                    0.3%
    Mining, quarrying & utilities (B,D and E)           1.4%                    2.2%
    Manufacturing (C)                                  10.2%                   13.1%
    Construction (F)                                   10.0%                    8.8%
    Wholesale and retail trade; Motor
    trades (G)                                         16.9%                   17.8%
    Transport & storage (inc postal) (H)                5.9%                    5.8%
    Accommodation & food services (I)                   6.5%                    5.4%
    Information & communication (J)                     1.1%                    1.8%
    Financial & insurance (K)                           2.0%                    2.1%
    Property (L)                                        1.7%                    1.2%
    Professional, scientific & technical (M)            2.8%                    3.2%
    Business administration & support
    services (N)                                        4.3%                    4.4%
    Public administration & defence (O)                 6.0%                    8.3%
    Education (P)                                      10.1%                    7.7%
    Health (Q)
                                                       15.4%                   13.5%
    Arts, entertainment, recreation & other
    services (R,S,T and U)                              5.1%                    4.4%
    Total                                             100.0%                   100%
Source: Census 2011

Public sector employment is also key to the local economy. Collectively the industries that
comprise the public sector in its widest definition (public administration & defence, education
and health & social care) account for 31% of workplace employment and 30% of resident
employment.

Analysis by gender shows that levels of employment differ between males and females (52%
and 48% of employed residents respectively), with the distribution almost the opposite of that
for the working age population as a whole (49% and 51% respectively). However, Figure
2.10 over, shows that the gender distribution of employment by industry differs significantly
for a number of industries which are dominated by one gender or another. For example, in a
key industry such as manufacturing males account for almost 4 out of 5 residents employed
in the industry, whereas the reverse is true in health & social care. This suggests there may

9
  It should be noted that this data is based on MSOAs within which the CLLD area is based rather than the CLLD
area alone, as MSOAs are the lowest geographical unit this data is available for.
NorthDurhamCLLDFinalDraft                                                                                    11
be scope for some initiatives to support equalities projects which seek to address such gender imbalances. Figure 2.10: Gender Breakdown of Resident Employment by Industry (N.Durham) Industry Males Females Agriculture, forestry & fishing (A) 76% 24% Mining, quarrying & utilities (B,D and E) 68% 32% Manufacturing (C) 78% 22% Construction (F) 89% 11% Wholesale and retail trade; Motor trades (G) 48% 52% Transport & storage (inc postal) (H) 79% 21% Accommodation & food services (I) 36% 64% Information & communication (J) 68% 32% Financial & insurance (K) 36% 64% Property (L) 50% 50% Professional, scientific & technical (M) 49% 51% Business administration & support services (N) 57% 43% Public administration & defence (O) 47% 53% Education (P) 28% 72% Health and social care (Q) 18% 82% Arts, entertainment, recreation & other services (R,S,T and U) 36% 64% Total 52% 48% Source: Census 2011 Figure 2.11 over, shows the breakdown of industry employment by full-time or part-time work. This shows that part-time working is particularly prevalent in accommodation and food services (57%), other industries10 (45%), and wholesale and retail trade industries (42%). 10This includes arts, entertainment and recreations, other service activities such as physical well-being activities and hairdressing and beauty activities. NorthDurhamCLLDFinalDraft 12
Figure 2.11: Industry Employment by Full-time/Part-time11

                                                           Other        45%                55%
                       Human health and social work activities        35%                65%
                                                       Education      34%                66%
                Public administration and defence; compulsory… 20%                    80%
                  Administrative and support service activities      31%                69%
                 Professional, scientific and technical activities  24%                76%
                                            Real estate activities 18%                82%
     Industry

                              Financial and insurance activities    25%                75%
                               Information and communication 11%                    89%
                    Accommodation and food service activities             57%                43%
                                          Transport and storage     23%                77%
                   Wholesale and retail trade; repair of motor…        42%                58%
                                                    Construction 13%                 87%
                                                  Manufacturing 9%                  91%
                                 Agriculture, energy and water 15%                   85%
                                                            0%      20%       40%     60%   80%    100%   120%
                                                                                % in employment

                                                     Part-Time    Full-Time

Source: Census 2011

Construction accounts for 25% of self-employed residents in the CLLD area with the wholesale
and retail trade and repair of motor vehicles and motor cycles accounting for 14% and
transport and storage accounting for a further 9%.

Analysis of employment by occupation reveals that elementary occupations (14%) and skilled
trades (13%) account for the largest proportion of residents, reflecting the higher than
average levels of employment in manufacturing and construction industries. By contrast
Figure 2.12 over, shows that the area has lower levels of resident employed in higher level
occupations, such as managerial, professional and associate professional occupations.

11This data is based on MSOAs rather than LSOAs.
NorthDurhamCLLDFinalDraft                                                                                        13
Figure 2.12: Resident Employment by Occupation
Occupation N.Durham CLLD Durham NELEP England
Managers, directors and
8% 9% 9% 11%
senior officials
Professional occupations 10% 14% 15% 17%
Associate professional and
9% 11% 11% 13%
technical occupations
Administrative and
12% 11% 12% 11%
secretarial occupations
Skilled trades occupations 13% 13% 12% 11%
Caring, leisure and other
11% 10% 10% 9%
service occupations
Sales and customer service
11% 9% 10% 8%
occupations
Process plant and machine
12% 10% 9% 7%
operatives
Elementary occupations 14% 12% 12% 11%
Total 100% 100% 100% 100%
Source: Census 2011
The occupational profile of the workplace population of the CLLD area is broadly similar to
that of the resident population, although proportions of employment in skilled trade
occupations are 2% higher among the workplace population and those for caring, leisure and
other service occupations are 3% higher.
2.2.3 Skills and Qualifications
There is a significant qualification deficit in North Durham with a third (33%) of residents aged
16 and above having no qualifications. This compares poorly to the national average of 22%
and is notably higher than County Durham (28%) and NELEP (26%) averages. The difference
is similarly stark for higher level qualifications at Level 4 and above with only 16% of North
Durham CLLD area residents possessing a qualification at this level compared to 27% across
England, 21% in County Durham and 23% across NELEP.
Figure 2.13: Highest Qualification
N.Durham
Highest Qualification Durham NELEP England
CLLD
No qualifications 33% 28% 26% 22%
Other qualifications 4% 4% 4% 6%
Level 1 qualifications 15% 13% 14% 13%
Level 2 qualifications 17% 16% 16% 15%
Apprenticeship 4% 4% 5% 4%
Level 3 qualifications 12% 14% 13% 12%
Level 4 qualifications and above 15% 21% 23% 27%
Total 100% 100% 100% 100%
Source: Census 2011
NorthDurhamCLLDFinalDraft 142.2.4 Unemployment and Economic Inactivity
The proportion of North Durham residents that are unemployed is higher than the averages
for County, NELEP and England. Modelling 2011 Census and ONS population data suggests
that there are approximately 2,020 unemployed12 residents in North Durham, of which 62%
are male. However, it is important to look beyond unemployment statistics when analysing
out of work populations as in isolation this figure masks the true scale of this group in any
area. For example, in North Durham alone there are approximately 11,670 economically
inactive residents13 of which 58% are female, and around 6,650 are retirees or non-working
students (57% of the economically inactive total). Given that ESF is targeted at the
unemployed and economically inactive this suggests a total of approximately 7,030 potential
beneficiaries for ESF supported activity in the CLLD area, of which 53% are female.
Those who are economically inactive and long-term sick or disabled form a significant
proportion of this group (39%) with around 2,720 residents categorised as such (see Figure
2.14, below).
Figure 2.14: Unemployment and Economic Inactivity Estimates by Gender
Economic Activity Gender Estimate %
Females 773 38%
Unemployed Males 1,246 62%
Total 2,019 100%
Females 6,705 57%
Inactive Males 4,960 43%
Total 11,666 100%
Females 2,967 59%
Inactive (minus retirees and students) Males 2,044 41%
Total 5,012 100%
Females 1,221 45%
Inactive: Long-term sick or disabled Males 1,497 55%
Total 2,718 100%
Females 3,741 53%
Total Unemployed and Inactive (minus retirees
Males 3,290 47%
and students)
Total 7,031 100%
Source: ONS Population Estimates, 2013; Census 2011.
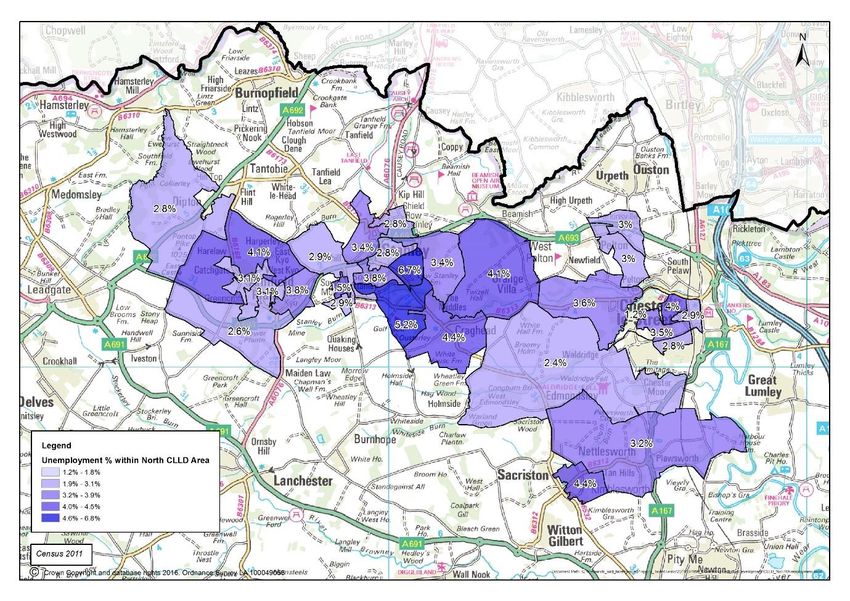
Figure 2.15 over, shows the distribution of unemployment in North Durham by LSOA.
12 Based on the ILO definition of unemployment used in the Census which is anybody who is not in employment
by the above definition, has actively sought work in the last 4 weeks and is available to start work in the next 2
weeks, or has found a job and is waiting to start in the next 2 weeks, is considered to be unemployed.
13 These are people that are not in employment who have not been seeking work within the last 4 weeks and/or
unable to start work within the next 2 weeks. Reasons for this can include caring responsibilities, disability or
long-term illness, retirement and other reasons.
NorthDurhamCLLDFinalDraft 15Figure 2.15: Unemployment by LSOA
Source: Census 2011
Longer-term disengagement from the labour market is a real issue within North Durham with
around 860 people or 43% of unemployed residents being out of work for two years or more,
while around 400 residents or one in five unemployed people in the area have never worked.
This highlights the challenges in supporting many of the unemployed residents of North
Durham towards or into employment. In addition more than a third of unemployed residents
are young adults aged 16 to 24. While current provision under the County Durham wide
Durham Works Programme will target this group until 2018, this does point towards the need
for some provision under CLLD following Durham Works.
Figure 2.16: Unemployment by Age and Status
N.Durham CLLD
Estimate %
Unemployed: Age 16 to 24 683 34%
Unemployed: Age 25 to 49 1,052 52%
Unemployed: Age 50 to 74 284 14%
Unemployed: Never worked 402 20%
Long-term unemployed (2 years or more) 867 43%
Source: ONS Population Estimates, 2013; Census 2011.
NorthDurhamCLLDFinalDraft 16Family based approaches potentially present an important mechanism for engaging the
unemployed within North Durham, with 19% of families with dependent children having no
working parent in the household14.
The claimant count provides another method for measuring unemployment in the North
Durham CLLD area. The claimant count shows the number of people who are receiving
benefits principally for the reason of being unemployed, which is those who claim Job Seeker’s
Allowance and those who claim Universal Credit but are out of work. Data from the
Department for Work and Pensions in June 2016 shows a claimant count of 920 residents in
North Durham CLLD. Figure 2.17 below provides an overview of the claimant count by age
and gender.
Figure 2.17: Claimant Count by Age and Gender
Indicator No. of residents
Claimant count 920
18-24 245
25-34 215
35-49 245
50+ 210
Male 605
Female 315
Source: DWP Claimant Count, April 2016.
Figure 2.14 previously highlighted the significance of the economically inactive population
that are long term sick or disabled. Recent welfare reforms have seen a shift in circumstances
with this group, including the transition from Incapacity Benefit (IB) to Employment and
Support Allowance (ESA) have enhanced the need for supporting this group towards labour
market participation, with ongoing reforms related to Universal Credit and other factors further
increasing the demand for support. Consultation and provision reviews undertaken as part of
the LDS development process identifies health, disabilities and mental health as key areas for
targeting employment related support through CLLD in North Durham. In particular the work
related activity group among those claiming ESA have been identified through primary and
secondary research as a key target for any such support. Those within this group have been
identified as having a disability or health condition that limits their ability to work, but that
things can be done to improve their chances of working in the future. However, it is widely
acknowledged that many of those in the group fail to get the level of support they require to
advance into and within the labour market. Across County Durham around 19% of ESA
claimants are classified within the work related activity group.
Analysis of the ESA work related activity group across Durham reveals that:
65% are aged 45 years and above with only 5% aged 18 to 24;
46% receive ESA due to a mental health and/or behavioural disorders while 21%
receive it due to diseases of the musculoskeletal system and connective tissue;
14
This includes couple families with neither parent working and single parent families with the parent
not working.
NorthDurhamCLLDFinalDraft 17 Mental health and/or behavioural disorders are more common among younger ESA
claimants in the work related activity group with 58% of 25 to 34 year olds, 56% of
35 to 44 year olds and 50% of 45 to 49 year olds receiving the benefit for such
conditions.
A survey of public, private and VCS organisations across the North Durham area was
undertaken to inform the development of the LDS. The 124 respondents to this survey were
asked to rank a number of barriers to labour market participation for North Durham residents,
with the lack of local employment opportunities ranked the most significant barrier with an
average score of 2.78 (with 1
being the lowest possible score)
and 4 out of 10 respondents
selecting it first. This illustrates
the importance of integrating ESF
and ERDF at the local level
through CLLD in order to enable
those accessing employment
related support to access
employment opportunities created
through business or enterprise
support.
Indeed while evidence shows that
local employment opportunities
exist both within the CLLD area
and in close proximity to it, the
perception of a lack of local
opportunities is an important
barrier for CLLD to address,
particularly when seeking to move
people towards or into
employment. Community and
support agency consultation
revealed the presence of a cultural
or psychological barrier among
some of those that are furthest
from the labour market, in terms
of the willingness to travel to access employment opportunities. Section 2.3 below shows
that much of the local population can access significant employment centres within reasonable
commuting times by public transport and/or walking. However, some potential CLLD
beneficiaries in North Durham will not see these travel times as reasonable or deem
employment opportunities that require some travel time as accessible. Addressing this
perception and changing culture and behaviour is therefore almost, if not equally, as important
for CLLD as stimulating the creation of employment opportunities. This in turn has implications
for how support is delivered as well as the kind of support interventions that are funded by
CLLD.
NorthDurhamCLLDFinalDraft 18Figure 2.18: Prioritisation of Barriers to Labour Market Participation
% % %
selecting selecting selecting
as most as second as third
Priority Average significant most most
Ranking Score* barrier significant significant
Lack of local employment opportunities 1 2.78 41% 24% 11%
Pockets of deprivation among specific
communities 2 4.69 19% 11% 3%
Low local skills base 3 4.76 3% 19% 19%
Lack of local capacity to address key
issues 4 4.82 14% 11% 14%
Lack of local training and development
opportunities 5 5.06 8% 3% 14%
Insufficient or lack of awareness of local
information, advice and guidance 6 5.08 5% 8% 14%
Difficulties accessing employment in other
areas 7 5.46 0% 19% 11%
Lack of support to address health
and wellbeing (including mental health) 8 6.03 3% 5% 6%
Lack of support to address debt and
money management 9 6.29 8% 0% 8%
Total - - 100% 100% 100%
* The lower the score the higher the priority.
The survey findings also highlighted the need for geographic and community based targeting
of support to increase local capacity and develop the local skills base in order to address
pockets of deprivation among specific communities and localities. The need for community
focussed and embedded activity to address the needs of the long-term unemployed and
inactive and those who experience multiple complex barriers to employment and even
engagement in services, was a key priority among agencies, organisations, businesses and
individuals consulted through the LDS development process.
2.2.5 Business Base
It is estimated that there are around 1,340 local units15 or workplaces in the North Durham
CLLD area16 of which 80% are micro sized with 0-9 employees and a further 16% are small
with 10 to 40 employees. Analysis by local enterprise17 shows that micro-enterprises dominate
accounting for 87% of total enterprises in the area (see Figure 2.19). In addition, despite
lower levels of self-employment North Durham has a relatively high proportion of sole-traders
among the local enterprise base compared with County, regional and national averages.
15 Local units are an individual site, such as a factory or shop, associated with an enterprise. Therefore it can also
be described as a workplace.
16 It should be noted that these figures will represent an overestimate as they are based on mid-layer Super
Output Areas rather than LSOAs, as this is the lowest geography at which this data is available.
17 An enterprise can be thought of as an overall business, made up of all the individual sites or workplaces of a
particular business in that area. It is comprised of is the smallest combination of legal units which has a certain
degree of autonomy within an Enterprise Group.
NorthDurhamCLLDFinalDraft 19Figure 2.19: Business Base18
Workplaces Enterprises
No. % No. %
Micro (0 to 9) 1,075 80% 910 88%
Small (10 to 49) 210 16% 110 11%
Medium-sized (50 to 249) 55 4% 20 2%
Large (250+) 0 0% 0 0%
Total 1,340 100% 1,040 100%
Source: UK Business Counts, 2015.
Retail, wholesale and the motor trade industries account for the largest proportion of
workplaces, enterprises and workplace employment in the North Durham CLLD area (see
Figure 2.20, below. It also illustrates industries that are characterised by large workplaces
or enterprises. For example, while education accounts for 10% of workplace employment,
they only account for 4% of workplaces. In addition the difference between the proportion of
workplace employment and workplaces in manufacturing suggests the sector has a number
of medium to larger workplaces and enterprises in the CLLD area. In contrast, industries such
as construction, accommodation and food services, and professional, scientific and technical
services account for a larger proportion of workplaces than workplace employment,
highlighting the prevalence of micro and small businesses in these industries.
Figure 2.20: Business Base and Workplace Employment by Industry19
% of
% of % of Workplace
Industry Workplaces Enterprises employment
Agriculture, forestry & fishing (A) 2.6% 3.3% 0.4%
Mining, quarrying & utilities (B,D and E) 0.7% 1.0% 1.4%
Manufacturing I 6.0% 6.2% 10.2%
Construction (F) 12.3% 14.8% 10.0%
Wholesale and retail trade; Motor trades (G) 18.3% 17.7% 16.9%
Transport & storage (inc postal) (H) 5.6% 6.2% 5.9%
Accommodation & food services (I) 8.6% 9.6% 6.5%
Information & communication (J) 2.6% 3.3% 1.1%
Financial & insurance (K) 1.5% 1.0% 2.0%
Property (L) 1.9% 1.9% 1.7%
Professional, scientific & technical (M) 8.6% 11.0% 2.8%
Business administration & support services (N) 6.7% 7.7% 4.3%
Public administration & defence (O) 1.5% 0.5% 6.0%
Education (P) 3.7% 1.4% 10.1%
Health and social care (Q) 10.4% 5.3% 15.4%
Arts, entertainment, recreation & other services
(R,S,T and U) 9.0% 9.1% 5.1%
Total 100% 100% 100%
Source: UK Business Counts, 2015.
Figure 2.21 below shows that the number of active enterprises increased across County
Durham between 2012 and 2014 following a decline between 2009 and 2012.
18 These figures are based on MSOAs rather than LSOAs, as this is the lowest geography at which this data is
available.
19 As above.
NorthDurhamCLLDFinalDraft 20Figure 2.21: Active Enterprises in County Durham
13,000
12,800
Active Enterprises
12,600
12,400
12,200
12,000
11,800
2009 2010 2011 2012 2013 2014
Source: Business Demography 2014.
Business survival rates across County Durham are broadly similar to regional and national
averages for over 1, 2 and 3 year periods, with around 60% of businesses born in 2011
surviving for 3 years.
Figure 2.22: Business Survival Rates in County Durham
100.0% 93.8% 94.3% 93.5%
90.0%
80.0% 74.1% 75.6% 73.7%
70.0%
59.8% 59.4% 60.4%
60.0%
% of Business Births
50.0%
40.0%
30.0%
20.0%
10.0%
0.0%
Births in 2013 - 1 year survival Birth in 2012 - 2 year survival Birth in 2011 - 3 year survival
rate rate rate
County Durham North East England
Source: Business Demography 2014.
In addition to Durham and wider North East focussed business support provision North
Durham benefits from a local enterprise agency focussed on supporting local entrepreneurs
and start-ups; while the area also benefits from some strong business networks. However,
the Enterprise Agency has limited resources and capacity to fully address all local needs.
Figure 2.23 below shows how respondents to the North Durham CLLD survey rated local
NorthDurhamCLLDFinalDraft 21barriers to business growth and creation in North Durham, with the top 4 barriers identified
as lack of:
1. Investment/finance opportunities, particularly in terms of small-scale grant funding to
enable start-up or business growth among groups and communities which have low
levels of access to finance;
2. Local business support and advice, including that targeted at social enterprise
particularly given the need to move away from grant dependency and local asset
transfer and service transformation agendas, including The Durham Ask;
3. Support to grow small scale businesses, including start-up support for those that are
some distance from being enterprise ready; and
4. Local entrepreneurial culture, particularly among certain groups and communities.
Figure 2.23: Prioritisation of Barriers to Business Growth and Creation in North
Durham
% % %
selecting selecting selecting
as most as second as third
Priority Average significant most most
Ranking Score* barrier significant significant
Lack of availability of investment for
businesses 1 3.24 24% 19% 8%
Lack of local business support and
advice 2 3.32 11% 35% 11%
Lack of support to grow small scale
businesses 3 3.53 24% 11% 29%
Lack of local entrepreneurial culture 4 3.91 11% 14% 11%
Poor business networks 5 4.29 14% 5% 11%
Poor availability of appropriate
business space 6 4.33 16% 3% 18%
Lack of specialist business skills to
enter new markets 7 4.42 0% 14% 13%
Total - - 100% 100% 100%
* The lower the score the higher the priority
The North Durham area contains a number of industrial estates, including Craghead, Pelton
Fell North, Stella Gill and Harelaw, while Drum Industrial Estate lies closely to the East of one
of its most disadvantaged areas in Pelton. While ‘availability of appropriate business space’
was not identified as one of the top priorities for the area, intelligence from Business Durham
shows ongoing high levels of demand for office space (particularly 135sq.ft-350sq.ft), while
demand for industrial property remains strong.
2.3 Local Services and Infrastructure
North Durham has a relatively strong and vibrant voluntary and community sector, with a
number of organisations with a strong track record in service delivery and a number taking
ownership over community assets. This includes organisations that operate across the North
Durham CLLD area as well as community focussed groups in key towns and settlements across
the area, including North Pelton, Chester-le-Street, Stanley and Dipton. However, many of
these organisations have limited capacity and resources, with many requiring support to
enhance their financial viability and deliver the services required by the community.
NorthDurhamCLLDFinalDraft 22Infrastructure and access to local services is relatively good across the CLLD area, with the
area encompassing or in close proximity to a number of key service centres, including Stanley,
Chester-le-Street and Sacriston. These and other town centres act as the principal service
access points for many residents of the North Durham CLLD area and Department for
Transport (DfT) data shows that all residents live within 30 minutes of at least one town centre
by public transport/walking and 41% live within 15 minutes by the same method(s). However,
some areas can experience transport issues which can impact upon their access to services
and employment, particularly outside of peak hours in communities such as the areas of
Dipton at the North West tip of the CLLD area.
Many residents work outside of the area with around 3 times as many people commute out
of the area to work compared with those commuting in to the area to work. However, access
to private transport is particularly low in the area with 27% of residents aged 16 and over
living in a household with no access to a car or van compared with 21% across County Durham
and 20% across England. Unsurprisingly such access issues are even more significant for
North Durham residents that are out of work with 45% of residents that are unemployed and
46% of those that are economically inactive due to a long-term sickness or disability, having
no access to a car or a van. Given these issues it is important to consider the accessibility of
employment sites and centres for communities across the CLLD area. Figure 2.24 over,
shows the accessibility of employment centres by public transport and/or walking for the
economically active population of the North Durham CLLD area. This shows that by public
transport/walk:
95% of economically active residents live within 15 minutes of employment centres
with 100 to 499 jobs;
58% of economically active residents live within 15 minutes of employment centres
with 500 to 4,999 jobs;
All economically active residents live within 30 minutes of employment centres with
100-499 and 500-4,999 jobs;
89% of economically active residents live within 45 minutes of employment centres
with 5,000+ jobs.
NorthDurhamCLLDFinalDraft 23Figure 2.24: Accessibility of Employment Centres by Public Transport/Walk
% of economically
Indicator active population
Residents within 15 minutes of employment centres with
100 to 499 jobs 95%
Residents within 15 minutes of employment centres with
500 to 4999 jobs 58%
Residents within 15 minutes of employment centres with at
least 5000 jobs available 0%
Residents within 30 minutes of employment centres with
100 to 499 jobs 100%
Residents within 30 minutes of employment centres with
500 to 4999 jobs 100%
Residents within 30 minutes of employment centres with at
least 5000 jobs 12%
Residents within 45 minutes of employment centres with
100 to 499 jobs 100%
Residents within 45 minutes of employment centres with
500 to 4999 jobs 100%
Residents within 45 minutes of employment centres with at
least 5000 jobs 89%
Residents within 60 minutes of employment centres with
100 to 499 jobs 100%
Residents within 60 minutes of employment centres with
500 to 4999 jobs 100%
Residents within 60 minutes of employment centres with at
least 5000 jobs 100%
Source: DfT Journey Time Statistics, 2014.
The average distance travelled to work for North Durham CLLD residents is lower than County
Durham and NELEP averages at 14.5km compared with 17.4km and 16.7km respectively; with
85% of working residents travelling less than 20km to work.
2.4 Deprivation and Disadvantage
In assessing the development needs and potential of the area it is important to consider issues
other than employment and skills. Section 1 of this LDS showed levels of overall deprivation
and disadvantage across the LSOAs that comprise the North Durham CLLD area. Analysis of
overall IMD scores across different indicators reveals that health is a particular acute issue
within the area. Figure 2.25, over, shows the CLLD area against some of the core non-
employment related domains from the Indices of Multiple Deprivation. This shows that 71%
of the LSOAs in North Durham are ranked among the 20% most deprived in the country in
terms of health and disabilities20 with 54% ranked among the 20% most deprived for
income21. By contrast none of the LSOAs in the North Durham CLLD area rank among the
20% most deprived for the living environment, which focuses on housing and local
environment.
20 Indicators used here include premature death, disability and illness ratio, measures of acute morbidity and
sufferers of mood or anxiety disorders.
21 Indicators used here include a number of out of work and income support benefits.
NorthDurhamCLLDFinalDraft 24Figure 2.25: Deprivation and Disadvantaged
IMD Domain
Living
Health Income Environment
% of LSOAs in the 10% most deprived 14% 18% 0%
% of LSOAs in the 20% most deprived 71% 54% 0%
% of LSOAs in the 50% most deprived 100% 89% 7%
Source: IMD, 2010.
In addition foodbank data for the area suggests around 2,639 people22 have been referred to
foodbanks in the North Durham CLLD area and have received more than one food parcel,
further highlighting issues of poverty and disadvantage in the area.
2.5 SWOT Analysis
Figure 2.26, over, provides an overview of a SWOT analysis of the North Durham CLLD area.
The SWOT builds on a range of primary and secondary data sources and was informed and
shaped through:
Analysis of key data sources, including those outlined above;
A web based questionnaire which secured 124 participants from across the community
and provided people and organisations with the opportunity to identify key priorities
for action;
Consultation with communities and public, private and voluntary and community sector
organisations based or operating within North Durham, this includes:
o Initial interviews with key
agencies and organisations to
supplement the data analysis
and questionnaire and shape
the initial STOW analysis;
o a number of drop-in workshop
and discussion sessions which
focussed entirely on reviewing
and refining the SWOT
analysis;
o Presentations and discussions
with AAP Boards and relevant
AAP Task & Finish Groups and
members of the public to
inform the refinement of the
SWOT;
o LAG meetings and feedback on
draft LDS documentation to
finalise the SWOT.
Further detail on these community involvement processes is available in Section 4 of this LDS.
22
This includes 1,588 adults and 751 children.
NorthDurhamCLLDFinalDraft 252.26 ‘SWOT’ Analysis
Strengths Weaknesses
People People
Employment rates higher than the County average and in- Levels of unemployment and economic inactivity due to long-term
line with the NELEP average sickness or disability higher than County, regional and national
High number of apprentices averages
Strong voluntary and community sector and active citizenry Relatively high levels of health and income related deprivation
Loyal and resilient workforce Almost a third of the 16+ population have no qualifications
Presence of Durham Works to focus on supporting young Significant levels of long-term unemployment
people until 2018 High levels of mental health and behavioural disorders among ESA
claimants, including the work related activity group
Place 3 times more commute out of the area to work than commute-in
Presence of and proximity to key employment centres
Relatively strong road and rail transport and communication Place
links, particularly in the east of the area Relatively low levels of car/van ownership and off-peak public
Local service centres acting as social and economic hubs transport issues, causing issues in accessing employment
Community facilities and local community focused service opportunities for some communities
provision Significant pockets of deprivation, unemployment and economic
Area Action Partnerships inactivity
Limited local capacity for employment and business support,
Economy including social enterprises
Higher employment density rates than the County and
regional average Economy
High levels of employment in skilled trades Relatively small business base
Strong wholesale & retail and health & social care sectors Lack of entrepreneurial culture and low levels of self-employment,
Relatively high levels of employment in particularly among females
manufacturing/engineering and construction Relatively high levels of part-time employment
Proactive networking groups and locally based business Limited number of local employment opportunities with survey
support infrastructure respondents highlighting this as the key barrier to growing labour
Increasing number of active enterprises market participation
Lack of low level and low risk finance to support start-up and
business growth
Lack of modern industrial property available
NorthDurhamCLLDFinalDraft 26You can also read