Comparing and Managing Multiple Versions of Slide Presentations - Microsoft
←
→
Page content transcription
If your browser does not render page correctly, please read the page content below
Comparing and Managing Multiple
                                    Versions of Slide Presentations
        Steven M. Drucker      Georg Petschnigg                                                  Maneesh Agrawala
                   Microsoft Research                                                      University of California, Berkeley
                   One Microsoft Way                                                       615 Soda Hall, Mail Code #1776
               Redmond, WA 98052, USA                                                      Berkeley, CA 94720-1776, USA
            {sdrucker|georgp}@microsoft.com                                                   maneesh@cs.berkeley.edu
ABSTRACT                                                                           gether the appropriate pieces from the collection. Similarly,
Despite the ubiquity of slide presentations, managing mul-                         when collaborating with others on creating a presentation,
tiple presentations remains a challenge. Understanding how                         the collaborators will often start from a common template,
multiple versions of a presentation are related to one an-                         then separately fill in sections on their own and finally as-
other, assembling new presentations from existing presenta-                        semble the different versions together. Yet, current presen-
tions, and collaborating to create and edit presentations are                      tation creation tools [1, 12, 24] provide little support for
difficult tasks. In this paper, we explore techniques for                          working with multiple versions of a presentation simultane-
comparing and managing multiple slide presentations. We                            ously. The result is that assembling a new presentation from
propose a general comparison framework for computing                               older versions can be very tedious.
similarities and differences between slides. Based on this                         In this paper we present new techniques and tools for visu-
framework we develop an interactive tool for visually com-                         ally comparing and managing multiple versions of slide
paring multiple presentations. The interactive visualization                       presentations. Our work makes three main contributions:
facilitates understanding how presentations have evolved                           Comparison framework: We develop a framework for
over time. We show how the interactive tool can be used to                         comparing presentations to identify the subsets of slides
assemble new presentations from a collection of older ones                         that are similar across each version. There are a number of
and to merge changes from multiple presentation authors.                           ways to measure similarity between presentations, including
ACM Classification: H5.2 [Information interfaces and                               pixel-level image differences between slides, differences
presentation]: User Interfaces. - Graphical user interfaces.                       between the text on each slide, etc. We propose several
General Terms: Algorithms, Design, Human Factors.                                  such distance measures and discuss how they reveal the un-
Keywords: Slide presentations, versions, distance metrics,
                                                                                   derlying similarities and differences between presentations.
correspondence, alignment                                                          Interactive visualization: We provide an interactive tool
                                                                                   for viewing multiple versions of a presentation. Users can
1       INTRODUCTION
                                                                                   examine differences between presentations along any of the
Slide presentations have become a ubiquitous means of                              distance measures computed by our comparison framework.
sharing information. In 2001, Microsoft estimated that at                          The visualization is designed to help users understand how
least 30 million PowerPoint presentations were created                             the presentation has evolved from version to version and
every day [19]. Knowledge workers often maintain collec-                           determine when different portions crystallized into final
tions of hundreds of presentations [3]. Moreover, it is                            form. Users can identify sections of the presentation that
common to create multiple versions of a presentation,                              changed repeatedly. Such volatility might indicate problem-
adapting it as necessary to the audience or to other presen-                       atic areas of the presentation and can help users understand
tation constraints. One version may be designed as a 20                            the work that went into producing the presentation.
minute conference presentation for researchers, while an-
other version may be designed as an hour long class for un-                        Interactive assembly: Our interactive tool also facilitates
dergraduate students. Each version contains different as-                          assembly of new presentations from the existing versions.
pects of the content.                                                              Users can select subsets of slides from any version and
                                                                                   copy them into a new presentation. The tight integration of
A common approach to building a new presentation is to
                                                                                   visualization and assembly allows users to see the history of
study the collection of older versions and then assemble to-
                                                                                   a presentation and combine relevant parts into the new pres-
                                                                                   entation. Such an assembly tool is especially useful for col-
    Permission to make digital or hard copies of all or part of this work for
    personal or classroom use is granted without fee provided that copies are
                                                                                   laborative production of presentations. Authors can inde-
    not made or distributed for profit or commercial advantage and that cop-       pendently edit the presentation and then use our assembly
    ies bear this notice and the full citation on the first page. To copy other-   tool to decide which portions of each version to coalesce
    wise, or republish, to post on servers or to redistribute to lists, requires   into the final presentation.
    prior specific permission and/or a fee.
    UIST'06, October 15–18, 2006, Montreux, Switzerland.
    Copyright 2006 ACM 1-59593-313-1/06/0010...$5.00.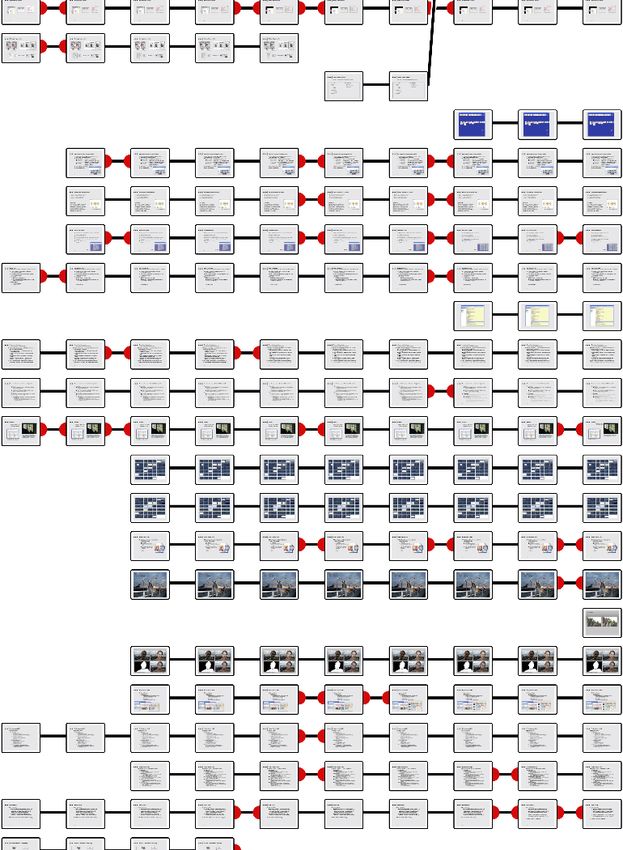
Visual Comparison Window                   Presentation Assembly Window              Slide Preview Window
    Figure 1: Our interactive visualization and assembly tool is comprised of a Visual Comparison window (left), a Presenta-
    tion Assembly window (middle) and a Slide Preview window (right). Users examine multiple presentations (each column
    of the Visual Comparison window shows a different presentation) and find the similarities and differences between
    them. Users can select any subset of slides from the Visual Comparison window and assemble them into a new presen-
    tation. The Slide Preview window allows users to inspect one slide and its alternate versions in greater detail.

A screenshot of our tool is shown in Figure 1. In this case,       required to convert one string into another. File differencing
the Visual Comparison Window (Figure 1 left) shows 10              programs based on edit-distance are often used by pro-
versions of a presentation – one per column. Lines linking         grammers to find all the lines of codes that were inserted,
slides and alignments between slides indicate slides that are      deleted or changed between two versions of a file. Similar
similar to one another from one version to the next. We dis-       techniques have been used to automatically detect plagia-
cuss our comparison framework in Section 3 and then show           rism [18] and to find the best alignment between genetic
how it is used to generate the visualization of multiple pres-     sequences [15]. We use string edit distance to help compute
entations in Section 4. Users can select any subset of slides      distances between slides (Section 3.2.2), find corresponding
from the Visual Comparison Window and copy them into               slides between presentations (Section 3.3), and align slides
the Assembly Window (Figure 1 middle) to create a new              in our visualization (Section 4.1).
presentation. A gray border in the Assembly window indi-           Computing differences between data sets solves only part of
cates that several slightly different versions of the slide are    the problem. For large data sets it is essential to provide
available. Users can also select a single slide either in the      visualizations that depict the changes and make it easy for
Visual Comparison Window or in the Assembly Window                 viewers to focus on the similarities and differences between
and an enlarged version of it appears in the Slide Preview         versions. SeeSoft [5] and SeeSys [6] provide focus+context
window (Figure 1 right). The selected slide is highlighted         tools for visualizing differences in text files. Viégas et al.
with a blue border in both the Visual Comparison Window            [22] developed the history flow system to visually compare
and the Assembly Window. We describe the interactive as-           the changes made to Wikipedia articles. Using history flow
sembly process in Section 5. We provide examples showing           they uncover a variety of patterns of cooperation and con-
how our system can be used to compare and manage multi-            flict that arose naturally as authors collectively created and
ple presentations in Section 6 and conclude in Section 7.          edited Wikipedia. Their system is aimed at visualizing hun-
2      RELATED WORK                                                dreds of versions of text documents. While we draw on this
Finding the similarities and differences between two or            work for inspiration, our work is aimed at comparing slide
more datasets is a problem that occurs in many contexts.           presentations that contain graphics, images, and text. Unlike
File differencing tools such as UNIX’s diff [10] highlight         the earlier systems, we also provide tools for assembling
line level changes between two documents. These programs           new presentations from older versions.
treat files as an ordered sequence of lines and typically          Slide presentation tools such as PowerPoint [12], Keynote
compute the Longest Common Subsequence (LCS) of lines              [1], and OpenOffice Impress [17] usually focus on provid-
between two files using dynamic programming techniques             ing tools for creating and presenting a sequence of slides.
[9, 11]. The LCS algorithm is related to the concept of            While PowerPoint does provide a “track change” mode for
string edit distance first introduced by Levenshtein [11].         merging changes between two presentations, it forces a spe-
The string edit distance is defined as the minimum number          cific workflow. Users must process slides one at a time and
of operations (e.g. insertions, deletions, and substitutions)      accept or reject changes. PowerPoint does not provide any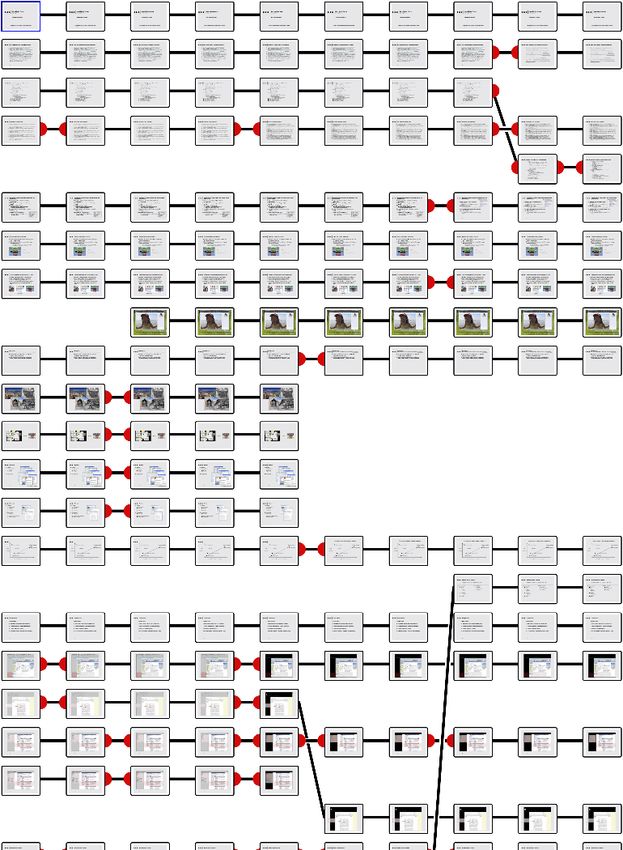
way of seeing an overview of all the differences between
multiple presentations at once. Our system provides this
overview and allows users to work with multiple presenta-
tions simultaneously.
While current commercial slide creation software focuses            Sales Data
                                                                                    Team Meeting

                                                                      Southern Region
                                                                      Northern Region

on producing a single linear sequence of slides, several re-
                                                                    Unit Forecast
                                                                      Major Markets
                                                                        West and East Province

                                                                        Upper Territory

search systems support multiple paths though a presenta-
tion. Pad[20] and CounterPoint [7] are zoomable interfaces
that allow spatially positioning slides on an infinite canvas
and support hyperlinked navigation to any slide in the pres-
entation. Zellweger [23] has developed a system for build-
ing multimedia documents embedded with multiple scripted                          Figure 2: Slide features currently used in our com-
paths. Nelson et al.’s [16] Pallete system is a tangible, pa-                     parison framework.
per-based interface for organizing presentations. More re-
cently, Moscovich et al. [14] have developed a system that         PowerPoint [13], Apple’s Keynote [1] or OpenOffice’s Im-
allows users to choose between multiple paths, on-the-fly,         press [17].
as they are giving the talk. All of these systems facilitate the   Figure 2 describes the features that we use in our frame-
process of customizing a presentation. Our system is aimed         work. Although our implementation currently includes only
at comparing and managing multiple presentations, there-           a few basic features that we have found most useful for
fore, it is largely orthogonal to these techniques and could       comparing presentations, the framework could easily be ex-
be used in conjunction with any of them.                           tended to handle other descriptive features of a slide.
3     COMPARISON FRAMEWORK                                         3.2                           Distance Operators
The goal of comparing two slide presentations is to identify       The first step in comparing two presentations is to compute
all of the similarities and differences between the slides         distances between the slides with respect to underlying slide
within each presentation. The key step is to find the “best”       features. Each distance operator takes two presentations and
matching slide from the second presentation for each slide         computes a distance between every pair of slides with the
in the first presentation. We can compute such matching            first slide from the first presentation, and the second slide
correspondences with respect to many different features of         from the second presentation. All of our current distance
the slides. Moreover, the best correspondence with respect         operators are symmetric, though the framework can handle
to one feature may not be the best with respect to another         asymmetric distance operators as well.
feature. Thus, we have developed a general framework for           3.2.1                           Image Distance
computing correspondences with respect to a variety of fea-        We compute the image distance between two slides by cal-
tures. Users can easily extend the framework to compute            culating the mean square error (MSE) between their bitmap
new types of correspondence.                                       images. The MSE measures visual similarity with smaller
For each slide in a presentation, we extract a set of basic        values indicating greater similarity. A MSE of zero means
features (discussed in Section 3.1) and then use feature-          that the two slides are visually identical to one another,
specific distance operators (Section 3.2) to compute a set         while a large MSE implies that there may be large visual
of distances between pairs of slides. Next we apply corre-         differences between the slides.
spondence operators (Section 3.3) to find the “best” match         A drawback of MSE, is that it often does not match human
between a slide in the first presentation and a slide in the       perceptions of visual differences. For example, slightly
second presentation.                                               changing the position of an image between two slides can
3.1    Slide Features                                              produce a large MSE, even though the slides will look very
We consider any basic descriptive element of a slide to be a       similar. Similarly, a minor insertion or deletion of text that
feature. The graphical elements including vector drawings,         causes the text to reflow will produce a relatively large
images, charts and tables, as well as the text contained on a      MSE. Yet, the meaning of the text may not have changed at
slide are all examples of slide features. We also consider         all. Alternate image distance measures based on sub-region
the bitmap image of a slide to be a feature of it. Other ex-       comparisons may be less sensitive to small changes in slide
amples of slide features include the position of text boxes        layout. Image distance metrics based on models of human
and graphic elements, background graphics or colors, for-          visual perception might also provide more meaningful dis-
matting parameters of text, header text, footer text, note         tances. Nevertheless we have found MSE to be a very use-
text, and animation settings. Some features are specific to        ful measure of slide similarity, especially for identifying
the tool used to create the presentation. For example,             visually identical slides.
PowerPoint assigns a unique ID for each slide and for each         3.2.2                           Text Distance (Levenshtein or Edit Distance)
image on a slide. For a comprehensive list of object model         As mentioned previously, the string edit distance measures
level features see the file format specifications of Microsoft     the minimum number of operations required to convert one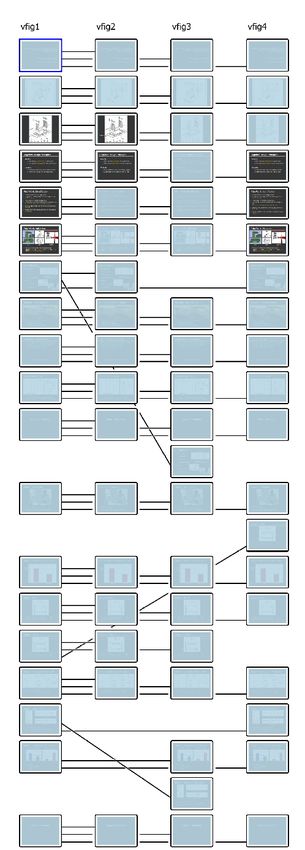
string into another string. Our text distance operator uses        to compare slides that contain extensive amounts of text
Levenshtein’s dynamic programming algorithm [11] to effi-          and those that contain no text, but only images.
ciently compute the edit distance between textual features         One challenge in developing such composite distance func-
such as Slide Title and Body Text. The algorithm builds a          tions is normalizing the individual distance operators so
matrix of costs required to convert one string into another        that they can be meaningfully combined with one another.
and then reports the minimum cost path through this matrix.        For example, image distances are measured in color space,
For completeness, we provide a brief description of the            while text distances are measured with respect to the num-
string edit distance algorithm in Appendix A.                      ber of insertions/deletions required to convert one string
Another approach for comparing text strings is based on a          into another. In our current implementation we choose the
trigram model [21]. The idea is to build a histogram of all        normalization factors by manually looking at and adjusting
three letter sequences of characters within each string. The       the ranges of the individual distances.
distance between the strings is then computed as the dot           A second challenge is to choose how to combine the nor-
product of the histograms. The advantage of this approach          malized distances. Taking the minimum distance essentially
is that it is less sensitive than string edit distance to rear-    considers only the best matching feature as the representa-
rangements of text. For example, reordering bullet points in       tive distance between slide pairs. Another approach is to
the body text of a slide will yield a large string edit distance   compute a weighted sum of the individual distances. While
but a relatively low trigram distance. In our system, we cur-      the user could then control the importance of each distance
rently use string edit distance and have found that it gives a     operator by setting its weight, choosing appropriate weights
good measure of text similarity. We leave it as future work        may be a difficult task.
to compare the trigram approach with string edit distance
for presentation comparisons.                                      3.3     Slide Correspondence Operators
                                                                   To find the best match between slides in each presentation
3.2.3    Slide ID and Picture ID Distances
                                                                   we compute slide to slide correspondences. These corre-
Slide IDs and Picture IDs are PowerPoint specific features.        spondences are the key to identifying the changes between
They are unique identifiers for each slide and each image          presentations. As we will show in Section 4 our interactive
on a slide. Once created, they remain fixed for the lifetime       visualization tool is designed to visually depict these corre-
of a document. Thus, we can directly compare these IDs to          spondences so that users can quickly see similarities and
identify matching slides and images between two versions           differences between multiple presentations.
of a presentation. The Slide ID distance operator returns 0
if the slide IDs match and a very large value when they do         Correspondence operators take two presentations and a dis-
not match. The Picture ID distance operator determines the         tance operator as input and yield a mapping between each
maximum number of images in common between two slides              slide in the first presentation and its best matching slide in
and returns the reciprocal of that number plus 1. Thus slides      the second presentation. In our implementation, each slide
with many matches have lower distances than those slides           can appear in at most one match, and if no good match is
with fewer or no matches. If there are zero Picture ID             found the operator can leave a slide unmatched.
matches the operator returns a very large value.                   3.3.1    Minimum Distance Correspondence
While a Slide ID distance of 0 shows that two slides once          A simple technique for computing correspondence is to
started out as identical, there is no guarantee that the slides    match each slide in the first presentation with the minimum
remain similar. The slides could have been heavily edited          distance slide in the second presentation. While this ap-
within each presentation independently. Similarly even if          proach could be used in conjunction with any of our dis-
Slide IDs differ, the slides may be visually identical. The        tance operators, it has several drawbacks. If multiple slides
simple act of copy/pasting (as opposed to cut/paste) will          are at the same minimum distance, it is unclear how to pick
produce identical slides with different Slide IDs. Neverthe-       the best match from amongst them. There is also no provi-
less, the Slide ID distance does provide a measure of slide        sion for leaving a slide unmatched; even if none of the
similarity that is insensitive to subsequent slide edits.          slides in the second presentation is a “good” match, this
                                                                   technique will still generate a correspondence.
3.2.4    Composite Distances
                                                                   3.3.2    String Edit Distance Based Correspondences
Our system also supports composite distance operators that
combine several basic distance operators into a single func-       We can think of each presentation as a sequence of symbols
tion. For instance we have found it useful to combine the          and then compute correspondences using the string edit dis-
image and text distances into a single composite distance.         tance algorithm described in Section 3.2.2 and Appendix A.
For each pair of slides we normalize the image and text dis-       We assume that two slides match when the distance be-
tances so that they are roughly in the same range and can be       tween them is less than a user-specified minimum threshold.
compared meaningfully. We then use the minimum of the              Backtracking through the resultant cost matrix, we can re-
two normalized distances as our composite distance. This           cover a correspondence for each slide. Note that the string
composite distance returns a single number that can be used        edit distance algorithm cannot determine if blocks of slides
                                                                   have moved from one position to another between presenta-
tions. It only reports slide insertions, deletions, and substi-   Our approach is based on a voting scheme. We first com-
tutions. Thus, we cannot use string alignment to find corre-      pute correspondences using any set of distance and corre-
spondences between slides that cross over other groups of         spondence operators as described in sections 3.3.1-3.3.3.
corresponding slides, which is common in presentations.           For a given slide in the first presentation each distance op-
3.3.3        Greedy-Thresholded Correspondence                    erator can generate a different minimum distance matching
Heckel [8] presents a greedy algorithm for computing cor-         slide in the second presentation. We treat each minimum
respondences between sequences of symbols. This ap-               distance match as a vote for a particular correspondence
proach finds uniquely corresponding symbols, removes              and report the slide in the second presentation that receives
them from the potential set for consideration, and then ex-       the most votes as the corresponding slide. A tie in the vot-
pands the search from those symbols to adjacent symbols in        ing means that there is disagreement between the distance
order to find the best correspondences. The algorithm iter-       operators on individual features. In such cases the slide in
ates until no more matches are found.                             the first presentation is left unmatched. We have found that
                                                                  combining the image, text and Slide ID greedy-threshold
Heckel’s algorithm requires unique matches between sym-
                                                                  correspondences using such a voting scheme is useful. The
bols. Since we compute feature distances rather than unique
                                                                  Slide ID correspondence essentially arbitrates between the
matches we cannot directly apply Heckel’s technique and
                                                                  image and text correspondences.
instead adapt it as follows:
                                                                  When changes affect many slides (such as a template
     1. Given a distance operator sort the distances be-
                                                                  change), image distances will be large between correspond-
          tween all pairs of slides from least to greatest.
                                                                  ing slides while other distances such as text, Slide ID and
     2. Create a correspondences between the minimum              Picture ID distances may be small or identical. Our com-
          distance pair subject to a distance threshold ε .       posite correspondence operators can detect template
        3.Remove both slides from further consideration.          changes because they consider the variance between image
        4.Continue from step 2 until no more correspon-           distances and text, Slide ID, and Picture ID differences.
          dences can be found.                                    4     VISUALIZING MULTIPLE PRESENTATIONS
We introduce a minimum distance threshold ε in step 2 so          To help users understand similarities and differences in the
that slides that are significantly different cannot be matched    presentations, we allow users to interactively generate visu-
to one another. We have found that good values for ε de-          alizations that reveal correspondences between presenta-
pend on the type of distance operator being used. We use          tions. Examples of the types of visualizations we generate
the following thresholds: image-based distance – 100 units        are shown in Figure 3. Each column represents a presenta-
of mean square error, string edit distance - 30 operations,       tion and each rectangle within a column represents a slide.
slide and picture ID distances - only allow correspondence        In the initial layout (Figure 3-a), the relative lengths of both
when all IDs match.                                               presentations is immediately apparent.
White this greedy algorithm has worked well on the exam-          4.1    Conveying Correspondence
ples we have tested, it can run into some problems. Like          Correspondence is conveyed through two visual representa-
any greedy algorithm our approach may not always produce          tions. First, users can turn on lines that connect correspond-
an optimal solution. In particular a slide in presentation 1      ing slides based on any of the distance and correspondence
may not be matched to a minimum distance slide in presen-         operators (Figure 3-b). The color of the line indicates the
tation 2. In addition, our approach does not consider se-         type of distance operator used (e.g., text distances, image
quential proximity in computing correspondence. A slide at        distances). When users hover the cursor over a line, the
the beginning of presentation 1 may best match a slide near       numerical distance between the slides is shown.
the end of presentation 2, but have a reasonably close match      Our second approach to visualizing correspondence is to
at the beginning of presentation 2. Our current algorithm         align corresponding slides. We compute the minimum
would report the slide at the end of presentation 2. Heckel       number of gaps required to maximize the number of corre-
includes a notion of sequential proximity in his distance         sponding pairs of slides that align between two presenta-
computation and we believe it is possible to extend our ap-       tions subject to the constraint that each presentation cannot
proach in a similar manner.                                       modify the sequential ordering of the slides. (Figure 3-c).
3.3.4        Composite Correspondences                            Note that as a result of this constraint, corresponding slides
Our correspondence operators can be computed with re-             cannot always be aligned. For an example, the 6th slide in
spect to any distance operator, including the composite dis-      the first presentation of Figure 3-c cannot be aligned with
tance operators. However, as we noted earlier it is not al-       its corresponding slide, but a line can still be used to show
ways clear how to normalize the individual distance opera-        that this slide corresponds to the 8th slide in the second
tors to produce a meaningful composite distance.                  presentation.
Therefore we have developed an alternative approach for           We again use a string edit distance algorithm based on dy-
combining multiple distance operators, but at the level of        namic programming to compute slide alignment However,
the correspondence operator.                                      in this case, we use a modified version of Hirschberg’s [9]
v1 v2 v1 v2 v1 v2 v1 v2 v3 v1 v2 v3
(a) (b) (c) (d) (e)
Figure 3: (a) Two presentations arranged in columns. (b) Lines connect corresponding slides. The color of the line indi-
cates the type of distance operator used. For example, blue indicates image distance. (c) Presentations aligned using
the Hirschberg [9] string matching algorithm. Alignment is based on correspondences computed using one type of dis-
tance operator, the lines depict correspondences using the same distance operator. (d) Multiple sequences compared
serially – v1 compared with v2 and v2 compared with v3. (e) An alternate layout comparing one to many presentations,
lines are drawn between slides in the first presentation and corresponding slides in the subsequent versions.
algorithm because it is more space-efficient than the more tance of 0). Visually identical corresponding slides can be
standard Levenshtein string matching algorithm. As more dimmed to a light blue color. In addition, corresponding
presentations are added to the comparison, gaps are ad- slides that are not visually identical can be linked using
justed throughout all the presentations to keep correspond- lines with red-colored end-caps. Both of these approaches
ing slides aligned when possible (see Figure 4). help draw the user’s attention to slides which have changed
We’ve also found it useful to highlight corresponding pairs from version to version. The dimming is shown in Figures 1
of slides that are visually identical (i.e. with an image dis- and 6, while the end-caps are shown in Figures 1, 5, and 7.
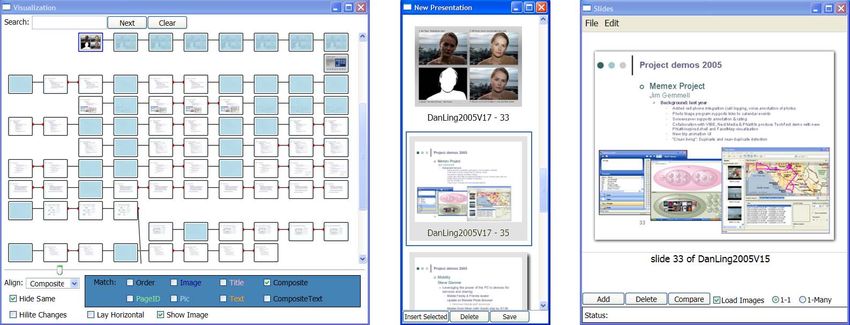
v1, v2 v1, v2, v3 v1, v2, v3, v4 4.2 Presentation to Presentation Visualizations
no alignment aligned aligned aligned Our system provides two modes for visually comparing
multiple versions of a presentation. The sequential one-to-
one comparison mode assumes that the versions were cre-
ated in a particular order and compares version 1 with ver-
sion 2, version 2 with version 3 and so on. This mode is
useful for tracking changes in the presentation as it directly
depicts the evolution of the presentation from version to
version. The one-to-many comparison mode compares a
single base presentation to several alternative versions of it.
This mode is most appropriate for seeing how a master
presentation was assembled from earlier versions, or for
collaboratively combining presentations that were simulta-
neously edited by multiple collaborators. Figures 1, 3 (b-d),
Figure 4: Alignment of multiple presentations: Gaps 4 (a-d) and 5 all show sequential one-to-one comparison,
are inserted in both presentations 1 and 2 to while Figures 4-e, 6 and 7 show one-to-many comparisons.
achieve maximal alignment. As subsequent presen-
tations are aligned, gaps must be inserted in all
previous presentations to keep them all aligned.
4.3    Interacting with the Visualization                          moderate sized presentations (30 slides) on a 2 GHz com-
The user can interact with the visualization by using a slider     puter with 1 Gb of RAM. The features and the comparisons
to zoom out to see an overview of the changes, or to zoom          are saved in XML files so that once run, the comparison
into a particular slide or region of slides. Clicking on a slide   will only re-run if the source presentations are altered.
will select it and bring up a full resolution slide in a slide     7    RESULTS
preview window. The user can use the arrow keys on the
                                                                   Our results are depicted in Figures 5 – 7.
keyboard to move the selection forward or backward within
a presentation, or move between corresponding slides               Figure 5 shows a visualization of 10 different versions of a
across presentations. By quickly moving back and forth be-         presentation prepared by multiple authors for an executive
tween corresponding slides, the user can easily see visual         review. The visualization depicts 387 slides. Each version
differences in the slides in the slide preview window.             of the presentation is sequentially compared to the next
                                                                   which allows for an analysis of the presentation over time.
Checkboxes allow different correspondence links to be
                                                                   In versions 3 and 8, several slides have been added as indi-
turned on and off, and a pull down menu allows the presen-
                                                                   cated by the large insertion gaps. Conversely from versions
tations to be aligned along any of the correspondences. The
                                                                   5 to 6, a four slide section was removed to shorten the pres-
user can also select a slide and find similar slides along any
                                                                   entation. From versions 7 to 8 a slide that occurred later in
distance operator. Images of slides can be turned on or off
                                                                   the presentation is moved earlier. Similarly, the visualiza-
to just focus on the overall structure of changes. Slides that
                                                                   tion allows viewers to rapidly see the changes throughout
do not change along a particular distance operator can be
                                                                   the evolution of the presentation.
dimmed to a light blue to help highlight only the changes.
                                                                   Figure 6 shows a one-to-many comparison where several
5     ASSEMBLING PRESENTATIONS                                     authors edited a single base presentation and the system was
Besides allowing analysis of the relationships between mul-        then used to identify and coalesce changes. The visualiza-
tiple presentations, the visualization tools also facilitate the   tion shows where authors spot the same typo and how dif-
assembly of new presentations. Users can select a set of           ferent authors might suggest alternate changes to the flow
slides from any presentation in the Visual Comparison              of the presentation.
Window and paste them into the new presentation in the
                                                                   Figure 7 shows our system being used to assemble a presen-
Presentation Assembly Window.
                                                                   tation. Here the user prepares for a mid year review by pull-
Our system provides a number of techniques for selecting           ing slides from two talks given earlier in the year. Our visu-
slides in the Visual Comparison Window; all the slides             alization lets the user compare the two presentations (Figure
within a presentation can be selected by clicking on the           7-a) and choose the desired slides. For example the second
presentation title and all slides that contain a given string      slide in the assembly is from version 2, the fifth slide from
can be selected by searching for the term.                         version 1. The gaps indicate slides that only exist in one
In the newly assembled presentations, slides maintain their        version. Once assembly is complete, the user can save out a
correspondences to slides in the older presentations and us-       new version of the presentation and make modifications
ers can easily choose between alternate slides using the ar-       such as updating the title slide. Figure 7-b uses our one-to-
row keys. Slides that have visually distinguishable corre-         many correspondence to compare the newly assembled
spondences are outlined in gray to indicate that alternates        presentation to the sources. This view directly shows which
are available.                                                     source presentation each slide came from.
6     IMPLEMENTATION                                               8    CONCLUSIONS
The system was implemented using the Microsoft Office              We have presented a framework and set of visualization
Primary Interop Assemblies to access the object model for          tools for analyzing and simultaneously presenting multiple
PowerPoint and automate the extraction of all the features         presentations. These tools can be used to assist in the crea-
contained on the slides. The visualization was developed           tion of new presentations and support a variety of work
using the Windows Presentation Framework, and a variant            strategies from tracking changes for individuals, merging
of Python called IronPython that uses the Common Lan-              multiple versions, or assembling new presentations. Our
guage Runtime (CLR) which facilitated rapid development            visualizations can also give sociologists the tools to detect
and allowed for convenient loading of modules for visual           patterns in multiple versions of a slide presentation or even
comparison, textual comparison, and PowerPoint interac-            among all the presentations owned by a user or organiza-
tion. The code is not currently optimized and takes ap-            tion.
proximately 1 minute to extract features and compare two
Figure 5: Ten versions of a presentation prepared for a re- Figure 6: Merging changes using a one-to-many com- view. The presentation consists of 387 slides. Gaps denote parison of a base presentation v1 that has been edited where sections where added or removed (e.g. between v5 and by 3 different authors (v2, v3, v4).Slides that are visually v6 a large section was removed to shorten the talk). identical are dimmed to light blue.
Assembled v 3
    v1                  v2                                             v3                v1               v2

                             (a)                                                      (b)
Figure 7: (a) Using our system for presentation assembly. v1 and v2 are two related presentations. The sequential
comparison makes it easy to choose slides from the two versions: Alternate versions of a slide are aligned, and slides
that have changed under the image metric are denoted with red end-caps. The user can pick the desired slides (out-
lined in gray) and add them to the presentation assembly. In (b) the assembled presentation is compared to its
source versions. Our one-to-many comparison shows the source presentation each slide in our new assembled pres-
entation came from.
9 REFERENCES 21. Salton, G. and McGill, M. J. 1986. Introduction to Modern
1. Apple. Keynote. 2005. Information Retrieval. McGraw-Hill, Inc.
www.apple.com/keynote; Keynote Document Reference:
22. Viégas, F. B., Wattenberg, M., and Dave, K. 2004. Studying
developer.apple.com/technotes/tn2002/tn2073.html
cooperation and conflict between authors with history flow
2. Baker, M.J., and Eick, S. 1995. Space-filling software visu- visualizations. In Proceedings of CHI 2004. pp. 575-582.
alization. Journal of Visual Language and Computing. 6.
23. Zellweger, P.T. 1989. Scripted documents: A hypermedia
pp.119-133
path mechanism. In Proceedings of ACM Hypertext 1989.
3. Brand, John. 2004. Presentation (Mis)management: Content
24. Zongker, D. E. and Salesin, D. H. 2003. On creating ani-
and Collaboration Strategies, Delta 3057. Sept 14, 2004.
mated presentations. In Proceedings of the 2003 SIGGRAPH
4. Charras, C. Lecroq, T. Sequence comparison. www- /Eurographics Symp. on Computer Animation. pp.298-308
igm.univ-mlv.fr/~lecroq/seqcomp/index.html
Appendix A: Computing String Edit Distance
5. Eick, S., Steffen, J.L., and Sumner, E.E. 1992. Seesoft – A We use dynamic programming in three different parts of
tool for visualizing line oriented software statistics. IEEE our system (to determine text distances, to find slide cor-
Transactions on Sotware Engineering. 18, 11. pp. 957–968.
respondences, and to align presentations). Given two
6. Eick, S. 1994. Graphically displaying text. Journal of Com- strings of lengths m and n respectively, we construct a cost
putational and Graphical Statistics. 3, 2. pp. 127–142. matrix D of size. (m + 1) × (n + 1) . Entry (i, j) of this ma-
7. Good, L., and Bederson, B. 2002. Zoomable user interfaces trix represents the cost required to convert the first i
as a medium for slide show presentations. Information Visu- characters of string 1 into the first j characters of string 2.
alization. 1, 1. pp. 35–49. We initialize D by filling in the top and left edges of D
8. Heckel, P. 1978. A technique for isolating differences be- with the numbers 0 to m and 0 to n respectively. The re-
tween files. Comm. of the ACM 21, 4. pp. 264–268. maining entries of D are computed as follows:
if (string1[i] = string2[j]) then COST = 0; else COST = 1;
9. Hirschberg, D.S. 1975. A linear space algorithm for comput-
ing maximal common subsequences. Communications of the ⎛ D[i − 1, j ] + 1, // deletion ⎞
ACM. 18, 6. pp.341–343. ⎜ ⎟
D[i, j ] = min ⎜ D[i, j − 1] + 1, // insertion ⎟
⎜ D[i − 1, j − 1] + COST , // substituion ⎟
10. Hunt, J.W., and McIlroy, M.D. 1976. An algorithm for dif- ⎝ ⎠
ferential file comparison. Bell Laboratories CSTR #41.
For example, to compare the strings SURVEY and
11. Levenshtein, V.I.. 1966. Binary codes capable of correcting SURGERY, we generate the following matrix:
deletions, insertions and reversals. Soviet Physics Doklady.
12. Microsoft. PowerPoint. www.microsoft.com/powerpoint S U R G E R Y
13. Microsoft PowerPoint Object Model Reference, 0 1 2 3 4 5 6 7
http://msdn.microsoft.com/office/understanding/powerpoint S 1 0 1 2 3 4 5 6
14. Moscovich, T., Scholz, K., Hughes, J.F., and Salesin, D. U 2 1 0 1 2 3 4 5
2004. Customizable presentations. Technical Report CS-04- R 3 2 1 0 1 2 3 4
16, Computer Science Department, Brown University.
V 4 3 2 1 1 2 3 4
15. Needleman, S. and Wunsch, C. 1970. A general method ap- E 5 4 3 2 2 1 2 3
plicable to the search for similarities in the amino acid se-
quence of two proteins, J Mol Biol. 48(3):443-53 Y 6 5 4 3 3 2 3 2
16. Nelson, L., Ichimura, S., Pedersen, E.R., and Adams, L.
1999. Palette: A paper interface for giving presentations. In The bold items represent the minimum cost paths from the
Proceedings of CHI 1999. pp. 354–361. start to the end of each string. The algorithm yields a
17. OpenOffice Impress. www.openoffice.org string edit distance of 2 between the strings. Backtracking
through the matrix results in the following optimal align-
18. Parker, A., and Hamblen, J.O. 1989. Computer algorithms ment:
for plagiarism detection. IEEE Transactions on Education.
S U R G E R Y
32, 2: pp. 94-99.
S U R V E - Y
19. Parker, I. 2001. Absolute PowerPoint: Can a software pack-
age edit our thoughts? The NewYorker. pp. 76–87.
More detailed descriptions of string edit distance can be
20. Perlin, K., and Fox, D. 1993. Pad: An alternative approach
found in [4,11].
to the computer interface. In Proceedings of SIGGRAPH
2003. pp. 57-64.You can also read