Comparison of drought tolerance of banana genotypes - DOI.org
←
→
Page content transcription
If your browser does not render page correctly, please read the page content below
Comparison of drought tolerance of banana
genotypes
R. Wang1, Y. Xu1 , X.G. Li1, Y. Shen1, L.X. Wang1 and Z.S. Xie2
1
Institute of Horticulture, Hainan University, Hainan, P.R., China
2
Tropical Crops Genetic Resources Institute, Chinese Academy of Tropical
Agricultural, China
Corresponding author: X.G. Li
E-mail: lixinguo13@163.com
*These authors contributed equally to this study
Genet. Mol. Res. 19 (2): gmr18544
Received January 16, 2019
Accepted March 31, 2020
Published June 30, 2020
DOI http://dx.doi.org/10.4238/gmr18544
ABSTRACT. Banana is an importment international economical
crop, but drought is the most significant environmental stress in
banana intrustry. Previous studies on banana drought tolerance
evaluated just a few indicators, such as malondialdehyde (MDA) and
plasma membrane permeability (PMP), with little or no systematic
morphological and physiological information. We examined the
morphological and anatomical structure characters of nine genotypes
among 28 banana varieties from the variety resource nursery of China
academy of topical agricultural sciences, and combined physiological
markers (PMP and MDA) with morphological data. Leaf thickness,
upper leaf epidermis and cutin thickness, palisade tissue thickness,
spongy tissue thickness, lower leaf epidermis and cutin thickness, cell
tense ratio (CTR), PMP and MDA content were significantly
different among these varieties. Banana varieties were divided into
three groups by cluster analysis based on a CTR index or a MDA
content index, and the varieties were divided into two groups by
cluster analysis based on the PMP index. Based on discriminant
functions, the original classification was confirmed, and the result of
discriminant classification was 100% correct. Three discrimination
models with superior distinguishing abilities were established.
Key words: Banana; Genotypes; Cluster Analysis; Drought Resistance
Genetics and Molecular Research 19 (2): gmr18544 ©FUNPEC-RP www.funpecrp.com.brR. Wang et al. 2
INTRODUCTION
Banana (Musa spp.) is grown in more than 120 countries throughout the world.
They are cheap to produce, grow in a wide range of environments, and produce fruit year-
round. China is one of centers of banana origin (Wu et at., 2013). Bananas are also food for
more than 400 million people throughout the developing countries from tropical and
subtropical areas, and are considered as the poor man's fruit crop in tropical and subtropical
countries, with the annual production reaching 144 million tons (Christelová et al., 2017;
Dale, 2017). The banana plant is sensitive to soil water deficit (Turner et al., 2007). Drought
is a major abiotic stress affecting banana production worldwide, leading to yield losses of
up to 65%. (Nansamba et al., 2020). To survive under water deficit conditions, plants
respond by change in expression of many genes (Laraib et al., 2019). Because of the large
leaf area, fibrous root system and rapid growth rate, bananas need a large amount of water
for proper growth and development (Stover & Simmonds, 1987). Drought stress is one of
the most serious yield-reducing stresses in banana industry, especially important in
countries where crop agriculture is essentially rain-fed (Ghavami, 1976; Ekanayake, 1995;
Bananuka et al., 1999; Carr, 2009; van Asten et al., 2011; Muthusamy et al., 2014).
Cultivated bananas originated either from intraspecific hybridizations between wild diploid
subspecies of Musa acuminata. (‘A’ genome), or from interspecific crosses between M.
acuminata and the wild diploid M. balbisiana. (‘B’ genome) (Simmonds, 1995). Stover and
Simmonds (1987) stated that bananas with the B genome were the most drought tolerant.
Genotypes with “B” genome are more tolerant to abiotic stresses than those solely based on
“A” genome (Ravi et al., 2013). Drought is an abiotic stress that strongly influences plant
growth, development and productivity (Ye et al., 2013). Consequently, the relationship
between different banana genotypes and their drought tolerance has become a hot research
topic. Huang et al. (1999) and Bananuka et al. (1999) proposed that the more B genome the
varieties are, the stronger drought tolerance they will be. While the more A genome those
varieties are, the worse drought tolerance they may have. Cultivars with predominately A
genomes and triploid cultivars may gave greater reductions in yield and yield components
during moisture stress than cultivars with predominately B genomes and diploids and
tetraploids (Ramadass et al., 1993). However, the correlation was not so tight because they
selected only a few varieties as experimental materials, such as Huang et al. (1999) who
examined three varieties [Williams (AAA), Zhongshanlongyajiao (AAB), Fenshajiao
(ABB)] and Bananuka, et al. (1999) who texted six varieties [Nfuuka(AAA-EA),
Sukalindizi(AB), French Plantain(AAB), Gros Michel(AAA), Lep Chang Kut(BBB),
FHIA-2(AAAA)]. One variety could not represent all varieties in a corresponding genotype.
Drought tolerance is a complex trait, the expression of which depends on action and
interaction of different morphologies, physiologies and biochemistries. Morphological and
physiological characters show different types of inheritance patterns (monogenic and
polygenic) and gene actions (additive and non-additive), and very little is known about the
genetic mechanisms that condition these characters (Mitra, 2001). In our study, we selected
28 banana varieties, including nine different genotypes, as experimental materials. Their
drought tolerance and how they related to morphological and anatomical structure
characters of leaves were observed by paraffin sectioning and the PMP, MDA content of
leaves were measured. Cluster analysis is one of the analytic methods widely applied in
quantitative taxonomy research, especially in the identification of plant germplasm
Genetics and Molecular Research 19 (2): gmr18544 ©FUNPEC-RP www.funpecrp.com.brDrought tolerance of banana genotypes 3
resources and plant phylogenetic relationship (Zhang et al., 2013; Ai et al., 2014; You et al.,
2014). Cluster and discrimination analysis techniques were used to study drought tolerance
related characters of 28 different varieties of banana. The aim of this study was to examine
the relationship between different genotypes and drought tolerance of banana and whether
related genes distributed in the B chromosomes control drought tolerance or not. The
ultimate purpose of this study was to provide a theoretical basis and practical methodology
for drought tolerance breeding and cultivation.
MATERIAL AND METHODS
Materials (Table 1) were collected from the banana germplasm nursery of tropical
crops genetic resources institute, Chinese academy of Tropical Agricultural Sciences. The
third leaves from the top were cut as samples after the male flower cluster was cut off.
Table 1. Description of banana varieties in the study
Code Variety Genotype Code Variety Genotype
1 ‘Babeiduo’ AAA 15 ‘Dongguan Gaobadajiao’ ABB
2 ‘Brazil’ AAA 16 ‘Dongguan Zhongbadajiao’ ABB
3 ‘Cros-Michel’ AAA 17 ‘Mengjiala Dajiao’ ABB
4 ‘Hongxiangjiao’ AAA 18 ‘Mengjiala Fendajiao’ ABB
5 ‘Baoting Aixiangjiao’ AAA 19 ‘Cachaco’ ABB
6 ‘Honghe Aijiao’ AAA 20 ‘Pisang Ceylan’ AAB
7 ‘Bawangling Yeshengjiao’ AA 21 ‘FHIA-17’ AAAA
8 ‘AACV Rose’ AA 22 ‘FHIA-25’ AAAA
9 ‘Pisang Jari Buaya’ AA 23 ‘FHIA-01’ AAAB
10 ‘Lingshui Yeshengjiao’ AA 24 ‘FHIA-18’ AAAB
11 ‘Baihualing Yeshengjiao’ BB 25 ‘FHIA-21’ AAAB
12 ‘Qujiang BB’ BB 26 ‘CRBP 39’ AAAB
13 ‘Yunnan BB’ BB 27 ‘FHIA-03’ AABB
14 ‘Shixing BB’ BB 28 ‘TMBx 5295-1’ ABBB
Measurements of anatomical structures
Measurement of characteristics of leaf anatomical structure was made with a
paraffin sectioning method (Li, 2009). Thickness of leaf, thickness of upper leaf epidermis
and cutin, thickness of palisade tissue, thickness of spongy tissue, thickness of lower leaf
epidermis and cutin, cell tense ratio (CTR), spongy ratio (SR) were measured.
Computational method for CTR and SR used Jian’s method (1986).
Measurement of physiological characters
The PMP (plasma membrane permeability) reflects membrane injury. It was
measured using the method of Bajji et al. (2001). Concisely, we cut the leaves (0.50 g) and
incubated in 25 ml of distilled water at 25°C for 8 h. We measured the leakage of electrolyte
to culture fluid with a conductivity meter (Del Ta326, Mettler Toledo, Switzerland).
Determination of membrane lipid peroxidation from malondialdehyde content
(MDA), was made based on Hong et al. (2000). Approximately 0.5 g of the leaves were
homogenized in 5 ml of 10% (m/v) trichloroacetic acid, and the homogenate was
Genetics and Molecular Research 19 (2): gmr18544 ©FUNPEC-RP www.funpecrp.com.brR. Wang et al. 4
centrifuged at 13 000 rpm for 15 minutes. The supernatant was mixed with an equal
volume of thiobarbituric acid (0.5% in 20% trichloroacetic acid solution). The mixture
was boiled at 100°C for 30 minutes, and then centrifuged. The absorbance of the
supernatant was measured at 532 nm, and the non-specific turbidity was corrected by
subtracting A600. The MDA content was calculated using the absorption coefficient of
155 mmol-1 cm-1. Four replicates were used for each treatment.
Data analysis
The data were statistically analyzed by analysis of variance (ANOVA).
Averages of the main effects were compared by the Duncan test. The correlation
between the characters was analyzed using by CORR process. Cluster analysis of each
character used CLUSTER process and discrimination analysis of each character used
DISCRIM process. All statistical analyses were performed by using SAS 9.0 software.
RESULTS
The differences between drought tolerance related characters of different
banana varieties
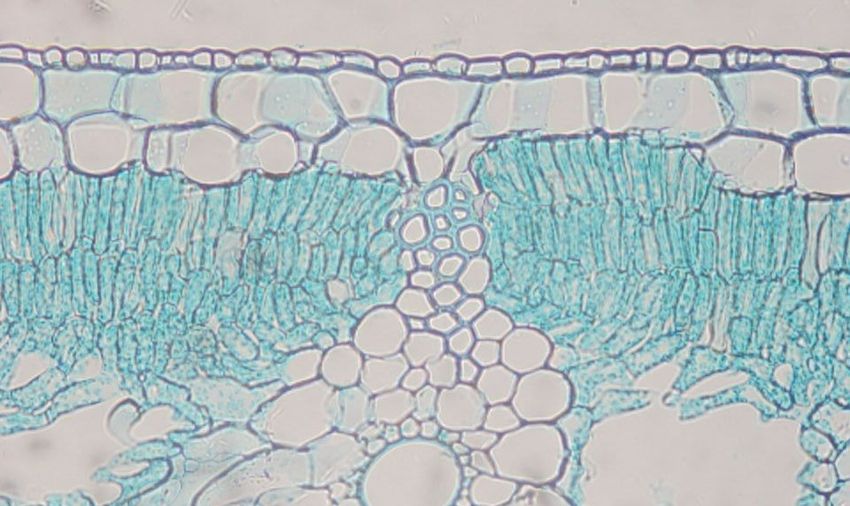
Figure 1 showed the partial anatomical structures of leaves of different banana
varieties. Figure 2 is the comparison of anatomical structure features of leaves among
different banana genotypes. The results of variance (Table 2) showed that among the
tested varieties, differences of thickness of leaf, thickness of upper leaf epidermis and
cutin, thickness of palisade tissue, thickness of spongy tissue, thickness of lower leaf
epidermis and cutin, CTR, SR, PMP, MDA content were highly significant. The mean
thickness of leaf was 360.520 μm; the thickest variety was CRBP 39, and its thickness
was 534.064 μm; the least thick variety was Pisang Jari Buaya, and its thickness was
253.009 μm. The mean of thickness of upper leaf epidermis and cutin was 52.657 μm,
and the range was 30.179 μm to 77.366 μm. The variety with the greatest thickness of
palisade tissue was FHIA-17, and its thickness was 124.539 μm; the least thick variety
was Pisang Jari Buaya, and its thickness was 69.930 μm. The variety with the greatest
thickness of spongy tissue was CRBP 39, and its thickness was 289.854 μm; the least
thick variety was Cachaco, and its thickness was 92.859 μm. The mean thickness of
lower leaf epidermis and cutin was 45.430 μm, and the range was 25.912 - 0.696 μm.
The variety with the largest CTR was Cachaco, and its thickness was 62.76%; the least
thick variety was Pisang Ceylan, and its thickness was 39.34%. The variety with the
largest SR was Pisang Ceylan, and its thickness was 60.63%; the least thick variety was
Cachaco, and its thickness was 37.19%. The mean of PMP was 27.472%, and the range
was 17.568 - 37.384%. The mean of MDA content was 225.568 nmol/g, the range was
78.065 - 365.591 nmol/g, and the difference of maximum and minimum was 4.683
times.
Genetics and Molecular Research 19 (2): gmr18544 ©FUNPEC-RP www.funpecrp.com.brDrought tolerance of banana genotypes 5
A
B
C
E
D
F
G
H
Figure 1. The parts anatomical structures figure of leaves of different banana varieties. A: Cutin B: Upper leaf
epidermis C: Palisade tissue D: Spongy tissue E: Aerenchyma F: Fibrovascular tissue G: Lower tight tissue H:
Lower leaf epidermal.
A
C
B
D
F
E
I
G
H
Figure 2. The comparison of anatomical leaf structures figures among different banana genotypes (Scale bar =
100µm) A:Brazil banana (AAA); B:Pisang Jari Buaya (AA); C:Qujiang BB(BB) D:Pisang Ceylan (AAB)
; E:Cachaco (ABB); F:FHIA-25 (AAAA) G:FHIA-18 (AAAB); H:FHIA-03(AABB); I:TMBx 5295-1
(ABBB).
Genetics and Molecular Research 19 (2): gmr18544 ©FUNPEC-RP www.funpecrp.com.brR. Wang et al. 6
Table 2. Variance of drought tolerance related characters among banana varieties.
Source of Sum of Mean
Item DF F value Means Range CV
variance squares square
Among
027 2009608.26 74429.94 146.27** 360.52±22.58 253.01~534.06 06.26
varieties
Thickness of leaf
Error 247 0125684.88 00508.85
Total 274 2135293.14
Among
Thickness of upper 027 0032268.67 01195.14 034.82** 052.66±5.86 030.18~77.37 11.13
varieties
leaf epidermis and
Error 247 0008478.17 00034.33
cutin
Total 274 0040746.84
Among
027 0057598.97 02133.30 036.49** 090.59±7.65 069.93~124.54 08.44
Thickness of varieties
palisade tissue Error 247 0014441.74 00058.47
Total 274 0072040.71
Among
027 0982991.22 36407.08 093.06** 171.67±19.79 092.86~289.85 11.52
Thickness of varieties
spongy tissue Error 247 0096626.92 00391.20
Total 274 1079618.14
Among
Thickness of lower 027 0041515.31 01537.60 021.65** 045.43±8.43 025.91~70.67 18.55
varieties
leaf epidermis and
Error 247 0017543.17 00071.03
cutin
Total 274 0059058.48
Among
027 0011606.44 00429.87 033.75** 053.50±3.57 039.34~62.76 06.67
varieties
CTR
Error 247 0003146.08 00012.74
Total 274 0014752.52
Among
027 0011663.73 00431.99 033.92** 046.45±3.57 037.19~60.63 07.68
varieties
SR
Error 247 0003145.75 00012.74
Total 274 0014809.48
Among
027 0002344.19 00086.82 011.34** 027.47±2.77 017.57~37.38 10.07
varieties
PMP
Error 056 0000428.93 00007.66
Total 083 0002773.12
Among
027 0435645.26 16135.01 040.23** 225.57±20.026 078.07~365.59 08.88
varieties
MDA content
Error 056 0022458.38 00401.04
Total 083 0458103.64
** means significant at 1% level. Abbreviations: MDA, malondialdehyde; CTR, cell tense ratio; PMP, plasma membrane, permeability;
SR, spongy ratio.
Linear regression of CTR、plasma membrane permeability and MDA
The scatter distribution between CTR and PMP is shown in Figure 3a. By the linear
regression analysis, their equation was y = -0.4854x+53.505 (x means CTR, and y means
PMP), and their correlation coefficient was -0.5986, which gave a highly significant
negative correlation by the F test. The linear regression equation of CTR and MDA was y =
-6.3407x+565.6 (x means CTR, and y means MDA), and their correlation coefficient was
-0.5735, which gave a highly significant negative correlation (Figure 3b). The linear
regression equation of PMP and MDA was y = 11.918x-101.86 (x means PMP and y means
MDA), and their correlation coefficient was 0.8743, which gave an highly significant
positive correlation (Figure 3c).
Genetics and Molecular Research 19 (2): gmr18544 ©FUNPEC-RP www.funpecrp.com.brDrought tolerance of banana genotypes 7
a y = -0.4854x + 53.505
40 r = -0.5986**
35
30
PMP
(%)
25
20
15
35 45 55 65
CTR(%)
b 400 y = -6.3407x + 565.6
r = -0.5735**
350
300
250
MDA content
(nmol/g)
200
150
100
50
35 45 55 65
CTR(%)
400
c 350
300
MDA content
(nmol/g)
250
200 y = 11.918x - 101.86
r = 0.8743**
150
100
50
15 20 25 30 35 40
Plasmamembrane permeability(%)
Figure 3. Line regression relationships between CTR, PMP and MDA. Abbreviations: MDA, malondialdehyde;
CTR, cell tense ratio; PMP, plasma membrane permeability.
Genetics and Molecular Research 19 (2): gmr18544 ©FUNPEC-RP www.funpecrp.com.brR. Wang et al. 8
Cluster Analysis of CTR
The results showed that (Table 3) 28 different banana varieties could be divided to 3
groups by the dendrogram (Figure 4). Cluster 1 consisted of 16 species (two AAA genome
types, three AA genome types, four BB genome types, three ABB genome types, one
AAAA genome type, two AAAB genome types, one AABB genome type), their CTR were
large, and their drought tolerance were strong; Cluster 2 consisted of 10 species (four AAA
genome types, one AA genome type, two ABB genome types, one AAAA genome type,
one AAAB genome type, one ABBB genome type), their CTR were moderate, and their
drought tolerance were moderate; Cluster 3 consisted of 2 species (one AAB genome type,
one AAAB genome type), their CTR were low, and their drought tolerance were inferior.
Table 3. Classification for CTR of different banana varieties.
Number of Mean of
Cluster Code of variety Frequency (%) Range
varieties cluster
2,3,7,8,9,11,12,13,14,17,18,
1 16 57.15 58.90±0.34 A 54.59~62.64
19,22,24,25,27
2 1,4,5,6,10,15,16, 21, 26,28 10 35.71 48.17±0.37 B 45.35~51.06
3 20,23 02 07.14 40.98±0.68 C 39.39~42.57
Figure 4. Dendrogram of banana varieties based on the CTR data. (Variety code 1 - 28,see Table 1).
Cluster Analysis of plasma membrane permeability
The results showed that (Table 4) 28 different genotypes varieties of banana could
be divided into 2 groups by the average class (Figure 5). Cluster 1 consisted of 17 species
(one AAA genome type, three AA genome types, four BB genome types, three ABB
genome types, one AAAA genome type, four AAAB genome types, one AABB genome
type), their PMP were low, and their drought tolerance were strong; Cluster 2 consisted of
Genetics and Molecular Research 19 (2): gmr18544 ©FUNPEC-RP www.funpecrp.com.brDrought tolerance of banana genotypes 9
11 species (five AAA genome types, one AA genome type, two ABB genome types, one
AAB genome type, one AAAA genome type, one ABBB genome type), their PMP were
large, and their drought tolerance were inferior.
Table 4. Classification based on PMP of different banana varieties.
Mean of
Cluster Code of variety Number of varieties Frequency(%) Range
cluster
2,7,8,9,11,12,13,14,17,18,
1 17 60.71 23.68±0.41 B 17.60~26.59
19,22,23,24,25,26,27
2 1,3,4,5,6,10,15,16,20,21,28 11 39.29 33.33±0.68 A 28.71~37.38
Figure 5. Dendrogram of banana varieties based on the relative conductivity data. (Variety code 1 - 28,see
Table 1).
Cluster Analysis of MDA
The results showed that (Table 5) 28 different genotypes varieties of banana
could be divided into 3 groups by the average class (Figure 6). Cluster 1 consisted of 3
species (one AAA genome type, two AAAB genome types), their MDAs were low, and
their drought tolerance was strong; Cluster 2 consisted of 18 species (one AAA genome
type, three AA genome types, four BB genome types, five ABB genome types, one
AAAA genome type, two AAAB genome type, one AABB genome type, one ABBB
genome type), their MDA were moderate, and their drought tolerance were moderate;
Cluster 3 consisted of 7 species (four AAA genome types, one AA genome type, one
AAB genome type, one AAAA genome type), their MDA were large, and their drought
tolerance were inferior.
Genetics and Molecular Research 19 (2): gmr18544 ©FUNPEC-RP www.funpecrp.com.brR. Wang et al. 10
Table 5. Classification for MDA of different banana varieties.
Mean of
Cluster Code of variety Number of varieties Frequency(%) Range
cluster
1 2,24,26 3 10.71 111.40±9.46 C 78.07~128.82
1,7,8,9,11,12,13,14,15,
2 18 64.29 203.14±3.98 B 161.08~255.27
16, 17,18,19,22,23,25,27,28
3 3,4,5,6,10,20,21 7 25.00 332.17±7.44 A 284.95~365.59
Figure 6. Dendrogram of banana varieties based on the MDA data. (Variety code1-28,see Table 1).
Cluster Analysis of CTR、plasma membrane permeability and MDA
The results showed that (Table 6) 28 different genotypes varieties of banana could
be divided to 3 groups by the average class (Figure 7). Cluster 1 consisted of 15 species
(one AAA genome type, three AA genome types, four BB genome types, three ABB
genome types, one AAAA genome type, two AAAB genome types, one AABB genome
type), their CTR were large, plasmamembrane permeability and MDA were low, and their
drought tolerance were strong; Cluster 2 consisted of 11 species (five AAA genome types,
one AA genome type, two ABB genome types, one AAB genome type, one AAAA genome
type, one ABBB genome type), their CTR were low, plasmamembrane permeability and
MDA were large, and their drought tolerance were inferior; Cluster 3 consisted of 2 species
(two AAAB genome types), their CTR were low, and plasmamembrane permeability and
MDA were also low. By discrimination analysis after using cluster analysis, we used CTR,
plasmamembrane permeability and MDA as discriminant variables to establish a
discrimination function. According to discrimination function, we re-classified the original.
Discrimination classification result was zero misjudgment. We considered that this research
method established three discrimination models with better distinguishing abilities.
Genetics and Molecular Research 19 (2): gmr18544 ©FUNPEC-RP www.funpecrp.com.brDrought tolerance of banana genotypes 11
Table 6. Classification and discriminatory for CTR plasma membrane permeability and MDA of different
banana varieties.
Mean of cluster
Number of Frequency Plasmamem
Cluster Code of variety Discriminatory model
varieties (%) CTR brane MDA
permeability
2,7,8,9,11,12,
Y=8.7751CTR+2.6921PP
1 13,14,17,18,19, 15 53.57 59.07±0.34 A 23.88±0.44 B 183.61±4.45 B
+0.3003MDA -318.6620
22,24,25,27
1,3,4,5,6,10,1 Y=7.6128CTR+4.1515PP
2 11 39.29 47.95±0.45 B 33.33±0.68 A 299.37±9.24 A
5,16,20,21,28 +0.2860MDA -294.7513
Y=6.4407CTR+3.0195PP 134.30±25.74
3 23,26 2 7.14 44.04±0.80 C 22.21±0.84 B
+0.1871MDA -187.9265 C
Figure 7. Dendrogram of banana varieties based on the CTR、plasma membrane permeability and MDA data.
Abbreviations: MDA, malondialdehyde; CTR, cell tense ratio; PMP, plasma membrane permeability.
DISCUSSION
Currently, classification of bananas mostly follows the morphological classification
proposed by Simmonds (1995). Subsequently some others also conducted on research on
banana morphological markers (Ortiz, 1997; Osuji et al., 1997; Pilar et al., 1997; Karamura
et al., 1998; Lai et al., 2007). However, these morphological characteristics are controlled
by various genes and are influenced by environmental conditions simultaneously, so they
could not exactly compare various germplasms. Chromosome number, karyotype, banding
and behavior of meiotic division could be classified as one of strong evidences of resource
classification and genetic relationships (Qin et al., 2007). Ravi et al. (2013) phenotyped
bananas for drought resistance. Wang et al. (1994) found that none of the banana genomes
came from AA genotype. Besides, AAA genotype was not all autotriploid, and AAB and
Genetics and Molecular Research 19 (2): gmr18544 ©FUNPEC-RP www.funpecrp.com.brR. Wang et al. 12
ABB genotypes were not necessarily allotriploid. Chen (2002) carried on the chromosome
analysis to the part wild bananas and discovered that the germplasm of the wild bananas
was diploid; the chromosome number had three kinds of situations of 18, 20 and 22. Our
results showed that, according to the cluster analysis results of CTR, plasma membrane
permeability and MDA, the drought resistant of Hongxiangjiao (AAA) was strong, and it
was strictly separated from other AAA varieties. By researching karyotype of
Hongxiangjiao, Gong et al. (2002) founded that it (3n = 33) and wild banana (2n = 22) were
a kind of similarity between them and closely genetic relationship. Ji et al. (2007) showed
that although the peel of Xinglong Hongxiangjiao was red, and it was easy to separate to
other AAA varieties in the field, the genetic relationship between them were very similar
with the SSR markers detection. Li (2002) could make it be separated from other AAA with
field test and AFLP markers detection. AACV Rose (AA), Pisang Jari Buaya (AA) and
FHIA-25 (AAAA) were strong drought resistance, and in the same genotype with them
respectively Lingshui Yeshengjiao (AA) and FHIA-17 (AAAA) were sensitive drought
tolerance varieties. Ji et al. (2007) found modern cultivated banana varieties were narrow
genetic base and their genetic diversity were relatively low, but the genetic differences
between AACV Rose, Pisang Jari Buaya, FHIA-25 and modern cultivated banana varieties
(AAA genotype) were highlighted, which had important referential value for banana
breeding. There is no significant association between the geographical origin(Yuan et al.,
2018). Dongguan Zhongbadajiao, Dongguan Gaobadajiao, Mengjiala Fendajiao, Jianfenling
Dajiao and Cachaco belonged to ABB genotype were completely different drought
tolerance kinds, Dongguan Zhongbadajiao and Dongguan Gaobadajiao were strong drought
resistance, and Mengjiala Fendajiao, Jianfenling Dajiao and Cachaco were sensitive drought
resistance. Discussing classification location of Guangdong Dajiao, Wang et al. (1995)
argued that Dajiao (ABB) is homologous triploid, and is ABB genotype. Baihualing
Yeshengjiao, Qujiang BB, Yunnan BB, and Shixing BB belonged to BB the same BB
genotype and were in the same strong drought tolerance group. Although FHIA-01, FHIA-
18, FHIA-21 and CRBP39 belonged to the same AAAB genotype, their drought tolerance
was different. FHIA-18 and FHIA-21 is strong drought resistance, and not only CTR of
FHIA-01 and CRBP39 was small, but also the plasmamembrane permeability and MDA of
them were small. Pisang Ceylan, FHIA-03 and TMBx5295-1 respectively belonged to
AAB, AABB, and ABBB genotypes and their drought tolerance were divided into two
groups. FHIA-03 was strong drought resistance, and Pisang Ceylan and TMBx5295-1 were
sensitive drought tolerance varieties.
As more experimental materials, in my experiment, the varieties including more B
genome were not the very strong drought tolerance types, and the varieties including more
A genome were not the very sensitive drought tolerance type. But throughout the 28 banana
varieties, there was a tendency that the more B genome the varieties had, the stronger their
drought tolerance was; the more A genome the varieties had, the worse their drought
tolerance was; drought tolerance in tetraploids was stronger than in diploids and triploids. In
this study, we discuss whether the genes about controlling drought tolerance were
distributed in the B chromosomes only from the aspects of the banana leaves’
morphological and anatomical structures and physiology. As for its genetic mechanism,
genetics and molecular biology need more study.
Genetics and Molecular Research 19 (2): gmr18544 ©FUNPEC-RP www.funpecrp.com.brDrought tolerance of banana genotypes 13
ACKNOWLEDGMENTS
This work is supported by the National Natural Science Foundation of China
(31760549,30860170) and Hainan Postgraduate Innovation Research Project (Hys2019-91).
CONFLICTS OF INTEREST
The authors declare no conflict of interest.
REFERENCES
Ai XT, Liang TJ, Sha H, et al. (2014). Genetic diversity analysis on local upland cotton cultivars in XinJiang based on
SSR marks. Acta Agron. Sinica. 40: 369-379.
Bananuka JA, Rubaihayo PR and Tenywa MM (1999). Reactions of Musa genotypes to drought stress. Afr. Crop Sci. J.
7: 333-339.
Carr MKV (2009). The water relations and irrigation requirements of banana (Musa spp.). Exp. Agr. 45: 333-337.
Chen YM (2002). Characterization and classification of China Musa germplasm on the morphological and cytological
identification. Masters degree thesis of South China Agricultural University.
Christelová P, De Langhe E, Hřibová E, Čížková J, et al. (2017). Molecular and cytological characterization of the
global Musa germplasm collection provides insights into the treasure of banana diversity. Biodivers Conserv. 26:
801-824.
Dale J, James A, Paul JY, Khanna H, et al. (2017). Transgenic Cavendish bananas with resistance to Fusarium wilt
tropical race 4. Nat. Commun. 8: 1496.
Ekanayake IJ, Ortiz R and Vulsteke DR (1995). Physiological factors in drought tolerance of various Musa genotypes.
IITA Research. 7-10.
Ghavami M (1976). Banana plant response to water table levels. Trans. Amer. Soc. Agric. Eng. 19: 675-677.
Gong YL, Zeng BJ, Chen JY and Lai HJ (2002). Karyotype analysis of Musa AAA Red green. J. Guangdong Ed. Inst.
22: 73-75
Huang JC, Xiao Y and Zhao CX (1999). Some physiological responses of banana to water stress. J. Zhongkai Agrotech.
College. 12: 40-42.
Ji XR, Chen YY, Wang JY, Zheng LS, et al. (2007). Analysis of genetic diversity of A genome among banana cultivars
using SSR markers. J. Fruit Sci. 24: 783-787.
Jian LC, Sun DL, Shi GX and Zeng QT (1986). Leaf tissue structure in the cell of different kinds of citrus and its relation
to cold hardiness. Acta hort. Sinica. 13: 163-168.
Karamuxa DA (1998). Numerical taxonomic studies of the East African highland banana in Uganda. INIBAP,
Montpellier, France. 9-22.
Lai ZX, Chen Y, Lin YL, Zhao QY, et al. (2007). Discovery and taxonomy of wild banana (Musa spp. ‘AA’ Group) in
Fuzhou. Subtrop. Agr. Res. 1: 1-5
Li DF (2002). Studies on AFLP analysis and classification of Musa. Master’s degree thesis of Hunan Agricultural
University.
Laraib M, Sana M, Abdullahi ML, Muhammad JK, et al. (2019). Genome-wide identification and expression analysis of
calmodulin-binding transcription activator genes in banana under drought stress. Sci. Hortic-Amsterdam. 244: 10-
14.
Li HP (2009). Plant microtechnology (second edition). Science Press.
Muthusamy M, Uma S, Backiyarani S and Saraswathi S (2014). Computational prediction, identification, and expression
profiling of microRNAs in banana (Musa spp.) during soil moisture deficit stress. Hort. Sci. Biotechnol. 89: 208-
214.
Mitra J (2001). Genetics and genetic improvement of drought resistance in crop plants. Current Sci. 80: 758-763.
Muthusamy M, Uma S, Backiyarani S and Saraswathi S (2014). Computational prediction, identification, and expression
profiling of microRNAs in banana (Musa spp.) during soil moisture deficit stress. Hort. Sci. Biotechnol. 89: 208-
214.
Nansamba M, Sibiya J, Tumuhimbise R, Karamura D, et al.(2020). Breeding banana (Musa spp.) for drought tolerance:
A review. Plant Breeding.
Ortiz R (1997). Morphological Variation in Musa germplasm. Genetic Resources and Crop Evolution. 44: 393-404.
Osuji JO, Okoli BE, Vuylsteke D and Ortiz R (1997). Multivariate pattern of quantitative trait variation in triploid
banana and plantain cultivars. Sci. Hort. 71: 197-202.
Genetics and Molecular Research 19 (2): gmr18544 ©FUNPEC-RP www.funpecrp.com.brR. Wang et al. 14
Pavla C, Edmond DL, Eva H, Jana C, et al. (2017). Molecular and cytological characterization of the global Musa
germplasm collection provides insights into the treasure of banana diversity. Biodivers Conserv. 26: 801-824.
Pilar MC, Begona DA and Cruz MM (1997). Differences among Spanish Latin American banana cultivars: m
Morphological, chemical and sensory characteristics. Food Chem. 59: 411-419.
Qin XQ, Peng HX and Cao HQ (2007). Research and utilization of banana germplasm resources. J. Guangxi Agr. 22:
53-56.
Ramadass R and Sheriff MM (1993). Effect of moisture stress on the yield and yield components in banana as influenced
by their genome and ploidy. Madras Ag. J. 80: 130-133.
Ravi I, Uma S, Vaganan MM and Mustaffa MM (2013). Phenotyping bananas for drought resistance. Front Physiol. 4:
9.
Simmonds NW (1995). Bananas Musa (Musaceae). In: Smartt J, Simmonds NW. Evolution of Crop Plants (2nd.).
Longmans Scientific and Technical.
Stover RH and Simmonds NW (1987). Bananas (Third edition). Longman Scientific and Technical.
Turner David W, Fortescue Jeanie A and Thomas Dane S (2007). Environmental physiology of the bananas (Musa spp.).
Braz. J. Plant Physiol. 19: 463-484.
van Asten PJA, Fermont AM and Taulya G (2011). Drought is a major loss factor for rained East African highland
banana. Agr water manage. 98: 541-552.
Wang ZX, Lin ZP and Pan KQ (1994). Cytogenetical studies in Musa (Eumusa). Acta Genet. Sinica. 21: 453-462.
Wang ZX, Luo HM, Wu SC and Pan KQ (1995). The taxonomic position of Guangdong plantain. J. Trop. Subtrop. Bot.
3: 49-53.
Wu YL, Yi GJ, Huang BZ, Wei YR, et al. (2013). The Advancement of Research on Banana Germplasm Resources in
China. Acta Hortic. 975: 147-153.
Yuan XJ, Tu MY, He YL, Wang WQ, et al. (2018). Analysis of Genetic Diversity in 73 Kentucky Bluegrass Materials
by SSR and SRAP Markers. Not. Bot. Horti Agrobo. 46: 327-335.
Yu R, Guang SY, Zhi QZ, Xia K, et al. (2004). Comparisons of Several Similarity Coefficients for Cluster Analysis of
Hot Pepper Germplasm Resources. Agr. Biotechnol. 3: 24-28.
You CY, Nie XH, Zhang S, Guo HL, et al. (2014). Construction of DNA fingerprinting and analysis of genetic diversity
with SSR markers for 23 color cotton cultivars in XinJiang. Cotton Sci. 26: 161-170.
Ye JX, Wang SP, Zhang FJ, Xie DQ, et al. (2013). Proteomic analysis of leaves of different wheat genotypes subjected
to PEG 6000 stress and rewatering. Plant Omics. 6: 286-294.
Zhang K, Luo XM, Jiang YC, Wu ZD, et al. (2013). Genetic diversity among main sweet potato germplasm resources
using SRAP markers. J. Nuclear Agr. Sci. 27: 0568-0575.
Genetics and Molecular Research 19 (2): gmr18544 ©FUNPEC-RP www.funpecrp.com.brYou can also read