Comparison of Machine Learning Strategies in Hazardous Asteroids Prediction
←
→
Page content transcription
If your browser does not render page correctly, please read the page content below
Highlights in Science, Engineering and Technology                                         CMLAI 2023
Volume 39 (2023)

    Comparison of Machine Learning Strategies in Hazardous
                    Asteroids Prediction
                                           Yao Wang *
   Department of Tandon School of Engineering, New York University, New York, 11101, USA
                          * Corresponding author email: yw5438@nyu.edu
Abstract. The purpose of this study is to use multiple classification algorithm from machine learning
to predict hazardous asteroids that orbit Earth. Seven models are Logistic Regression, K-Nearest
Neighbor Classifier, Random Forest Classifier, Decision Tree Classifier, Multinomial Naïve Bayes
Classifier, Gradient Boosting Classifier, and Voting Classifier. Confusion matrix is used to evaluate
those models. Evaluation metrics include accuracy, precision, recall, and f1-score. The result shows
that random forest classifier has the greatest overall performance with highest accuracy. Decision
Tree classifier, Gradient Boosting classifier, and Voting classifier also perform well. Gradient
Boosting classifier is capable of greatly reducing the risk of hazardous asteroid, which is, reduce the
number of hazardous asteroids that is predicted as non-hazardous. Because of assumptions of some
models like Logistic Regression, data used in the experiment do not follow them, so the overall
performance of those models are not well. It would be better to select data for fitting the model. The
result shows that combined classifiers perform better. Voting Classifier can be used to assemble
those accurate models and get a more accurate result by offsetting disadvantages of each model.
Keywords: Machine Learning; Hazardous Asteroids; Voting Classifier; Asteroids Prediction.

1. Introduction
   In the universe, there are numerous asteroids. Due to the gravitational force of the Earth, many
asteroids may be attracted to the Earth and orbiting the Earth. They are potentially hazardous object:
“a near-Earth object (either an asteroid or a comet) with an orbit that can make close approaches to
the Earth and is large enough to cause significant regional damage in the event of impact” [1].
Hazardous asteroids can cause large impact on the Earth. For example, some scientists and scholars
speculate that dinosaur was extinct due to asteroid impact, and the impact changed the continents of
the Earth [2]. Although in recent world, there is no such a large impact on the Earth, it is significant
to prevent those hazardous asteroids in the universe, because once an asteroid collides Earth, a city
or even a country would have a devastated impact. With prediction, once scientists find hazardous
asteroids, they can prevent them from colliding Earth, such as using nuclear explosive device. More
accurate and precise models allow scientists to find hazardous asteroids early, so they can avoid them
beforehand.
   Machine learning is a way to predict hazardous asteroids from data. It can learn from data. Hence,
training with massive data, it would perform better and find the pattern. In this research, various
models and classifiers are compared on perspective of correctness, and which types of models would
perform better. There are seven models: Logistic Regression, K-Nearest Neighbor Classifier, Random
Forest Classifier, Decision Tree Classifier, Multinomial Naïve Bayes Classifier, Gradient Boosting
Classifier, and Voting Classifier. In those models, Random Forest classifier, Gradient Boosting
classifier, and voting classifier are models that combine various models. This research also aimed to
see whether combined models perform better in the case of predicting hazardous asteroids.
   In many research, potentially hazardous objects are predicted by various methods. For example,
research from Nikita Petrov, Leonid Sokolov, Elena Polyakhocva, and Fristina Oskina, differential
method for orbit improving is used with observation for finding potentially hazardous asteroids [3].
While Nishavi Ranaweera and Fernando used Impact Monitoring to predict [4]. In this research,
however, it compares and evaluates different methods for improving models in future.

                                                    201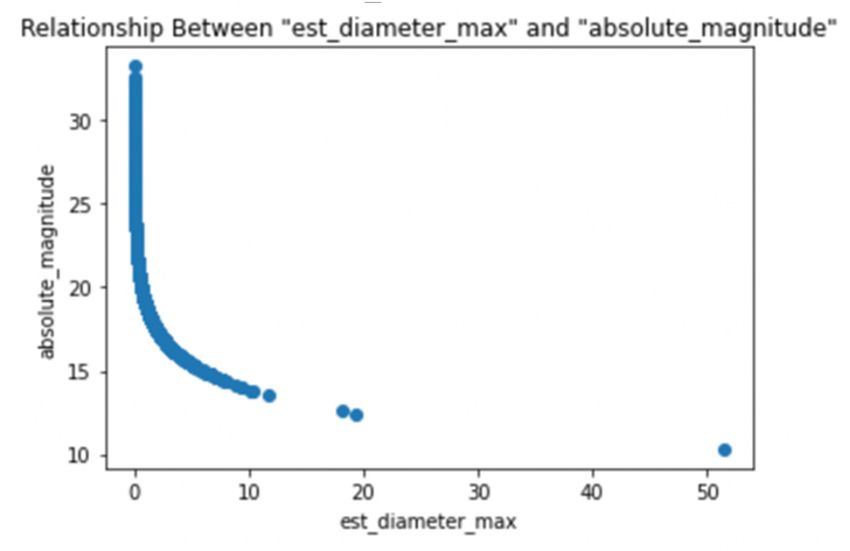
Highlights in Science, Engineering and Technology                                             CMLAI 2023
Volume 39 (2023)

2. Method
2.1 Data
   In this experiment, the data is a cumulative data for nearest Earth object abstracted from NASA’s
database. There are 90836 samples in the dataset. The dataset retrieved has 10 columns and 90837
rows as shown in Table 1 below [5].

                     Table 1. Features of hazardous asteroids prediction dataset
                         Column Name                                              Data Type
                                 id                                                   int
                               name                                                 object
                        est_diameter_min                                             float
                        est_diameter_max                                             float
                         relative_velocity                                           float
                           miss_distance                                             float
                          orbiting_body                                             object
                           sentry_object                                             bool
                       absolute_magnitude                                            float
                             hazardous                                               bool

   In the data, “id” is the unique identifier for each asteroid. “name” is the name of asteroid given by
NASA. “est_diameter_min” is the minimum estimated diameter of the asteroid in kilometer.
“est_diameter_max” is the maximum estimated diameter of the asteroid in kilometer.
“relative_velocity” is the relative velocity of asteroid to Earth. “miss_distance” is distance in
kilometer missed. “orbiting_body” is the planet that the asteroid orbits. “sentry_object” is whether
the asteroid is included in sentry, which is an automated collision monitoring system.
“absolute_magnitude” describes intrinsic luminosity. “hazardous” shows whether asteroid is harmful
or not.

                               Table 2. Samples of data. F: False; T: True
                                             Relative         Miss             Sentry     Abs    Hazard-
  id       name       D-min       D-max                                Orbit
                                              velocity      distance           object     mag     ous
  1     2000 SS164    1.1982      2.6794     13569.2       54839744    Earth     F       16.73     F
  2     2005 WK4      0.2658      0.5943     73588.7       61438126    Earth     F       20.00     T
  3     2015 YE18     0.7220      1.6145     114258.6      49798724    Earth     F       17.83     F
  4     2012 BV13     0.0965      0.2157     24764.3       25434972    Earth     F       22.20     F
  5     2014 GE35     0.2550      0.5702     42737.7       46275567    Earth     F       20.09     T

   Table 2 shows first five samples of dataset. For example, the data in the first row is for an asteroid,
whose id is 2162635, and name is 2000 SS164. The minimum and maximum estimated diameter of
the asteroid are 1.198271 kilometers and 2.679415 kilometers respectively. Its relative velocity to
Earth is 13569.249224, and distance missed is 5.48397 x 10⁷ kilometers. It orbits Earth and is not
included in sentry. Its absolute magnitude is 16.73. This asteroid is not hazardous.
   Since columns “orbiting_body” and “sentry_object” for all samples in the data set have one unique
value (“orbiting_body” for all samples is Earth; “sentry_object” for all samples is False), these two
parameters will not be considered in the prediction, because no data shows the relationship between
those two and “hazardous”.

                                                     202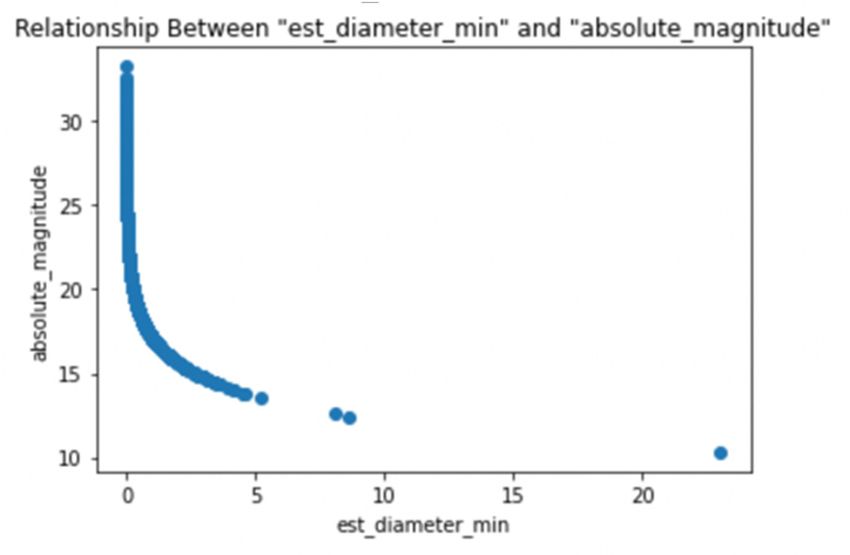
Highlights in Science, Engineering and Technology                                            CMLAI 2023
Volume 39 (2023)

2.2 Machine Learning Classifiers
    In this study, multiple classification methods are used for predicting whether an asteroid with given
parameters is hazardous or not. The methods are Logistic Regression, K-Nearest Neighbor Classifier,
Random Forest Classifier, Decision Tree Classifier, Multinomial Naïve Bayes Classifier, Gradient
Boosting Classifier, and Voting Classifier. All these models are widely used machine learning
algorithms. By comparing the performances of these models, not only the baseline of hazardous
asteroid prediction could be constructed but the effectiveness of widely seen algorithms are validated.
    Logistic regression analyzes the relationship between several independent variables and a
dependent variable. It is easy to implement and efficient to train. Since its simple structure, the results
are interpretable, which distinguish this simple but effective model to other modern machine learning
methods. However, it constructs linear binaries, and it is difficult for logistic regression to analyze a
complex relationship. Its assumption is that independent data are independent of each other [6].
    K-Nearest Neighbor Classification (KNN) predicts the result of the data point based on another
data point that nearest to it. This method does not perform training data. The KNN predicts the
hazardous by looking for K nearest samples and integrate the categories of K nearest samples as the
prediction results. It can be used for both classification and regression problems. However, this
method requires to determine the value of K, which would be difficult. Moreover, with the growing
of the training data, the algorithms become slower, since it must search the entire training data space
to locate the nearest neighbors.
    Random Forest Classifier is a set of decision tree classifier, reducing overfitting problem in
decision tree. By integrating multiple decision trees, the randomness lies in the decision tree algorithm
could be mitigated. Moreover, it can handle outliers automatically. Due to many trees in this method,
it is complex and requires longer period.
    Decision Tree Classifier is a basic tree-based classifier. It does not require normalization and
scaling of data, but it is unstable and sensitive to outliers. During its learning process, a small noise
in dataset would cause a structure change so that affect the final architecture of the trees. Also,
resulting tree does not perform well on fitting new data points. [7]
    Multinomial Naïve Bayes (NB) Classifier calculates the conditional probability of an event based
on previous knowledge of conditions. It is a representative method in generative learning strategies,
which assumes the data distribution and the relationship among different features satisfies the Bayes
assumption. It is simple to implement, but its accuracy of prediction is lower than others. Because the
generative essence is difficult to learn optimal data separation than its discriminative counterpart [8].
    Gradient Boosting Classifier combines multiple weak models to strongly predict data, which is
typically decision tree classifier. Each model may offset the drawbacks of each other. By integrating
multiple weak models, the performances could be boosted according to previous experiences.
However, it is prone to overfitting problem [9].
    Voting Classifier trains the data in various models and predict the result on average of those results
from other models. Similar to the gradient boosting classifier, it avoids the deficiencies lies in multiple
weak models and further increase the performance. In this research, voting classifier combines
Random Forest classifier, Decision Tree classifier, and Gradient Boosting Classifier [10].
2.3 Evaluation Metrics
   Confusion matrix can be used to show the correctness of prediction. It is a matrix with two columns
and two rows, containing four classes: rue Positive (TP), True Negative (TN), False Positive (FP),
and False Negative (FN). True Positive (TP) means that the data is both predicted and actually
observed as positive. True Negative (TN) means that the data is both predicted and actually observed
as negative. False Positive (FP) means that the actual observation of a data is negative but predicted
as positive. False Negative (FN) means that the actual observation of a data is positive but predicted
as negative. [10-11]
   Accuracy, precision, recall, and f1-score are four metrics used for evaluating models. These four
metrics are obtained from confusion matrix. Accuracy equals to sum of numbers of TP and numbers

                                                    203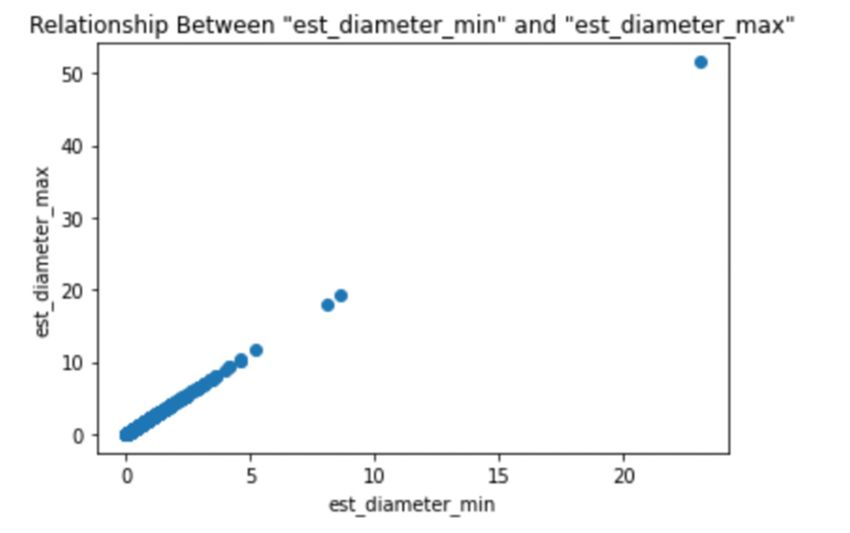
Highlights in Science, Engineering and Technology                                          CMLAI 2023
Volume 39 (2023)

of TN divided by total number of observations. It shows the ratio of correctness of prediction.
Precision is the ratio of numbers of TP and the sum of numbers of TP and TN. Recall is the ratio of
numbers of TP and the sum of numbers of TP and FN. F1-Score is weighted average of Precision and
Recall. Accuracy is main metrics used in evaluating the performance of classifiers.

3. Result
3.1 Result Measured by Confusion Matrix

  Fig 1. Classification results of various machine learning models measured by confusion matrix

   Figure 1 above are confusion matrix for different machine learning classifiers. The color represents
the amount of data. The color of the cell that is close to yellow represents that there is more data, and
that is close to purple represents that there is less data. For example, the left upper grid of Logistic
Regression’s confusion matrix is 6082, meaning that the model predicts that 6082 numbers of
asteroids are not hazardous, and actual results are also not hazardous. It is dark blue, which means
the numbers of data with these values are not much. It could be observed that most methods perform
satisfactorily, and the voting classifier outperforms other machine learning methods.
   The lower left corner means the numbers of asteroid that is hazardous but is predicted as safe. It is
an important index to measure how many hazardous asteroids are miss classified. Missing an asteroid

                                                    204
Highlights in Science, Engineering and Technology CMLAI 2023
Volume 39 (2023)
like this could potentially threat the safety of the Earth. Therefore, the number in this corner should
be as small as possible in order to reduce the risk of hazardous asteroids. Even though there are many
FP in the upper right corner, which causes inefficiency, the most important thing is to eliminate the
risk of hazardous asteroids. Gradient Boosting Classifier has the least number in that corner, so it is
the best model for avoiding the risk from misprediction.
3.2 Model Comparison
Table 3 shows evaluation of classifiers with different metrics. Random forest classifier has the
largest accuracy, which is 0.95, and voting classifier also has high accuracy. Label “0” of gradient
boosting classifier has the best precision, which is 0.99. Random forest classifier, decision tree
classifier, and voting classifier also have high precision up to 0.95. In addition, they have higher score
on recall and f1-score. Consequently, random forest classifier, decision tree classifier and voting
classifier perform better. All these models are boosting models, where weak models are integrated
together for increasing the overall performance. It could be concluded that these integrated models
perform superior to a single classifier.
Table 3. Result comparison of various machine learning models.
Method Label Accuracy Precision Recall F1-Score
0 0.63 0.37 0.47
Logistic Regression 0.58
1 0.56 0.79 0.65
0 0.84 0.72 0.77
K-Nearest Neighbor Classification 0.79
1 0.75 0.86 0.80
0 0.95 0.94 0.95
Random Forest Classifier 0.95
1 0.94 0.95 0.95
0 0.93 0.94 0.93
Decision Tree Classifier 0.93
1 0.94 0.93 0.93
0 0.56 0.56 0.56
Multinomial Naïve Bayes Classifier 0.56
1 0.56 0.57 0.56
0 0.99 0.79 0.88
Gradient Boosting Classifier 0.89
1 0.82 0.99 0.90
0 0.95 0.93 0.94
Voting Classifier 0.94
1 0.93 0.95 0.94
4. Discussion
In this section, the results of all models are sequentially discussed. Then the overall discussion is
further summarized at the end of this section.
Fig 2. Relationship discussion in logistic regression model.
205Highlights in Science, Engineering and Technology CMLAI 2023
Volume 39 (2023)
Logistic Regression: The result shows that logistic regression model is 58% accurate, which is low.
From the assumption of logistic regression model, independent variables should have no, or very little,
multicollinearity. However, some independent variables of the data are related. For example, the
minimum and maximum estimated diameter are related, because when minimum estimated diameter
of an asteroid is small, maximum estimated diameter of it would not be large compared to other
asteroids and vice versa as it is shown in Figure 2, which is a linear relationship.
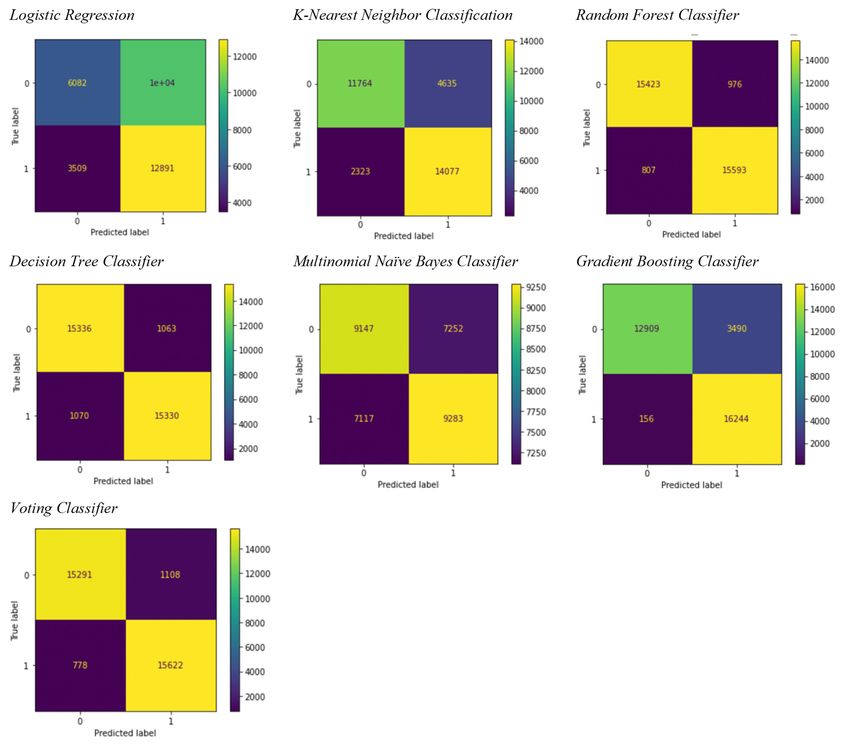
Besides, estimated diameter is also related to absolute magnitude of the asteroid. The relationship
is shown in Figure 3, which is an inverse relationship. Since the data does not meet the assumption
of logistic regression model, the result is not accurate.
Fig 3. Relationship discussion about estimated diameter and absolute magnitude.
K-Nearest Neighbor Classification: From the result, K-Nearest Neighbor classification performs
well. The assumption of the model is that data with similar characteristics would have same results.
However, it is difficult to assume data with similar characteristics have same results. For all
independent variables, there is no apparent data. For example, Figure 4 is the plot of “relative_velocity”
and “hazardous”. It illustrates that many asteroids with similar relative velocity have different result.
Plots of other variables are like this graph. Although there may be correlation for similar asteroids
and result, it is not obvious, so the scores of this model do not exceed 0.90.
Fig 4. Relationship between relative_velocity and hazardous.
Random Forest Classifier: Random Forest classifier has the best performance according to the
scores in result. It performs better than decision tree classifier, because it consists of a large amount
of decision tree, so it would be more accurate and precise. Also, the data follows the assumption of
the classifier, which is that the input is continuous, and the output is discrete.
Decision Tree Classifier: Decision Tree classifier performs well. The reason is same to the
random forest classifier.
Multinomial Naïve Bayes Classifier: Multinomial Naïve Bayes classifier has relatively low
accuracy because it has same problem with logistic regression model on independent variable. The
206Highlights in Science, Engineering and Technology CMLAI 2023
Volume 39 (2023)
assumption of this classifier is that all input variables are independent with each other, meaning that
there is no correlation between them.
Gradient Boosting Classifier: Gradient Boosting Classifier has good accuracy. With more trees
built by this method, the new tree could correct the error of previous trees. It performs like Random
Forest Classifier, but Gradient Boosting Classifier is not as complex as it.
Voting Classifier: From the definition of Voting classifier, it combines various regression models
to predict. Since it is the combination of multiple models and takes average of them, models are likely
to offset the disadvantages of each other. Therefore, it has high performance.
From the definitions of classifiers and result, combined models such as Voting Classifier, Random
Forest Classifier, and Gradient Boosting Classifier would perform better for predicting hazardous
asteroid. The reason may be that with more models or classifiers, outliers would be well considered,
and drawbacks of each model would be offset by each other. Although the Multinomial Naïve Bayes
classifier is the combination of multiple classifiers, the data does not follow assumption of this
classifier.
Although there are models with good accuracy that exceeds 90%, risk still exist. Combined models
perform better. More data and information are necessary to eliminate the risk. Voting Classifier is a
good classifier, because with various models, if few models predict wrongly, the result may be correct
with more true predictions from other models.
5. Conclusion
Machine Learning is important in many fields, and classifier algorithm is key aspect. In field of
cosmology, classifiers help scientists to predict hazardous asteroids. In this study, many classifiers
are used to predict hazardous asteroids. In the experiment, four classifiers perform relatively good:
Random Forest classifier, Decision Tree Classifier, Gradient Boosting Classifier, and Voting
Classifier. Their accuracy is 95%, 93%, 89%, and 94% respectively. The reason is that the data
follows the assumption of those models. Also, the fact shows that the model that combines multiple
models may perform better in this case. Also, Gradient Boosting Classifier has the lowest risk,
because the least number of asteroids that is hazardous is wrongly predicted. Because data does not
follow assumptions of some classifiers in this experiment, such as Logistic Regression, data should
be carefully selected for prediction of hazardous asteroids.
In predicting hazardous asteroids, models like Gradient Boosting Classifier are first choices.
Although there may be more wrong predictions on non-hazardous asteroids, it is more significant to
pay more effort on preventing hazardous asteroids. Hence, accuracy is not the only indicator of good
classifier. With advancing knowledge and technology in machine learning and cosmology, it is
necessary to find a model or classifier that is accurate and fit to the cosmological study in the future.
It would be better to generate a model that combines various models with less False Negative value.
References
[1] Atkinson H, Tickell C, Williams D. Report of the task force on potentially hazardous near Earth objects.
2000.
[2] Hartmann, W. K., The Impact That Wiped Out the Dinosaurs, 09/21/2022, URL: https:// www. psi. edu/
epo/ ktimpact/ktimpact.html.
[3] Petrov N, Sokolov L, Polyakhova E, et al. Predictions of asteroid hazard to the Earth for the 21st century,
In: AIP Conference Proceedings. 2018, 1959(1): 040012.
[4] Ranaweera R N, Fernando T. Prediction of Potentially Hazardous Asteroids using Deep Learning, In:
2022 2nd International Conference on Advanced Research in Computing (ICARC). IEEE, 2022: 31-36.
[5] Vani, Sameep, NASA-Nearest Earth Objects, 06/17/2022, URL: https://www. kaggle.com/ datasets/
sameepvani/nasa-nearest-earth-objects.
207Highlights in Science, Engineering and Technology CMLAI 2023
Volume 39 (2023)
[6] Park H A. An introduction to logistic regression: from basic concepts to interpretation with particular
attention to nursing domain. Journal of Korean Academy of Nursing, 2013, 43(2): 154-164.
[7] Safavian S R, Landgrebe D. A survey of decision tree classifier methodology. IEEE transactions on
systems, man, and cybernetics, 1991, 21(3): 660-674.
[8] Xu S, Li Y, Wang Z. Bayesian multinomial Naïve Bayes classifier to text classification, Advanced
multimedia and ubiquitous engineering. Springer, Singapore, 2017: 347-352.
[9] Nelson D. Gradient boosting classifiers in python with scikit-learn. Retrieved from Stack Abuse, 2019.
[10] Tandel G S, Tiwari A, Kakde O G. Performance optimisation of deep learning models using majority
voting algorithm for brain tumour classification. Computers in Biology and Medicine, 2021, 135: 104564.
[11] Haghighi S, Jasemi M, Hessabi S, et al. PyCM: Multiclass confusion matrix library in Python. Journal of
Open-Source Software, 2018, 3(25): 729.
208You can also read