Comparison of the morphological characteristics of sub-elite fe- male football players according to playing position - Preprints.org
←
→
Page content transcription
If your browser does not render page correctly, please read the page content below
Preprints (www.preprints.org) | NOT PEER-REVIEWED | Posted: 22 February 2021                               doi:10.20944/preprints202102.0464.v1

     Article

     Comparison of the morphological characteristics of sub-elite fe-
     male football players according to playing position
     Anita Strauss 1,2, Martinique Sparks 2* and Cindy Pienaar 3,2

                                       1 Department of Sport, Rehabilitation & Dental Science, Tshwane University of Technology, Pretoria, Pretoria
                                         West Campus, South Africa; StraussA@tut.ac.za
                                       2 Physical Activity, Sport and Recreation (PhASRec), North-West University, Potchefstroom, South Africa;

                                         martinique.sparks@nwu.ac.za
                                       3 Department of Sport Studies, Faculty of Applied Sciences, Durban University of Technology, Durban, South

                                         Africa, CindyP@dut.co.za
                                       * Correspondence: martinique.sparks@nwu.ac.za; Tel.: +2718 299 1770

                                       Abstract: The aim of this article was to examine if there are position-specific differences in the mor-
                                       phological characteristics of sub-elite female football players and to establish normative standards
                                       for this level of female football players. The morphological features of 101 sub-elite female football
                                       players (age: 21.8±2.7 years) were assessed. Twenty anthropometric sites were used in the measure-
                                       ments of body composition and somatotype. The average value of body fat percentage was
                                       20.8±5.7%. The somatotype of the overall group was 4.0–2.4–2.1. Positional significant (p ≤ 0.05) dif-
                                       ferences were found between goalkeepers and outfield players in morphological characteristics.
                                       Goalkeepers were taller, heavier, possessed the highest body fat percentage and showed higher val-
                                       ues for all skinfold, breadth, girth and length measurements. However, there were very few practi-
                                       cally worthwhile differences between the outfield positions. Positional groups did not differ (p ≤
                                       0.05) in somatotype characteristics either. The study suggests that at sub-elite level there are mainly
                                       differences between goalkeepers and outfield players, but outfield players are homogeneous when
                                       comparing morphological characteristics. These results may serve as normative values for future
                                       comparisons regarding the morphological characteristics of female football players.

                                       Keywords: anthropometry, height, somatotype, body mass, soccer, sports performance

                                       1. Introduction
                                             Female football is experiencing a constant growth in the number of players world-
                                       wide [1]. The efficiency of the game is influenced by several factors, including morpho-
                                       logical characteristics, motor abilities, functional abilities, technical and tactical abilities
                                       [2]. The profile of football players has therefore become a subject of decisive interest [3].
                                       Ample literature regarding the morphological characteristics of male football players ex-
                                       ists, but less is known about female players [4]. To compete at an elite level, players need
                                       to possess morphological characteristics applicable to both the sport and specific playing
                                       positions [5].
                                             A few studies have recently focused on the morphological characteristics of female
                                       football players participating on elite and sub-elite level [6, 7, 8, 9]. Results indicate that
                                       standing height and mass differ according to playing position in female football [7, 10, 11].
                                       Goalkeepers are taller [10] and heavier [12], with defenders also being among the taller
                                       players [10]. Midfielders tend to be the shortest and lightest players, followed by forwards
                                       [13, 14]. It is believed that a tall goalkeeper is advantageous in jumping to reach for a ball
                                       and defending a goal [15], while the shorter height and lighter body mass of midfielders
                                       enable them to move more efficiently and cover longer distances on the field [5]. Body fat
                                       percentage (BF%) also differs between playing positions in female football, with goalkeep-
                                       ers having the highest body fat percentage [7]. This is possibly due to the lower level of
                                       activity required during a match [16].

               © 2021 by the author(s). Distributed under a Creative Commons CC BY license.
Preprints (www.preprints.org) | NOT PEER-REVIEWED | Posted: 22 February 2021 doi:10.20944/preprints202102.0464.v1
Skeletal length and girth measurements show a general tendency to be larger for
goalkeepers, with special reference to longer leg and arm lengths compared to other play-
ing positions [13]. There is also a trend for midfielders to be among the players with the
smallest skeletal length and girth measurements, which can again be attributed to their
shorter stature, lower body mass and positional role [13]. The physical characteristics of
the body gives an indication of somatotype [17]. Three somatotype components are used
to define body shape; namely endomorphy (relative fatness), mesomorphy (musculoskel-
etal component) and ectomorphy (linearity) and are expressed by a three-number rating
[18]. Mesomorphy is generally the most predominant somatotype component among foot-
ball players [19], with an ectomorphic mesomorph body type being advantageous for ac-
tions requiring speed, power and endurance, which are vital components for football per-
formance [20].
These above mentioned morphological characteristics are viewed as important con-
siderations in the selection process for team positions [13]. Due to a shortage of related
studies, a need exists for the establishment of normative data for female football players.
The primary aim of this article is to examine if there are position-specific differences in
the morphological characteristics of sub-elite female football players. A secondary aim is
to utilise the morphological characteristics of sub-elite female football players to establish
normative standards for this level of female football players.
2. Materials and Methods
The study comprised 101 South African sub-elite female football players with a mean
age of 21.8±2.7 years. Sub-elite level generally refers to players competing at club, college,
or university level. In line with previous studies on female football players [12, 14], the
players were divided into four positional groups, namely forwards, midfielders, defend-
ers and goalkeepers. All the participants were regular football players competing in local
club-level and student tournaments with an average of 7.5 years playing experience. The
participants practiced on a regular basis (2–3 times per week) and measurements were
collected during the competition season. Participation in the study was voluntary and
participants could withdraw from the study at any time without prejudice. Prior to the
start of the study, the participants were duly informed of the purpose and experimental
procedures and an explanation of the potential risks and benefits of the study were given.
Each player received a participant number to ensure anonymity.
Anthropometric measurements were taken according to the standard procedures of
the International Society for the Advancement of Kinanthropometry [21]. Measurements
included: (i) stature measured in centimeters to the nearest 0.1 cm using a Harpenden
Portable Stadiometer (Holtain Limited, UK) with the player standing upright and the
player’s head in the Frankfort plane; (ii) body mass measured in kilograms to the nearest
0.1 kg using a portable electronic scale (Beurer Ps07 Electronic Scale, Ulm, Germany) with
the participants wearing minimal clothing (such as shorts and a crop top) and no shoes;
(iii) skinfolds of the triceps, subscapular, supraspinal, abdominal, frontal thigh and medial
calf were measured with a Harpenden Skinfold Caliper (Holtain Limited, UK) to the near-
est 0.2 mm with a constant pressure of 10 g/mm2; (iv) breadths of the humerus, wrist,
femur and ankle were measured with a Holtain Bicondylar Caliper (Holtain Limited, UK)
to the nearest 0.1 mm; (v) girth measurements for relaxed arm, flexed arm, waist, gluteus
and mid-thigh taken with a Lufkin metal tape (Cooper Industries, USA) to the nearest 0.1
cm; and (vi) skeletal lengths of the upper arm, lower arm, hand and foot were measured
with a Rosscraft segmometer (Rosscraft Innovations Incorporated, Canada) to the nearest
0.1 cm. All anthropometric measurements were taken by the same two Level 2 ISAK-cer-
tified anthropometrists twice on the right-hand side of the body. The mean values of these
measurements were used in the statistical analysis. Body fat percentage [22] and muscle
and skeletal mass [23] as well as somatotype [18] was calculated using previously estab-
lished formulas. Arm, mid-thigh and calf girths were corrected with the different skin-
folds at these sites by applying the following formula: Corrected arm girth = Girth –Preprints (www.preprints.org) | NOT PEER-REVIEWED | Posted: 22 February 2021 doi:10.20944/preprints202102.0464.v1
(3.1416 x (triceps skinfold/10)); Corrected thigh girth = Girth – (3.1416 x (thigh skin-
fold/10)); Corrected calf girth = Girth – (3.1416 x (calf skinfold/10)). Corrected girths were
used because they serve as better indicators of musculoskeletal size at each site [24]. The
technical error of measurement was calculated according to the method of Pederson and
Gore [25]. A value of 1.80% (1.75 mm) was revealed for all skinfold measurements, 0.62%
(0.16 cm) for all breadth measurements, 0.01% (0.02 cm) for all girth measurements and
0.87% (0.19 cm) for all length measurements. Thus, indicating that all anthropometric
measurements were reliable for the purpose of this study.
The Statistical Package for Social Science (IBM SPSS Statistics 26) was used for statis-
tical analysis. Descriptive statistics were calculated and used to describe the morphologi-
cal characteristics of the players. The statistics were reported as mean ± standard deviation
(SD). One-way analysis of variance (ANOVA) was used to determine differences between
the morphological characteristics among the four playing positions. Scheffe’s F test was
also used for multiple comparisons between groups. Tukey’s post hoc test was used to
determine which variables differed significantly. The level of statistical significance was
set a p ≤ 0.05. Due to the sampling variability, effect size (Cohen’s D) and 90% confidence
intervals were used to compare differences in standardised effects between playing posi-
tions. Magnitudes of standardised effects were assessed as: 0–0.2 trivial, 0.2–0.6 small, 0.6–
1.2 moderate, 1.2–2.0 large, and >2.0 very large [26]. An effect size greater than 0.2 was
seen as a worthwhile change, however if the lower and upper confidence intervals ex-
ceeded -0.2 and 0.2 the difference is deemed unclear and no inference can be made on
whether “true” differences can be observed in the greater population [26].
For the purpose of normative classification, the body composition variables were
classified using standard nine (“stanine”) scores which scaled the parameters from “ex-
tremely low” to “extremely high” [27].
3. Results
Descriptive statistics of the morphological characteristics for the total group and differ-
ences according to specific playing positions are presented in Table 1. The players had a
mean standing height and mass of 160.0 cm and 57.1 kg respectively. Goalkeepers were
significantly taller (excluding forwards) and heavier than the other outfield players. With
regards to statistical significance, the only significant differences were found between the
goalkeepers and the outfield players. No significant differences were found between for-
wards, midfielders, and defenders. Descriptive statistics for body composition character-
istics and comparisons between playing positions are presented in Table 2. Once again,
the only statistically significant differences were between goalkeepers and the outfield
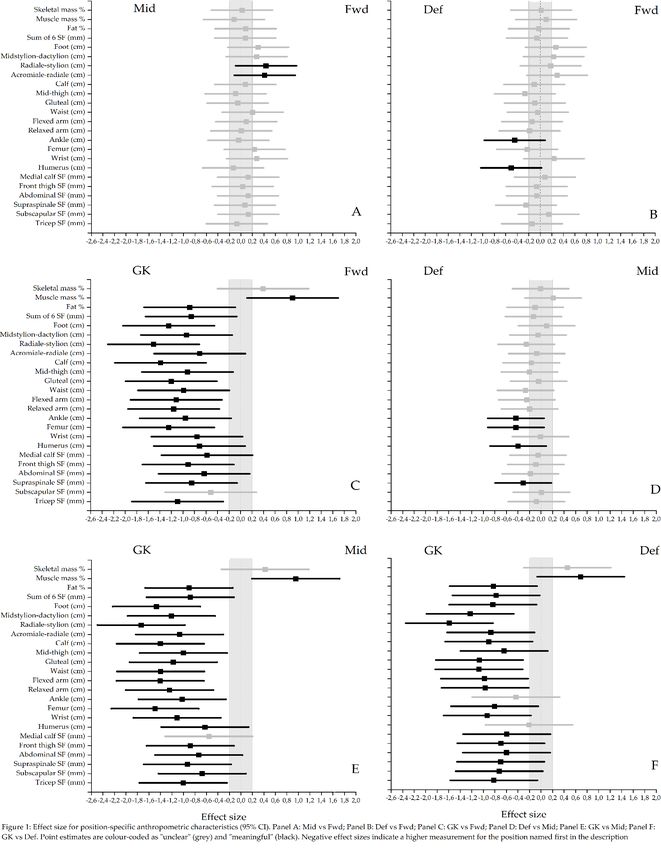
players. However, from Figure 1 it is apparent that although some effect sizes were larger
than 0.2 for outfield position differences, the upper and lower confidence intervals were
beyond 0.2 and -0.2, which means that the inference is deemed unclear. The only clear
inferences that can be made is for differences between goalkeepers and outfield players.
For most measurements, goalkeepers had larger skinfolds, girths, circumferences, and
longer bone lengths. Goalkeepers also had a lower relative muscle mass (Effect size > 0.6)
and a higher fat % (Effect size > 0.8). All positional groups had average endomorphic
values (Table 2). While the forwards and midfielders presented a balanced endomorph
somatotype, the defenders and goalkeepers showed an average mesomorphic-endo-
morph somatotype. Due to no differences between the outfield players, each of the body
composition components are presented according to stanine categorizations in Table 3 to
provide a method of classifying each component from “extremely low” to “extremely
high”. For example, an ‘above average’ fat % for an outfield player would be between
20.8% and 24.4%. No stanines are provided for goalkeepers due to the small sample size.Preprints (www.preprints.org) | NOT PEER-REVIEWED | Posted: 22 February 2021 doi:10.20944/preprints202102.0464.v1
Table 1: Morphological characteristics of sub-elite female football players by playing position (mean± SD)
Variables Total (n = 101) FW (n = 25) MF (n = 33) DF (n = 34) GK (n = 9) F-value p-value
Body stature (cm) 160.0 ± 6.8 160.9 ± 5.7 158.7 ± 6.1* 159.1 ± 6.9* 166.2 ± 8.4 3.5 0.018
Body mass (kg) 57.1 ± 9.1 56.3 ± 8.4* 55.0 ± 8.4* 57.4 ± 9.9* 66.5 ± 5.1 4.2 0.008
Skinfolds (mm)
Tricep 16.0 ± 5.3 15.1 ± 4.7* 15.5 ± 4.9* 15.9 ± 5.7 20.5 ± 5.8 2.7 0.052
Subscapular 11.4 ± 4.7 11.4 ± 4.5 10.9 ± 3.9 10.9 ± 3.4 14.6 ± 9.4 1.7 0.169
Supraspinale 10.3 ± 5.3 9.6 ± 4.1* 9.3 ± 4.4* 10.7 ± 4.5 15.0 ± 10.4 3.1 0.030
Abdominal 19.2 ± 8.3 18.8 ± 8.0 17.8 ± 8.4 19.3 ± 7.7 24.2 ± 9.9 1.4 0.233
Front thigh 24.9 ± 10.2 24.1 ± 8.9 23.8 ± 9.7 24.7 ± 11.3 32.4 ± 9.9 1.8 0.145
Medial calf 15.7 ± 6.1 15.9 ± 5.1 15.1 ± 7.2 15.4 ± 5.9 18.9 ±5.3 0.9 0.421
Breadths (cm)
Humerus 6.1 ± 0.3 6.0 ± 0.3 6.1 ± 0.3 6.2 ± 0.4 6.3 ± 0.5 2.2 0.097
Wrist 5.1 ± 0.3 5.1 ± 0.3 5.1 ± 0.2* 5.1 ± 0.3* 5.3 ± 0.3 2.8 0.044
Femur 8.9 ± 0.5 8.9 ± 0.4a 8.7 ± 0.4* 9.0 ± 0.6 9.4 ± 0.5 4.7 0.004
Ankle 6.5 ± 0.4 6.4 ± 0.4 6.4 ± 0.3 6.6 ± 0.4 6.7 ± 0.3 3.0 0.034
Girths (cm)
Relaxed arm 24.9 ± 2.6 24.5 ± 2.6* 24.5 ± 2.4* 25.0 ± 2.5 27.4 ± 2.1 3.6 0.017
Flexed arm 26.4 ± 2.4 26.1 ± 2.5* 25.9 ± 2.1* 26.4 ± 2.4* 28.7 ± 1.9 3.8 0.012
Waist 68.0 ± 5.9 67.7 ± 6.5* 66.5 ± 5.3* 68.0 ± 5.5* 73.9 ± 5.4 4.0 0.010
Gluteal 93.4 ± 6.7 92.4 ± 6.7* 92.8 ± 6.4* 93.1 ± 6.7* 99.9 ± 4.4 3.3 0.022
Mid-thigh 51.2 ± 4.6 50.3 ± 4.9 50.7 ± 3.9 51.6 ± 4.9 54.6 ± 4.0 2.3 0.085
Calf 32.9 ± 2.6 32.6 ± 2.1* 32.4 ± 2.2* 32.9 ± 3.0* 35.5 ± 2.0 3.7 0.014
Lengths (cm)
Acromiale-radiale 30.7 ± 1.6 31.0 ± 1.3 30.4 ± 1.4* 30.5 ± 1.7 32.0 ± 1.9 3.0 0.032
Radiale-stylion 24.2 ± 1.5 24.3 ± 1.2* 23.8 ± 1.4* 24.1 ± 1.3* 26.3 ± 1.6 8.6 0.000
Midstylion-dactylion 18.5 ± 1.0 18.5 ± 1.0 18.3 ± 1.0* 18.3 ± 0.9* 19.5 ± 1.2 4.2 0.008
Foot 24.4 ± 1.6 24.6 ± 1.0 24.3 ± 1.1 24.1 ± 2.2* 25.8 ± 0.7 3.0 0.033
FW: Forwards; MF: Midfielders; DF: Defenders; GK: Goalkeepers; * Differs significantly at p ≤ 0.05Preprints (www.preprints.org) | NOT PEER-REVIEWED | Posted: 22 February 2021 doi:10.20944/preprints202102.0464.v1
Table 2: Body composition characteristics of sub-elite female football players by positional group (mean ± SD)
Variables Total (n = 101) FW (n = 25) MF (n = 33) DF (n = 34) GK (n = 9) F-value p-value
Sum of 6
97.5 ± 35.8 94.9 ± 31.7 92.3 ± 35.4 96.9 ± 34.2 125.6 ±45.9 2.2 0.092
skinfolds (mm)
Fat (kg) 12.2 ± 5.2 20.4 ± 5.1* 20.0 ± 5.7* 20.6 ± 5.5* 25.4 ± 7.2 2.3 0.081
Fat % 20.8 ± 5.7 11.8 ± 4.6 11.3 ± 4.8 12.2 ±5 .1 17.2 ± 6.2 2.4 0.022
Muscle mass (kg) 21.3 ± 2.1 21.1 ± 1.9* 20.8 ± 1.9* 21.3 ± 2.2* 23.7 ± 1.0 5.2 0.002
Muscle mass % 37.7 ± 2.7 37.9 ± 2.4 38.2 ± 2.6 37.6 ± 2.8 35.7 ± 2.0 2.1 0.107
Skeletal mass (kg) 6.8 ± 0.9 6.8 ± 0.7* 6.6 ± 0.7* 6.9 ± 1.0* 7.7 ± 1.0 4.3 0.007
Skeletal mass % 12.1 ± 1.2 12.1 ± 1.4 12.1 ± 1.2 12.1 ± 1.1 11.6 ± 1.2 0.5 0.693
Endomorphy 4.0 ± 1.3 3.8 ± 1.2 3.8 ± 1.2 4.0 ±1.3 4.9 ± 1.8 1.8 0.147
Mesomorphy 2.4 ± 0.9 2.0 ± 0.9 2.3 ± 0.7 2.7 ± 1.0 2.5 ±1.2 1.8 0.145
Ectomorphy 2.1 ± 1.2 2.4 ± 1.4 2.1 ± 1.0 1.9 ± 1.3 1.7 ±1.3 1.2 0.374
FW: Forwards; MF: Midfielders; DF: Defenders; GK: Goalkeepers * Differs significantly from goalkeepers at p ≤ 0.05Preprints (www.preprints.org) | NOT PEER-REVIEWED | Posted: 22 February 2021 doi:10.20944/preprints202102.0464.v1
Preprints (www.preprints.org) | NOT PEER-REVIEWED | Posted: 22 February 2021                          doi:10.20944/preprints202102.0464.v1

                          Table 3: Stanines for the body composition of outfield female football players
                                                                   LOW                                                  AVERAGE                                                   HIGH

                                                Extremely low     Very Low          Low          Below average          Average          Above average           High          Very high          Extremely high

                           Sum of 6 skinfolds              46,5              58,9         67,2                   77,4             98,1                   121,2          145,8              163,2

                           Fat%                            12,9              14,5         16,1                   17,6             20,8                    24,4          28,7               31,6

                           Fat kg                           6,2               7,1         8,1                    9,2              11,5                    15,1          18,4               23,6

                           Muscle mass (kg)                18,2              18,9         19.4                   20,6             21,3                    22,1          23,7               26,1

                           Muscle mass%                    32,8              34,4         36,1                   37,7             38,6                    39,9          41,3               42,5

                           Skeletal mass (kg)               5,5               5,8         6,2                    6 ,4             6,8                      7,4          7,7                8,4

                           Skeletal mass %                  9,8              10,7         11,0                   11,9             12,5                    13,1          13,8               14,3
Preprints (www.preprints.org) | NOT PEER-REVIEWED | Posted: 22 February 2021 doi:10.20944/preprints202102.0464.v1
4. Discussion
The primary aim of this article was to examine if there are position-specific differences
in the morphological characteristics of South African sub-elite female football players.
A secondary aim was to utilise the morphological characteristics of South African sub-
elite female football players to establish normative standards for this level of female
football players. Adding to the uniqueness of this study is the large sample size in
comparison to most other studies on female football players, cited in this paper. The
main finding of this study was that the biggest differences (statistically and practi-
cally) were between goalkeepers and outfield players, with limited differences be-
tween the outfield positions.
Height and body mass values of the current study were found to be comparable with
values reported for elite Spanish [4] and sub-elite Japanese [7] female football players.
However, most previous research on female football players reported considerably
higher values for standing height and body mass among both sub-elite [9, 14] and
elite female players [10, 11]. Height is regarded as a decisive factor in the selection
process in football and is considered favorable for goalkeepers when defending a goal
[13]. Similar to other studies [10, 14, 28], goalkeepers were taller than the outfield
players, with results being significantly different (p < 0.02) compared to midfielders
and defenders. None of the outfield playing positions differed (p > 0.05) from one
another in terms of height. However, like previous studies [3, 4, 13, 14], midfielders
were the shortest players, whilst the height of forwards and defenders were alike. It
would be expected that the height of forwards would be similar to defenders, due to
the direct influence it would have in duels when jumping in front of the goalposts
[29]. The height values were partly accompanied by the higher total body mass values,
leading to goalkeepers being the heaviest and midfielders the lightest, thus support-
ing previous findings in literature [12, 13]. The heavier body mass often observed in
goalkeepers is presumably because endurance is less important for goalkeepers than
for outfield players [15]. Various skeletal measurements should also be considered.
Skeletal breadth, girth, length and skinfold measurements of the players in the current
study were comparable with other female football players on sub-elite and elite level,
although available literature is very limited for all levels of participation [1, 4, 13, 20,
30]. Results from the current study were either similar (thigh girth and humerus,
wrist, femur and ankle breadth) or lower (relaxed arm, flexed arm and waist and calf
girth) than previous reports [1, 13, 31]. Upper limb skeletal length for players were
longer than those in previous reports but cannot be directly related since this study
made use of three measurements (mean acromiale-radiale, mean radiale-stylion and
mean midstylion-dactylion) in comparison to the single measurement used for arm
length in previous reports [1, 13, 31].
Differences (p ≤ 0.05) were found between playing positions in the mean breadth
measurements of the wrist, femur and ankle and the mean girth measurements of the
relaxed arm, flexed arm, waist, gluteus and medial calf. Goalkeepers had larger (p ≤
0.05) wrist breadth measurements compared to midfielders and defenders and larger
femur breadth measurements compared to forwards (p = 0.02) and midfielders (p =
0.003). A previous study on female players also reported the largest breadth measure-
ments among goalkeepers [13]. The forwards had the smallest humerus and ankle
breadth measurements, followed by the midfielders who again had the smallest wrist
and femur breadth measurements. In terms of girth measurements, differences (p ≤
0.05) were found between goalkeepers and the other three positional groups, with the
largest measurements being noted among goalkeepers. Midfielders possessed the
smallest mean results for the majority of girths measured, which concurs with previ-
ous studies [13]. Due to limited data being available on female players, comparisonsPreprints (www.preprints.org) | NOT PEER-REVIEWED | Posted: 22 February 2021 doi:10.20944/preprints202102.0464.v1
to other studies are problematic, but from these results it is clear that goalkeepers have
wider bone girths compared to the outfield players.
Players in different positions further varied (p ≤ 0.05) in terms of their mean length
measurements. Goalkeepers had longer (p ≤ 0.05) acromiale-radiale length measure-
ments than midfielders and defenders and longer (p ≤ 0.01) radiale-stylion length
measurements compared to all outfield positions, thus agreeing with previous reports
[13]. This particular body type contributes to the self-confidence of goalkeepers in
performing their tasks of covering the broad area between the goalposts [29]. Once
again, the midfielders had the shortest arm and hand lengths, as previously reported
[13]. Furthermore, goalkeepers had larger hands (p ≤ 0.01) and longer feet (p ≤ 0.05)
than midfielders and defenders. In considering standing height and body mass values
of the different playing positions, it was not unexpected that the shorter and lighter
midfielders generally possessed the smallest skeletal breadth, girth and length meas-
urements. In addition the largest measurements, accompanying the tallest and heav-
iest values, were established among the goalkeepers.
Skinfold and body fat measurements are major contributing factors for determining a
player’s body composition. Although a certain amount of body fat is important for
the maintenance of body metabolism, it is believed that excess adiposity negatively
influences football performance [32, 33]. The sum of the skinfolds can be used to de-
termine adiposity and to provide detail regarding local fat depots and fat distribution
in the body [34]. The average of the sum of six skinfolds was considerably higher than
that previously reported [30] for elite female players and was more in agreement with
the values reported for junior female players. No statistical difference was found be-
tween the different playing positions, however effect sizes indicated again that large
differences existed between goalkeepers and outfield players, with goalkeepers hav-
ing higher values in the sum of skinfolds. The body fat mass and mean BF% of the
players were within the ranges previously reported for female players [4, 7, 9]. Higher
muscle mass values than reported in this study were observed for sub elite and elite
Spanish female players [4]. Differences were noted between the different playing po-
sitions concerning the muscle mass (p < 0.01), skeletal mass (p < 0.01) and fat mass (p
< 0.05) values when goalkeepers were compared to the outfield positions. No differ-
ences were observed when the outfield positions were compared with one another.
The higher BF% values found among goalkeepers could be attributed to their specific
positional requirements of being steadier throughout the game and less mobile. This
is in comparison to other playing positions that require the players to be more ma-
neuverable and to cover a greater distance throughout a match, which could explain
the lower BF% measured among them. Forwards and defenders, however, had simi-
lar BF% values compared to midfielders, indicating that BF% was not a distinguishing
factor among outfield positions. This agrees with results previously reported for elite
Japanese female players [7] and elite and sub-elite Spanish [4] female players.
Finally, somatotype is a useful unit of measure that highlights the overall health status
of individuals [35]. In football, the mesomorphic component (strength indicator) to-
gether with a prevalence of ectomorphic components is considered optimal for per-
formance [20]. Therefore, an ectomorphic mesomorph body type is more desirable for
performance in football as the sport requires speed, endurance and muscle power
[20]. Although there is a shortage of studies describing the somatotype of female foot-
ball players, the majority reported an endomorphic mesomorph body type [20, 22, 31],
with one study reporting a mesomorphic endomorph body type [9]. The players in
this study demonstrated a balanced endomorph body type. This can be translated into
an average value for the endomorphic component and low values for both the meso-
morphic and ectomorphic components, indicating that on average, the players had a
shorter body type and less muscular characteristics compared to previously reportedPreprints (www.preprints.org) | NOT PEER-REVIEWED | Posted: 22 February 2021 doi:10.20944/preprints202102.0464.v1
results. None of the positional groups differed in somatotype characteristics. Com-
parisons to other studies regarding somatotype characteristics according to playing
position could, however, not be made since such analyses have not been conducted
previously.
5. Conclusions
This study provides valuable information concerning the morphological profile
of sub-elite female football players in accordance with playing position. The results of
the present study show heterogeneity among outfield playing positions and suggest
that goalkeepers differ in morphological characteristics compared to outfield players.
The results support previous research in that players in defensive positions tend to be
among the taller players, which could be advantageous in performing actions such as
jumping to gain possession of the ball and defending the goalpost. Midfielders are
likely to be the shortest and lightest players in a team, lending them the advantage of
being more maneuverable across the field. The inclination of the endomorphic com-
ponent may be viewed as an indication of undertraining. Finally, the stanine provided
for outfield players provide guidelines for body composition and contribute towards
normative data within an area characterized by a rarity of information.
Author Contributions: Conceptualization, M.S. and C.P.; methodology, validation, A.A, M.S
and C.P.; formal analysis, A.S, M.S.; writing—original draft preparation, A.S.; writing—review
and editing, M.S and C.P.; visualization, M.S; supervision, M.S and C.P.; project administration,
M.S and C.P..; funding acquisition, A.S. All authors have read and agreed to the published
version of the manuscript.
Funding: This work is based on the research supported in part by the Tshwane University of
Technology, South Africa through the Department of Higher Education and Training Research
Development Grant.
Institutional Review Board Statement: The study was conducted according to the guidelines
of the Declaration of Helsinki, and approved by the Institutional Review Board (or Ethics Com-
mittee) of North-West University (NWU-00055-15-A1)
Informed Consent Statement: Informed consent was obtained from all subjects involved in the
study.
Data Availability Statement: According to the approval from the Health Research Ethics com-
mittees, the data are to be stored properly and in line with the South African Law of privacy
protection. Public availability would compromise privacy of the respondents. However, anon-
ymized data are available to interested researchers upon request, pending ethical approval
from our Ethics committee. Interested researchers can contact project leader Martinique Sparks
(martinique.sparks@nwu.ac.za) with requests for the data underlying our findings.
Acknowledgments: The authors wish to express their gratitude towards the players, coaches
and team managers for their dedication and enthusiastic participation in the study.
Conflicts of Interest: The authors declare no conflict of interest.
References
1. Jelaska, P. M.; Erceg, M.; Jelaska, I. Canonical relations between sport-specific and morphological status among first league
female soccer players. Facta Universitatis, Series: Physic Edu Sport, 2015, 67-74.
2. Erceg, M.; Milić, M.; Sivrić, H.; Košta, A.A. Correlation between morphological characteristics and motor abilities in young
Croatian soccer players. Res Physic Edu, Sport Health, 2014, 3(1), 51-56.
3. Dillern, T.; Ingebrigtsen, J.; Shalfawi, S.A. Aerobic capacity and anthropometric characteristics of elite-recruit female soccer
players. Serbian J Sports Sci, 2012, 6(2), 43-49.
4. Sedano, S.; Vaeyens, R.; Philippaerts, R.M.; Redondo, J.C.; Cuadrado, G. Anthropometric and anaerobic fitness profile of
elite and non-elite female soccer players. J Sports Med Physic Fitn, 2009, 49(4), 387-394.
5. Hazir, T. Physical characteristics and somatotype of soccer players according to playing level and position. J Hum Kinetics,
2010, 26, 83-95. https://doi.org/ 10.2478/v10078-010-0052-zPreprints (www.preprints.org) | NOT PEER-REVIEWED | Posted: 22 February 2021 doi:10.20944/preprints202102.0464.v1
6. Gardasevic, J.; Bjelica, D. Body composition differences between football players of the three top football clubs. Int J Mor-
phol, 2020, 38(1):153-158.
7. Hasegawa, N.; Kuzuhara, K. Physical Characteristics of Collegiate Women’s Football Players. Football Sci, 2015, 12, 51-57.
8. Mala, L.; Maly, T.; Zahalka, F.; Bunc, V.; Kaplan, A.; Jebavy, R.; Tuma, M. Body composition of elite female players in five
different sports games. J Hum Kinetics, 2015, 45, 207-215. https://doi.org/10.1515/hukin-2015-0021.
9. Nikolaidis, P.T. Weight status and physical fitness in female soccer players: is there an optimal BMI? Sport Sci Health, 2014,
10(1), 41-48. https://doi.org/10.1007/s11332-014-0172-2.
10. Milanovic, Z.; Sporis, G.; Trajkovic, N. Differences in body composite and physical match performance in female soccer
players according to team position. J Hum Sport Exerc, 2012, 7(1Proc), S67-S72. https://doi.org/10.4100/jhse.2012.7.Proc1.08
11. Sporis, G.; Jovanovic, M.; Krakan, I.; Fiorentini, F. Effects of strength training on aerobic and anaerobic power in female
soccer players. Sport Sci, 2011, 4(2), 32-37.
12. Haugen, T. A.; Tonnessen, E.; Seiler, S. Speed and countermovement-jump characteristics of elite female soccer players,
1995-2010. Int J Sports Physiol Perform, 2012, 7(4), 340-349. https://doi.org/10.1123/ijspp.7.4.340.
13. Sporis, G.; Canaki, M.; Barisic, V. Morphological differences of elite Croatian female soccer players according to team po-
sition. Croatian Sports Med J, 2007, 22(2), 91-96.
14. Vescovi, J.D.; Brown, T.D.; Murray, T.M. Positional characteristics of physical performance in Division I college female
soccer players. J Sports Med Physi Fitn, 2006, 46(2), 221-226.
15. Rogan, S.; Hilfiker, R.; Clarys, P.; Clijsen, R.; Taeymansa, J. Position-specific and team-ranking-related morphological char-
acteristics in German amateur soccer players-a descriptive study. Int J Appl Sports Sci, 2011, 23(1), 168-182.
16. Dey, S.K.; Kar, N.; Debray, P. Anthropometric, motor ability and physiological profiles of Indian national club footballers:
A comparative study. S Afr J Res Sport, Physic Edu Rec, 2010, 32(1), 43-56.
17. Noh, J.W.; Kim, M.Y.; Lee, L.K.; Park, B.S.; Yang, S.M.; Jeon, H.J.; Lee, W.D.; Kim, J.H.; Lee, J.U.; Kwak, T.Y.; Lee, T.H.; Kim,
J.U.; Kim, J. Somatotype and body composition analysis of Korean youth soccer players according to playing position for
sports physiotherapy research. J Physic Ther Sci, 2015, 27(4), 1013. https://doi.org/10.1589/jpts.27.1013.
18. Carter, J.L.; Heath, B.H. Somatotyping: development and applications, Vol. 5; Cambridge University Press, UK, 1990.
19. Gil, S.M.; Gil, J.; Ruiz, F.; Irazusta, A.; Irazusta, J. Physiological and anthropometric characteristics of young soccer players
according to their playing position: relevance for the selection process. J Strength Cond Res, 2007, 21(2), 438-445.
https://doi.org/10.1519/r-19995.1.
20. Adhikari, A.; Nugent, J. Anthropometric characteristic, body composition and somatotype of Canadian female soccer play-
ers. Am J Sports Sci, 2014, 2(6-1), 14-8. https://doi.org/10.12691/ajssm-3 -2
21. Stewart, A.; Marfell-Jones, M.; Olds, T.; de Ridder, H. International standards for anthropometric assessment (ISAK). Lower
Hutt, New Zealand, 2011.
22. Withers, R.T.; Whittingham, N.O.; Norton, K.I.; Dutton, M. Somatotypes of South Australian female games players. Hum
Biol, 1987, 59(4), 575-584.
23. Lee, R.C.; Wang, Z.; Heo, M.; Ross, R.; Janssen, I.; Heymsfield, S.B. Total-body skeletal muscle mass: development and
cross-validation of anthropometric prediction models. Am J Clinic Nutr, 2000, 72(3), 796-803.
24. Martin, A.D.; Spenst, L.F.; Drinkwater, D.T.; Clarys, J.P. Anthropometric estimation of muscle mass in men. Med Sci Sports
Exerc, 1990, 22(5), 729-733. https://doi.org/ 10.1249/00005768-199010000-00027
25. Pederson, D.; Gore, C. Anthropometry measurement error, Sydney: University of New South Wales Press, 1996.
26. Batterham, A.M.; Hopkins, W.G. Making meaningful inferences about magnitudes. Int J Sports Physiol Perf, 2006, 1(1), 50-
57. https://doi.org/10.1123/ijspp.1.1.50
27. Hopkins, K.; Stanley, J. Educational and psychological measurement and evaluation, 6th ed., Prentice Hall, Engelwoord, 1981.
28. Haugen, T.A.; Tonnessen, E.; Hem, E.; Leirstein, S.; Seiler, S. VO2max Characteristics of Elite Female Soccer Players, 1989-
2007. Int J Sports Physiol Perform, 2014, 9(3), 515-521. https://doi.org/10.1123/ijspp.2012-0150
29. Matković, R.B.; Mišigoj-Duraković, M.; Matković, B.; Janković, S.; Ružić, L.; Leko, G.; Kondrič, M. Morphological differ-
ences of elite Croatian soccer players according to the team position. Collegium antropologicum, 2003, 27(1), 167-174.
30. Mujika, I.; Santisteban, J.; Impellizzeri, F.M.; Castagna, C. Fitness determinants of success in men's and women's football. J
Sports Sci, 2009, 27(2), 107-114. doi:10.1080/02640410802428071
31. Can, F.; Yilmaz, I.; Erden, Z. Morphological characteristics and performance variables of women soccer players. J Strength
Cond Res, 2004, 18(3), 480-485. https://doi.org/ 10.1519/00124278-200408000-00015.
32. Anwar, S.; Noohu, M.M. Correlation of percentage body fat and muscle mass with anaerobic an aerobic performance in
collegiate soccer players. Indian J Physio. Pharmacol, 2016, 60, 137-144.
33. Slimani, M.; Znazen, H.; Hammami, A.; Bragazzi, N.L. Comparison of body fat percentage of male soccer players of differ-
ent competitive levels, playing position and age groups: a meta-analysis. J Sports Med Physic Fitn, 2017, 58(6):857-866.
https://doi.org/ 10.23736/S0022-4707.17.07941-5.
34. Garrido-Chamorro, R.; Sirvent-Belando, J.; González-Lorenzo, M.; Blasco-Lafarga, C.; Roche, E. Skinfold sum: reference
values for top athletes. Int J Morphol, 2012, 30(3), 803-809.
35. Ochoa Martínez, P.Y.; Hall López, J.A.; Alarcón Meza, E.I.; Millán, A.; Manuel, E.; Sánchez León, R. Somatotype profile and
body composition of players from the Mexican professional basketball league. Int J Morph, 2014, 32(3).You can also read