Competition with insectivorous ants as a contributor to low songbird diversity at low elevations in the eastern Himalaya - Authorea
←
→
Page content transcription
If your browser does not render page correctly, please read the page content below
Competition with insectivorous ants as a contributor to low
songbird diversity at low elevations in the eastern Himalaya.
K. Supriya1 , Trevor Price2 , and Corrie Moreau3
1
Arizona State University
2
University of Chicago
3
Cornell University
May 5, 2020
Abstract
Posted on Authorea 10 Feb 2020 — CC BY 4.0 — https://doi.org/10.22541/au.158137036.64067629 — This a preprint and has not been peer reviewed. Data may be preliminary.
Competitive interactions between distantly related clades could cause complementary diversity patterns of these clades over
large spatial scales. One such example might be ants and birds in the eastern Himalaya; ants are very common at low elevations
but almost absent at mid-elevations where the abundance of other arthropods and insectivorous bird diversity peaks. Here, we
ask if ants at low elevations could compete with birds for arthropod prey. Specifically, we studied the impact of the Asian weaver
ant (Oecophylla smaragdina), a common aggressive ant at low elevations. Diet analysis using molecular methods demonstrate
extensive diet overlap between weaver ants and songbirds at both low and mid-elevations. Trees without weaver ants have
greater non-ant arthropod abundance and leaf damage. Experimental removal of weaver ants results in an increase in the
abundance of non-ant arthropods. Notably, numbers of Coleoptera and Lepidoptera were most affected by removal experiments
and were prominent components of both bird and weaver ant diets. Our results suggest that songbirds and weaver ants might
potentially compete with each other for arthropod prey at low elevations, thereby contributing to lower insectivorous bird
diversity at low elevations in eastern Himalaya. Competition with ants may shape vertebrate diversity patterns across broad
biodiversity gradients.
Introduction
Biotic interactions such as mutualism, commensalism, competition and predation, affect diversity and dis-
tribution of species at different scales in different ways (Schemske et al. 2009; Wisz et al. 2013; Araújo
and Rozenfeld 2014; Lany et al. 2018; Nelsen et al. 2018). While the role of these interactions in shaping
large-scale biodiversity patterns is often acknowledged, it is rarely tested (Schemske et al. 2009; McCain and
Grytnes 2010; Wisz et al. 2013). This paucity of studies may be attributed to the fact that biotic interac-
tions are often difficult to quantify (McCain and Grytnes 2010) and that cause and effect can be difficult
to distinguish in the relationship between biotic interactions and species diversity (Fischer 1960; Schemske
et al. 2009). However, there is a growing need to study the role of these interactions in shaping diversity
patterns in the light of predicted shifts in species ranges due to climate change (Blois et al. 2013; Wisz et al.
2013; Valiente-Banuet et al. 2015; Anderson 2017; Gavish et al. 2017), especially as the strength and effects
of these interactions are themselves susceptible to climate change (Tylianakis et al. 2008; Faldyn et al. 2018).
One of the key biotic interactions that can influence diversity patterns in various ways is competition.
Competition may reduce diversity by competitive exclusion (Goldberg and Barton 1992; Valone and Brown
1995) or enhance diversity through increasing specialization of species (Abbott et al. 1977; Futuyma and
Moreno 1988; Emerson and Kolm 2005). Closely related taxa often compete for similar resources and these
competitive interactions can influence range limits of these taxa (Terborgh and Weske 1975; Jankowski et
al. 2010; Pasch et al. 2013). However, interactions between distantly related taxa also have major impacts
1on diversity patterns. Although a few studies have demonstrated competition between distantly related taxa
(Brown and Davidson 1977; Eriksson 1979; Palmeirim et al. 1989; Hochberg and Lawton 1990; Jennings et
al. 2010) and the effect of competition between distantly related taxa on diversity patterns has been inferred
from the fossil record (Jablonski 2008), this subject has not received much attention in macroecology. In
fact, the presence of closely related species in a community has been used as evidence against the role of
competition, emphasizing instead abiotic filtering (Webb et al. 2002; Gómez Juan Pablo et al. 2010; Tucker
et al. 2017). However, recent advances in ecological coexistence theory imply that strong differences in
competitive ability between distantly related competitors could cause competitive exclusion even if niches
are substantially different (Chesson 2000; Mayfield and Levine 2010; Gerhold Pille et al. 2015). Indeed, many
empirical studies support this model for ecological coexistence (Venail et al. 2014; Germain Rachel M. et al.
2016).
Here, we present observational and experimental evidence that suggests a role for ecological competition
between two distantly related clades in shaping their complementary diversity patterns: songbirds (Phylum
Chordata, Class Aves, Subfamily Oscines) and ants (Phylum Arthropoda, Class Insecta, Family Formicidae).
While several studies have presented evidence for competition or amensalism between ants and birds (Sup-
plementary table S1), they have not assessed the effect of these interactions on patterns of species diversity.
Ants are important predators of other arthropods, especially in tropical and sub-tropical lowland forests
(Floren et al. 2002; Sam et al. 2014). They have been experimentally shown to reduce numbers of other
Posted on Authorea 10 Feb 2020 — CC BY 4.0 — https://doi.org/10.22541/au.158137036.64067629 — This a preprint and has not been peer reviewed. Data may be preliminary.
arthropods (Piñol et al. 2010; Karban et al. 2017). However, ants are absent or in very low in abundance in
tropical and sub-tropical montane cloud forests across the world, for reasons that remain unclear (Janzen
1973; Samson et al. 1997; Longino et al. 2014). The elevation at which cloud forests are found varies with
latitude and other geographic factors, but the lower elevational limit usually lies between 1500m-2500 m and
upper limit ranges from 2400m-3300m (Stadtmüller 1987). One possible explanation is that ground-nesting
ants cannot persist in places that are wet throughout the year whereas arboreal nesting ants cannot survive
freezing temperatures (Wheeler 1917; Janzen 1973; Samson et al. 1997). On the other hand, although capable
of living at low and higher elevations, carabid beetles (Wilson 1987; Maveety et al. 2013), songbirds (Price
et al. 2014) and small mammals (Heaney 2001) are often very diverse and abundant in these cloud forests.
One mechanism for this diversity and abundance maxima in cloud forests could be the lack of competition
with ants for arthropod prey (Heaney 2001; Price et al. 2014). We investigated this hypothesis in the eastern
Himalaya.
In the eastern Himalaya, breeding songbird diversity peaks in the cloud forests at elevations between 1200m
and 2000m. Various historical and dispersal hypotheses, including greater area, dispersal from both above
and below, and greater time for diversification at mid-elevations (associated with climatic niche conservation)
have little support as an explanation for the mid-elevation peak in bird diversity (Price et al. 2014). The peak
consists largely of small insectivorous bird species and is associated with greater resource (i.e. arthropod)
abundance, potentially supporting more individuals and hence, more species (Price et al. 2014; Schumm et al.
2019) (Fig. 1, Fig. S1 and Fig. S2). By contrast, ants are almost absent in the cloud forests at mid-elevations,
even though they are highly abundant and diverse at the low elevations (Fig. 1, Fig. S1 and Fig. S2) (Ghosh-
Harihar 2013; Price et al. 2014). Among ants, low elevations are dominated by an arboreal insectivorous
species, the Asian weaver ant Oecophylla smaragdina which disappears at about 900m elevation (K. Supriya
pers. obs.). Weaver ants forage both on the trees and on the ground, move between trees through canopy
connections and are highly aggressive (Basu 1997; Peng and Christian 2005; Van Mele 2008). We evaluated
the possibility that the dominance of weaver ants at low elevations contributes to the lower diversity of birds
at these elevations due to competition for food resources.
To test whether weaver ants and birds might compete for resources at the low elevation, we first assessed if
there is dietary overlap between weaver ants and birds. A necessary pre-condition for competition between
two taxa is significant overlap in the use of the same limiting resource (Brown and Davidson 1977). Previous
research suggests that arthropods are a limiting resource for songbirds in the eastern Himalaya (Price et al.
2014) (also see Fig.1 and Fig. S2). Here, we compared the diet of weaver ants and birds at the low elevation
where they co-occur, and at higher elevations where weaver ants are absent, to assess dietary overlap. Next,
2we compared arthropod abundance and leaf damage due to insect herbivory on trees with and without weaver
ants and conducted a weaver ant removal and exclusion experiment using a paired design to assess whether
weaver ants significantly reduce arthropod abundance on trees.
Methods
Study sites All fieldwork was conducted over April-June of 2014-2016. Ants and birds were studied at
the moist subtropical broadleaved forests at low elevations in Chapramari Wildlife Sanctuary (26.8858°N,
88.8341°E, ˜ 200m) in West Bengal, India. Bird diets were studied at Chapramari and in the temperate
broadleaved cloud forests at the mid-elevation site of Neora Valley National Park (27.0611°N, 88.7707°E,
˜ 2000m) in West Bengal. Bird diets were also studied at 1200m elevation in Neora Valley National Park
(27.03°N, 88.78°E) and at 2300m (27.42°N, 88.20°E), 2700m (27.43°N, 88.19°E), 3200m (27.45°N, 88.17°E)
elevations in Khangchendzonga National Park in Sikkim, India.
Molecular diet analysis
Field and lab methods To examine bird diets, between April-June 2016 we caught 103 birds and successfully
collected 41 faecal samples at 200m and 2000m elevations at the Bengal sites (Supplementary table S2). We
caught an additional 107 birds and collected 82 faecal samples at 1200m, 2300m, 2700m and 3200m elevations
in May 2017. All faecal samples were stored in 95% ethanol until DNA extraction. We used Qiagen QIAamp
Posted on Authorea 10 Feb 2020 — CC BY 4.0 — https://doi.org/10.22541/au.158137036.64067629 — This a preprint and has not been peer reviewed. Data may be preliminary.
DNA Stool Mini kit to extract DNA with some minor modifications in the protocol, following Zeale et al.
(2011).
To examine weaver ant diet, we collected items of food that the weaver ants were carrying to their nest
between April-June 2016. We collected food items from 25 different colonies, either for an hour or until we
had collected 10 items, whichever happened first. We extracted DNA from these samples by taking a small
part of each of the prey items, crushing it and then using the Qiagen DNeasy blood and tissue kit and following
the manufacturer’s protocol for DNA extraction. We carried out a 25μL PCR (polymerase chain reaction) to
amplify a segment of 16S rDNA using the lns16S-short primer pair (5’-3’ TRRGACGAGAAGACCCTATA;
ACGCTGTTATCCCTAAGGTA) described by Clarke et al. (2014). We used this primer set because it is
invertebrate specific, so successful DNA amplification indicates presence of prey DNA in the bird faecal DNA
extract. We sent successful PCR products to the Sequencing core at the University of Illinois at Chicago,
Chicago, Illinois, for barcoding, pooling, size selection and sequencing on an Illumina Miniseq platform. All
PCR products had strong primer dimer bands that were removed at the sequencing core before sequencing
with a procedure that selected for fragments longer than 150 bp. (see Supplementary methods for further
details)
Data analysis We followed the dada2 pipeline (Callahan et al. 2016) to construct an amplicon sequence
variant (ASV) table and then created a FASTA file with all the unique sequences recovered from our samples.
We used blastn in blastplus to BLAST this FASTA file against the NCBI nr database and used the NCBI-
taxcollector script (Dias et al. 2014) to get detailed taxonomic information for the top hit of our BLAST
results. After filtering out bacteria and other contaminating sequences, we estimated overlap between the
diets of weaver ants and birds at low and mid-elevations at various taxonomic levels using EcoSimR (Gotelli
et al. 2015) and visualized the overlap using venn diagrams and non-metric multidimensional scaling (NMDS)
in R (R Core Team 2014). EcoSim R is used to estimate niche overlap between species and compare it to
a null distribution of niche overlap given information on resource utilization (in columns) by each species
(rows). The algorithm randomizes resource utilization for each species by reshuffling the row values and
generates a null distribution of niche overlap. In our case, we considered birds at low elevations (N = 18),
birds at middle elevations (N = 15) and weaver ants (N = 25) at low elevations as “species” and used the
frequency of occurrence of different orders or families in diets as the “resources”. All the analyses were
done in the R programming environment and in the shell using the R packages dada2 (Callahan et al.
2016), DECIPHER (Wright 2016), VennDiagram (Chen and Boutros 2011), ggplot2 (Wickham 2011), vegan
(Oksanen et al. 2018) and EcoSimR (Gotelli et al. 2015). All scripts and details of the steps are available
as supplements to this paper.
3Effect of weaver ants on arthropod abundance
Field Methods In June 2014 and May 2015, we measured arthropod abundance at 17 pairs of trees with
weaver ants present and trees without weaver ants, where the trees were paired by species, height and girth.
To measure arthropod abundance, we beat the foliage of a tree with a stick, and collected all the insects that
fell on an upturned umbrella ([?] 100cm diameter), which is similar to the method used by Piñol et al. (2012).
We beat the foliage three times before collecting arthropods in vials containing 95% ethanol and repeated
the process at another part of the tree. Later in the field camp, we counted all the collected arthropods,
measured body length to the nearest mm, and classified them to taxonomic order. To control for observer
bias, the person counting the arthropods was unaware of the presence or absence of weaver ants on the
source tree. We also estimated leaf damage on the pairs of trees as a longer-term proxy of insect herbivore
abundance, with greater arthropod abundance implied by higher leaf damage. We used two methods to assess
leaf damage: (1) visual estimation of % absent on 10 leaves from different parts of each tree, and (2) visual
estimation of % absent on each leaf on a short (˜0.5m) clipped branch of the tree.
In April-June 2015 we carried out a weaver ant removal and exclusion experiment using 15 pairs of trees,
paired by species, height and girth. On trees in the experimental treatment group, we removed all weaver
ant nests using a tree pruner and then applied a band of TanglefootTM around the trunk of the tree at about
1 m height from the base of the tree. We plugged all the holes in the trunk crevices under the Tanglefoot
Posted on Authorea 10 Feb 2020 — CC BY 4.0 — https://doi.org/10.22541/au.158137036.64067629 — This a preprint and has not been peer reviewed. Data may be preliminary.
band with cotton. We were unable to completely remove or exclude weaver ants from 6 out of 15 treatment
trees because of the nature of the bark of the tree trunk or the canopy of the tree. On trees receiving
the control treatment, we attached a band of brown paper to make them appear similar to trees receiving
the experimental treatment and pruned a few branches to mimic the disturbance caused by the removal of
weaver ant nests. We measured arthropod abundance at each of these trees using beating and branch-clipping
(Ozanne 2005) before and one month after the experimental treatments. We also recorded leaf damage as an
index of insect herbivory on the clipped branch and on 16 random leaves at each tree. We recorded arthropod
abundances one year later in April-June 2016, but by that time a number of trees had gained or lost weaver
ants to an uncertain degree; results are presented in the supplement.
Data analysis We used paired t-tests to compare arthropod abundance and leaf damage between trees with
or without weaver ants. Arthropod abundance data were log-transformed with one added to all values to
avoid zeroes in the data. We also used paired t-tests to compare the change in arthropod abundance and
leaf damage over the period of one month and over the period of one year between trees in the weaver ant
exclusion and control treatments. Since we were interested in the effect of weaver ants on other arthropods, we
removed the number of all ants from our arthropod count. We also removed the number of insects belonging
to the suborder Homoptera, because weaver ants form mutualistic associations with Homopterans (Peng and
Christian 2005; Crozier et al. 2009). All analyses were done in the RStudio programming environment (R
Core Team 2014).
Results
Molecular diet analysis Of the 41 faecal samples collected at 200m and 2000m elevations, we were able to
amplify and sequence prey DNA from 33 samples in total, from five bird species at low-elevations and nine
different bird species at mid-elevations (Supplementary table S2) and all 25 weaver ant food samples. We
were also able to amplify and sequence prey DNA from 36 additional bird faecal samples at higher elevations
in Sikkim and 2 additional samples at 1200m elevation. Even though the primer set we used was supposed
to be invertebrate-specific, it amplified some vertebrate taxa such as Squamata as well (Supplementary table
S3). We recovered 1331 amplicon sequence variants (ASVs) from the dada2 pipeline. Of these, 1072 sequences
yielded BLAST matches which reduced to 980 sequences after filtering for bacteria and contaminants (162
from birds at the 200m elevation, 224 from birds at the 2000m elevation, 325 from weaver ants and 333 from
birds at 1200m, 2300m, 2700m and 3200m elevations; note that this is greater than 980 because of overlap
in ASVs among these groups).
The most frequent orders in the bird diet at all elevations were Lepidoptera and Coleoptera (Fig. S3 &
4Supplementary table S3). At 200m, Lepidoptera was detected in 94% and Coleoptera in 88% of the samples.
Molecular diet analyses confirmed that Lepidoptera (69%) and Coleoptera (48%) are common in weaver
ant diet, in addition to Blattodea, Hemiptera and Hymenoptera (all 61%). Each of the orders present in
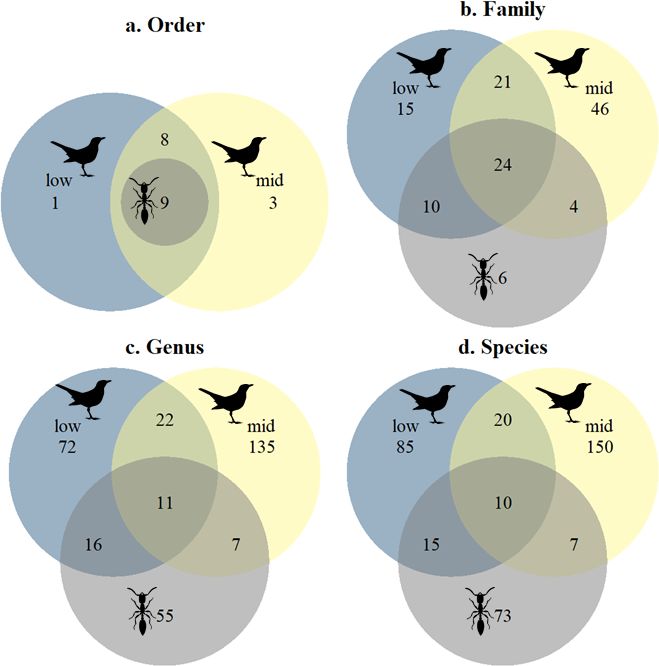
weaver ant diet was also found in bird diets (Fig. 2 & Fig. S4, Supplementary tables S3-S6) but birds had
consumed animals in nine additional orders. These included larger animals such as centipedes (order Sco-
lopendromorpha, 33%), annelids (order Haplotaxida, 11%), molluscs (class Gastropoda, 5.5%) and lizards
(order Squamata, 5.5%) as well as some small arthropods such as springtails (order Entomobryomorpha,
11%), stoneflies (Plecoptera, 22%), booklice (Psocoptera, 5%), thrips (Thysanoptera, 5%) and earwigs (Der-
maptera, 11%). At elevations between 2000m and 3200m (where weaver ants are absent), we identified all
but one of the 18 orders present at the low elevation, plus three more [lacewings (order Neuroptera, 44%),
nemertean worms (order Monostilifera, 6%) and mayflies (order Ephemeroptera, 6%)].
Our EcoSimR results showed that the diets of birds at low elevations and weaver ants overlapped significantly
more than expected from random resource utilization at all taxonomic levels, albeit not at the ASV level.
Diet of birds from low and mid-elevations overlapped significantly at order, family and ASV levels. Diet of
birds from mid-elevations and the diet of low elevation weaver ants (weaver ants are absent at mid-elevation)
did not overlap significantly at finer taxonomic scales (Supplementary Table S7). Lower diet overlap at finer
taxonomic scales could be a function of sampling as indicated by the absence of asymptote in accumulation
curves at finer taxonomic levels (Fig. S5) or the difference in arthropod species across the elevational gradient.
Posted on Authorea 10 Feb 2020 — CC BY 4.0 — https://doi.org/10.22541/au.158137036.64067629 — This a preprint and has not been peer reviewed. Data may be preliminary.
Effect of weaver ants on arthropod abundance We found no significant difference between number of
arthropods on trees with or without weaver ants (Fig. S6a). However, the number of insects belonging to
orders Coleoptera and Lepidoptera, the two most common orders in bird diet at all elevations, was 1.7 x
higher on trees without weaver ants than on trees with weaver ants (Fig. 3a). Leaf damage estimated from
10 leaves on each tree was significantly greater on trees without weaver ants than on trees with weaver ants
(Fig. 3b) and showed a non-significant trend in the same direction on the clipped branches from these trees
(Fig. S6b).
Weaver ant removal and exclusion experiment One month after weaver ant removals and exclusion,
the numbers of arthropods(excluding ants and homopterans) had increased from 4.67 ± 0.95 SE to 12.73
± 1.26 SE, N = 15, while controls showed no significant change (before: 7.73 ± 1.06 SE, after one month:
9.8 ± 1.51 SE, N = 15). Overall, the difference between the change over time in treatment and control trees
was significant (paired t-test, N = 15, P = 0.018) (Fig. 4). In the following year, the increase in number
of arthropods on treatment trees was greater than control trees, but the difference was not statistically
significant (Figs. S7, S8). Some of the experimental trees had been recolonized by ants over the course of the
year, which might contribute to the reduced effect (Figs. S7, S8).
In the experimental treatments, two taxonomic orders of insects were responsible for the increase on experi-
mental trees with respect to controls (Fig. 5a). Lepidoptera increased significantly in abundance (Lepidoptera:
treatment 1.0 ± 0.5 SE, control -0.5 ± 0.3 SE, N=15, paired t-test P = 0.01) and Coleoptera showed a large
increase that was close to significance (treatment 1.3 ± 0.9 SE, control -0.3 ± 0.4 SE, P = 0.13). These orders
are also the most frequent components of bird diets at all elevations (Fig. 5b & Fig. S3). On the other hand,
Hemiptera decreased after weaver ant exclusion (paired t-test N=15; treatment -8.8 ± 5.5 SE, control 4.3
± 4.9 SE, P = 0.09). This decrease is expected given that it contains the suborder Homoptera and weaver
ants form mutualistic associations with Homopterans (Peng and Christian 2005; Crozier et al. 2009).
Discussion
In this study, we set out to ask if weaver ants were likely to compete with birds for arthropods at low
elevations in eastern Himalaya. Our results show significant diet overlap between weaver ants and birds.
Moreover, we found lower arthropod abundance on trees with weaver ants and confirmed experimentally
that weaver ant removal led to increased abundance of arthropods. This is important because a greater
abundance of arthropods at mid-elevations correlates with the presence of many small insectivorous bird
species at these elevations (Price et al. 2014). Further, the two most common arthropod orders in bird diets
5at low elevations were the ones to increase most in abundance after weaver ant removal. Since weaver ants
are found only at low elevations, they could contribute to the presence of fewer arthropods at these elevations
rather than higher up. Together, these results suggest that weaver ants reduce food availability for birds at
low elevations in the eastern Himalaya.
Our molecular diet analyses showed overlap in the diet of weaver ants and low elevation birds at all taxonomic
levels and overlap in the diet of weaver ants and mid-elevation birds at higher taxonomic levels. While many
previous studies have presented evidence for competition between birds and ants (Supplementary table S1),
this appears to be the first study that has quantified overlap in diet between an ant species and insectivorous
songbirds. Our work also demonstrates the utility of molecular diet analyses to examine dietary niche overlap
between distantly related organisms. Studies of dietary niche partitioning among species are increasingly
using molecular tools to get fine-scale taxonomic information on diet composition (Razgour et al. 2011;
Brown et al. 2014; Kartzinel et al. 2015; Arrizabalaga-Escudero et al. 2018). Due to PCR and sequencing
biases, these methods may not give accurate information on the quantity of dietary items (Pompanon et al.
2012; Shokralla et al. 2012). Still, we think that information on the identity and frequency of dietary items
obtained using these methods can be very useful to understand the diversity patterns of dietary guilds along
environmental gradients.
Reduced herbivory and reduced abundance of large arthropods on trees with weaver ants have been demon-
Posted on Authorea 10 Feb 2020 — CC BY 4.0 — https://doi.org/10.22541/au.158137036.64067629 — This a preprint and has not been peer reviewed. Data may be preliminary.
strated previously. Asian weaver ants have been long used as a biological control agent and are still used
to control pest populations in orchards (Way and Khoo 1992; Peng and Christian 2005; Van Mele 2008;
Thurman et al. 2019). A recent review found that weaver ants significantly reduce pest populations on
tropical tree crops (Thurman et al. 2019). Offenberg et al. (2004b) showed that a leaf beetle species avoided
eating leaves with weaver ant pheromones on them. In mangrove forests, the presence of weaver ants is
negatively correlated with leaf damage due to herbivores (Offenberg et al. 2004a), as we also found in this
study. More broadly, many plant species form strong mutualistic associations with ants to reduce the risk of
herbivory by offering them rewards such as food bodies, extra-floral nectaries and domatia (i.e. nesting sites)
(Janzen 1966; Fiala et al. 1989; Webber et al. 2007; Chomicki et al. 2016). Even facultative or opportunistic
ant-plant interactions are known to reduce herbivory and deter other arthropods from plants occupied or
visited frequently by ants (Bentley 1977; Fiala et al. 1994; Chamberlain and Holland 2009; Rosumek et al.
2009; Trager et al. 2010).
We suggest that the relatively high arthropod abundance at mid-elevations in the eastern Himalaya is partly
a consequence of reduced ant predation, but this does not exclude contributions from other factors, including
differences in primary productivity (Acharya et al. 2011), plant diversity and density (Acharya et al. 2011)
and higher seasonality (Supriya et al. 2019). Overall, our results lend support the idea that competition from
ants could contribute to mid-elevational peak in songbird diversity in the eastern Himalaya. A similar link
between competition with ants and diversity patterns was recorded by Brown & Davidson (1977) who found
complementary diversity patterns in response to annual precipitation in seed-eating ants and rodents along a
north-south gradient in the US. Likewise Heaney (2001) suggested competition with ants may be responsible
for the peak in small mammal diversity in cloud forests in the Philippines. Other studies have shown patterns
of complementary diversity patterns between ants and other arthropod groups, such as staphylinid beetles,
carabid beetles and spiders (Holldobler and Wilson 1990; Halaj et al. 1997; Noreika and Kotze 2012). More
generally, the near-absence of ants in cloud forests (Longino et al. 2014) could be an important explanatory
factor for the high diversity of many other taxa there.
A recent meta-analysis of ant species diversity patterns along elevational gradients found some support for
a model whereby temperature and precipitation interact to affect ant diversity, i.e. there is a significant
relationship between temperature and ant diversity on 83% of wet mountains compared to only 25% of
arid mountains (Szewczyk and McCain 2016). Still, the question of why ants are so rare in montane cloud
forests remains largely unanswered. Previous studies have suggested that the combination of year-round
cool temperatures and humidity make cloud forests unsuitable for ants (Wheeler 1917; Janzen 1973; Samson
et al. 1997). However, competition from endotherms such as birds and mammals might also contribute to
6limiting ant distributions, in much the same way that we postulate ants affect birds in the warm and wet
lower elevations. Experimental tests to compare the importance of abiotic versus biotic effects in shaping
the pattern of ant abundance along elevational gradients are much needed.
Overall, our observational and experimental data suggest that birds and ants compete for arthropod prey
at low elevations in the eastern Himalaya. As diversity patterns of taxa shift due to climate change, it is
important to monitor these patterns and compare patterns of such distantly related but potentially competing
taxa. We advocate for more studies on ecological interactions between distantly related taxa in shaping
diversity patterns, because these interactions could dampen (Suttle et al. 2007) or enhance the effect of
climate change on species abundance and range distributions, depending on the actors involved (Davis et al.
1998).
Acknowledgements
We thank members of the Moreau lab, Price lab and Jablonski lab for discussions, David Jablonski and Cathy
Pfister for their comments on an earlier version of the MS, and Daniel Hooper for his original insights into the
possible competitive effects of ants on birds. We would also like to thank Amir Chhetri, Suresh Brar, Suresh
Rana, Deepika Karmarkar, Jobin Varughese, Vinod Shankar, Priyanka Das, Ritobroto Chanda, Pranav
Balasubramanian, Sumit Bawalia and Abhijit Dey for assistance in the field. We are grateful to Amruta
Varudkar, Prachi Thatte, Krishnapriya Tamma, Jyothi Nair, Anubhab Khan, Kevin Feldheim, Brian Wray
Posted on Authorea 10 Feb 2020 — CC BY 4.0 — https://doi.org/10.22541/au.158137036.64067629 — This a preprint and has not been peer reviewed. Data may be preliminary.
and Stefan Green for help with lab work. Data collection was funded by a Young Explorer grant from
National Geographic Society, a Rufford Small Grant and Henry Hinds Fund for Graduate Student Research
in Evolutionary Biology to K. Supriya. K. Supriya was supported by a Field Museum Women in Science
Fellowship at the time of data collection and a Faculty for the Future fellowship from the Schlumberger
Foundation at the time of writing this manuscript. We would also like to thank two anonymous reviewers
for their comments on a previous version of this manuscript.
Ethics
This study was approved by Institutional Animal Care and Use Committee at the University of Chicago
(ACUP # 71393). We also received permission for our fieldwork from the West Bengal Forest Department
(1423/WL/4R-1(Part-XII)/2014 and 2702/4R-6/2015).
Data, code and material
All data and code used for analyses is available on a github repository
(https://doi.org/10.5281/zenodo.2651358)
Competing interests
The authors have no competing interests
Authors contributions
All authors conceived and designed the study. K.S. carried out fieldwork, molecular lab work, data analyses
and drafted the manuscript. C.S.M. and T.D.P critically revised the manuscript. All authors gave final
approval for publication and agree to be held accountable for the work performed therein.
Literature cited
Abbott, I., L. K. Abbott, and P. R. Grant. 1977. Comparative Ecology of Galapagos Ground Finches
(Geospiza Gould): Evaluation of the Importance of Floristic Diversity and Interspecific Competition. Ecol.
Monogr. 47:151–184.
Acharya, B. K., N. J. Sanders, L. Vijayan, and B. Chettri. 2011. Elevational gradients in bird diversity in
the eastern Himalaya: An evaluation of distribution patterns and their underlying mechanisms. PLoS ONE
6:e29097.
7Anderson, R. P. 2017. When and how should biotic interactions be considered in models of species niches
and distributions? J. Biogeogr. 44:8–17.
Araujo, M. B., and A. Rozenfeld. 2014. The geographic scaling of biotic interactions. Ecography 37:406–415.
Arrizabalaga-Escudero, A., E. L. Clare, E. Salsamendi, A. Alberdi, I. Garin, J. Aihartza, and U. Goiti.
2018. Assessing niche partitioning of co-occurring sibling bat species by DNA metabarcoding. Mol. Ecol.
27:1273–1283.
Basu, P. 1997. Competition hierarchy in the ground foraging ant community in a wet evergreen forest
(Western Ghats, India): role of interference behaviour. Curr. Sci. 73:173–179.
Bentley, B. L. 1977. Extrafloral nectaries and protection by pugnacious bodyguards. Annu. Rev. Ecol.
Syst. 8:407–427.
Blois, J. L., P. L. Zarnetske, M. C. Fitzpatrick, and S. Finnegan. 2013. Climate Change and the Past,
Present, and Future of Biotic Interactions. Science 341:499–504.
Brown, D. S., R. Burger, N. Cole, D. Vencatasamy, E. L. Clare, A. Montazam, and W. O. C. Symondson.
2014. Dietary competition between the alien Asian Musk Shrew (Suncus murinus) and a re-introduced
population of Telfair’s Skink (Leiolopisma telfairii). Mol. Ecol. 23:3695–3705.
Posted on Authorea 10 Feb 2020 — CC BY 4.0 — https://doi.org/10.22541/au.158137036.64067629 — This a preprint and has not been peer reviewed. Data may be preliminary.
Brown, J. H., and D. W. Davidson. 1977. Competition between seed-eating rodents and ants in desert
ecosystems. Science 196:880–882.
Callahan, B. J., P. J. McMurdie, M. J. Rosen, A. W. Han, A. J. A. Johnson, and S. P. Holmes. 2016.
DADA2: High resolution sample inference from Illumina amplicon data. Nat. Methods 13:581–583.
Chamberlain, S. A., and J. N. Holland. 2009. Quantitative synthesis of context dependency in ant–plant
protection mutualisms. Ecology 90:2384–2392.
Chen, H., and P. C. Boutros. 2011. VennDiagram: a package for the generation of highly-customizable Venn
and Euler diagrams in R. BMC Bioinformatics 12:35.
Chesson, P. 2000. Mechanisms of maintenance of species diversity. Annu. Rev. Ecol. Syst. 31:343–366.
Chomicki, G., Y. M. Staedler, J. Schonenberger, and S. S. Renner. 2016. Partner choice through concealed
floral sugar rewards evolved with the specialization of ant–plant mutualisms. New Phytol. 211:1358–1370.
Clarke, L. J., J. Soubrier, L. S. Weyrich, and A. Cooper. 2014. Environmental metabarcodes for insects: in
silicoPCR reveals potential for taxonomic bias. Mol. Ecol. Resour. 14:1160–1170.
Crozier, R. H., P. S. Newey, E. A. Schluns, and S. K. A. Robson. 2009. A masterpiece of evolution –
Oecophylla weaver ants (Hymenoptera: Formicidae). Myrmecol. News 13:57–71.
Davis, A. J., L. S. Jenkinson, J. H. Lawton, B. Shorrocks, and S. Wood. 1998. Making mistakes when
predicting shifts in species range in response to global warming. Nature 391:783–786.
Dias, R., M. G. Xavier, F. D. Rossi, M. V. Neves, T. a. P. Lange, A. Giongo, C. a. F. De Rose, and
E. W. Triplett. 2014. MPI-blastn and NCBI-TaxCollector: Improving metagenomic analysis with high
performance classification and wide taxonomic attachment. J. Bioinform. Comput. Biol. 12:1450013.
Emerson, B. C., and N. Kolm. 2005. Species diversity can drive speciation. Nature 434:1015–1017.
Eriksson, M. O. G. 1979. Competition between freshwater fish and goldeneyes Bucephala clangula (L.) for
common prey. Oecologia 41:99–107.
Faldyn, M. J., M. D. Hunter, and B. D. Elderd. 2018. Climate change and an invasive, tropical milkweed:
an ecological trap for monarch butterflies. Ecology 99:1031–1038.
8Fiala, B., H. Grunsky, U. Maschwitz, and K. E. Linsenmair. 1994. Diversity of ant-plant interactions:
protective efficacy in Macaranga species with different degrees of ant association. Oecologia 97:186–192.
Fiala, B., U. Maschwitz, T. Y. Pong, and A. J. Helbig. 1989. Studies of a South East Asian ant-plant
association: protection of Macaranga trees by Crematogaster borneensis. Oecologia 79:463–470.
Fischer, A. G. 1960. Latitudinal Variations in Organic Diversity. Evolution 14:64–81.
Floren, A., A. Biun, and E. K. Linsenmair. 2002. Arboreal ants as key predators in tropical lowland
rainforest trees. Oecologia 131:137–144.
Futuyma, D. J., and G. Moreno. 1988. The Evolution of Ecological Specialization. Annu. Rev. Ecol. Syst.
19:207–233.
Gavish, Y., C. J. Marsh, M. Kuemmerlen, S. Stoll, P. Haase, and W. E. Kunin. 2017. Accounting for biotic
interactions through alpha-diversity constraints in stacked species distribution models. Methods Ecol. Evol.
8:1092–1102.
Gerhold Pille, Cahill James F., Winter Marten, Bartish Igor V., Prinzing Andreas, and Venail Patrick. 2015.
Phylogenetic patterns are not proxies of community assembly mechanisms (they are far better). Funct. Ecol.
29:600–614.
Posted on Authorea 10 Feb 2020 — CC BY 4.0 — https://doi.org/10.22541/au.158137036.64067629 — This a preprint and has not been peer reviewed. Data may be preliminary.
Germain Rachel M., Weir Jason T., and Gilbert Benjamin. 2016. Species coexistence: macroevolutionary
relationships and the contingency of historical interactions. Proc. R. Soc. B Biol. Sci. 283:20160047.
Ghosh-Harihar, M. 2013. Distribution and abundance of foliage-arthropods across elevational gradients in
the east and west Himalayas. Ecol. Res. 28:125–130.
Goldberg, D. E., and A. M. Barton. 1992. Patterns and consequences of interspecific competition in natural
communities: a review of field experiments with plants. Am. Nat. 139:771–801.
Gomez Juan Pablo, Bravo Gustavo A., Brumfield Robb T., Tello Jose G., and Cadena Carlos Daniel. 2010.
A phylogenetic approach to disentangling the role of competition and habitat filtering in community assembly
of Neotropical forest birds. J. Anim. Ecol. 79:1181–1192.
Gotelli, N. J., E. M. Hart, and A. M. Ellison. 2015. EcoSimR: Null model analysis for ecological data. R
package version 0.1.0.
Halaj, J., D. W. Ross, and A. R. Moldenke. 1997. Negative effects of ant foraging on spiders in Douglas-fir
canopies. Oecologia 109:313–322.
Heaney, L. R. 2001. Small mammal diversity along elevational gradients in the Philippines: an assessment
of patterns and hypotheses. Glob. Ecol. Biogeogr. 10:15–39.
Hochberg, M. E., and J. H. Lawton. 1990. Competition between kingdoms. Trends Ecol. Evol. 5:367–371.
Holldobler, B., and E. O. Wilson. 1990. The ants. Belknap Press, Cambridge MA.
Jablonski, D. 2008. Biotic interactions and macroevolution: extensions and mismatches across scales and
levels. Evolution 62:715–739.
Jankowski, J. E., S. K. Robinson, and D. J. Levey. 2010. Squeezed at the top: Interspecific aggression may
constrain elevational ranges in tropical birds. Ecology 91:1877–1884.
Janzen, D. H. 1966. Coevolution of mutualism between ants and acacias in Central America. Evolution
20:249–275.
Janzen, D. H. 1973. Sweep samples of tropical foliage insects: Effects of seasons, vegetation types, elevation,
time of day, and insularity. Ecology 54:687–708.
9Jennings, D. E., J. J. Krupa, T. R. Raffel, and J. R. Rohr. 2010. Evidence for competition between
carnivorous plants and spiders. Proc. R. Soc. B Biol. Sci. 277:3001–3008.
Karban, R., P. Grof-Tisza, and M. Holyoak. 2017. Wet years have more caterpillars: interacting roles of
plant litter and predation by ants. Ecology 98:2370–2378.
Kartzinel, T. R., P. A. Chen, T. C. Coverdale, D. L. Erickson, W. J. Kress, M. L. Kuzmina, D. I. Rubenstein,
W. Wang, and R. M. Pringle. 2015. DNA metabarcoding illuminates dietary niche partitioning by African
large herbivores. Proc. Natl. Acad. Sci. 112:8019–8024.
Lany, N. K., P. L. Zarnetske, E. M. Schliep, R. N. Schaeffer, C. M. Orians, D. A. Orwig, and E. L. Preisser.
2018. Asymmetric biotic interactions and abiotic niche differences revealed by a dynamic joint species
distribution model. Ecology 99:1018–1023.
Longino, J. T., M. G. Branstetter, and R. K. Colwell. 2014. How ants drop out: ant abundance on tropical
mountains. PLoS ONE 9:e104030.
Maveety, S. A., R. A. Browne, and T. L. Erwin. 2013. Carabid beetle diversity and community composition
as related to altitude and seasonality in Andean forests. Stud. Neotropical Fauna Environ. 48:165–174.
Mayfield, M. M., and J. M. Levine. 2010. Opposing effects of competitive exclusion on the phylogenetic
Posted on Authorea 10 Feb 2020 — CC BY 4.0 — https://doi.org/10.22541/au.158137036.64067629 — This a preprint and has not been peer reviewed. Data may be preliminary.
structure of communities. Ecol. Lett. 13:1085–1093.
McCain, C. M., and J.-A. Grytnes. 2010. Elevational gradients in species richness. P. in Encyclopedia of
Life Sciences (ELS). John Wiley & Sons, Ltd, Chichester.
Nelsen, M. P., R. H. Ree, and C. S. Moreau. 2018. Ant–plant interactions evolved through increasing
interdependence. Proc. Natl. Acad. Sci. 115:12253–12258.
Noreika, N., and D. J. Kotze. 2012. Forest edge contrasts have a predictable effect on the spatial distribution
of carabid beetles in urban forests. J. Insect Conserv. 16:867–881.
Offenberg, J., S. Havanon, S. Aksornkoae, D. J. Macintosh, and M. G. Nielsen. 2004a. Observations on the
ecology of weaver ants (Oecophylla smaragdina Fabricius) in a Thai mangrove ecosystem and their effect on
herbivory of Rhizophora mucronata Lam. Biotropica 36:344–351.
Offenberg, J., M. G. Nielsen, D. J. MacIntosh, S. Havanon, and S. Aksornkoae. 2004b. Evidence that insect
herbivores are deterred by ant pheromones. Proc. R. Soc. Lond. B Biol. Sci. 271:S433–S435.
Oksanen, J., F. G. Blanchet, M. Friendly, R. Kindt, P. Legendre, D. J. McGlinn, P. R. Minchin, R. B. O’Hara,
G. L. Simpson, P. Solymos, M. Henry, H. Stevens, E. Szoecs, and H. Wagner. 2018. vegan: Community
Ecology Package.
Ozanne, C. 2005. Insect sampling in forest ecosystems. John Wiley & Sons.
Palmeirim, J. M., D. L. Gorchoy, and S. Stoleson. 1989. Trophic structure of a neotropical frugivore
community: is there competition between birds and bats? Oecologia 79:403–411.
Pasch, B., B. M. Bolker, and S. M. Phelps. 2013. Interspecific dominance via vocal interactions mediates
altitudinal zonation in neotropical singing mice. Am. Nat. 182:E161-173.
Peng, R., and K. Christian. 2005. Integrated pest management in mango orchards in the Northern Territory
Australia, using the weaver ant, Oecophylla smaragdina , (Hymenoptera: Formicidae) as a key element. Int.
J. Pest Manag. 51:149–155.
Pinol, J., X. Espadaler, and N. Canellas. 2012. Eight years of ant-exclusion from citrus canopies: effects on
the arthropod assemblage and on fruit yield. Agric. For. Entomol. 14:49–57.
Pinol, J., X. Espadaler, N. Canellas, J. Martinez-Vilalta, J. A. Barrientos, and D. Sol. 2010. Ant versus
bird exclusion effects on the arthropod assemblage of an organic citrus grove. Ecol. Entomol. 35:367–376.
10Pompanon, F., B. E. Deagle, W. O. C. Symondson, D. S. Brown, S. N. Jarman, and P. Taberlet. 2012. Who
is eating what: diet assessment using next generation sequencing. Mol. Ecol. 21:1931–1950.
Price, T. D., D. M. Hooper, C. D. Buchanan, U. S. Johansson, D. T. Tietze, P. Alstrom, U. Olsson, M.
Ghosh-Harihar, F. Ishtiaq, S. K. Gupta, J. Martens, B. Harr, P. Singh, and D. Mohan. 2014. Niche filling
slows the diversification of Himalayan songbirds. Nature 509:222–225.
R Core Team. 2014. R: A language and environment for statistical computing. R Foundation for Statistical
Computing, Vienna, Austria.
Razgour, O., E. L. Clare, M. R. K. Zeale, J. Hanmer, I. B. Schnell, M. Rasmussen, T. P. Gilbert, and G.
Jones. 2011. High-throughput sequencing offers insight into mechanisms of resource partitioning in cryptic
bat species. Ecol. Evol. 1:556–570.
Rosumek, F. B., F. A. O. Silveira, F. de S. Neves, N. P. de U. Barbosa, L. Diniz, Y. Oki, F. Pezzini, G.
W. Fernandes, and T. Cornelissen. 2009. Ants on plants: a meta-analysis of the role of ants as plant biotic
defenses. Oecologia 160:537–549.
Sam, K., B. Koane, and V. Novotny. 2014. Herbivore damage increases avian and ant predation of caterpillars
on trees along a complete elevational forest gradient in Papua New Guinea. Ecography n/a-n/a.
Posted on Authorea 10 Feb 2020 — CC BY 4.0 — https://doi.org/10.22541/au.158137036.64067629 — This a preprint and has not been peer reviewed. Data may be preliminary.
Samson, D. A., E. A. Rickart, and P. C. Gonzales. 1997. Ant diversity and abundance along an elevational
gradient in the Philippines. Biotropica 29:349–363.
Schemske, D. W., G. G. Mittelbach, H. V. Cornell, J. M. Sobel, and K. Roy. 2009. Is there a latitudinal
gradient in the importance of biotic interactions? Annu. Rev. Ecol. Evol. Syst. 40:245–269.
Schumm, M., A. E. White, K. Supriya, and T. Price. 2019. Ecological limits as the driver of bird species
richness patterns along the east Himalayan elevational gradient. Am. Nat., doi: 10.1086/707665.
Shokralla, S., J. L. Spall, J. F. Gibson, and M. Hajibabaei. 2012. Next-generation sequencing technologies
for environmental DNA research. Mol. Ecol. 21:1794–1805.
Stadtmuller, T. 1987. Cloud forests in the humid tropics: a bibliographic review. Bib. Orton IICA / CATIE.
Supriya, K., C. S. Moreau, K. Sam, and T. D. Price. 2019. Analysis of tropical and temperate elevational
gradients in arthropod abundance. Front. Biogeogr. 0.
Suttle, K. B., M. A. Thomsen, and M. E. Power. 2007. Species interactions reverse grassland responses to
changing climate. Science 315:640–642.
Szewczyk, T., and C. M. McCain. 2016. A Systematic Review of Global Drivers of Ant Elevational Diversity.
Plos One 11:e0155404.
Terborgh, J., and J. S. Weske. 1975. The role of competition in the distribution of Andean birds. Ecology
56:562–576.
Thurman, J. H., T. D. Northfield, and W. E. Snyder. 2019. Weaver Ants Provide Ecosystem Services to
Tropical Tree Crops. Front. Ecol. Evol. 7.
Trager, M. D., S. Bhotika, J. A. Hostetler, G. V. Andrade, M. A. Rodriguez-Cabal, C. S. McKeon, C. W.
Osenberg, and B. M. Bolker. 2010. Benefits for plants in ant-plant protective mutualisms: a meta-analysis.
PLOS ONE 5:e14308.
Tucker, C. M., M. W. Cadotte, S. B. Carvalho, T. J. Davies, S. Ferrier, S. A. Fritz, R. Grenyer, M. R.
Helmus, L. S. Jin, A. O. Mooers, S. Pavoine, O. Purschke, D. W. Redding, D. F. Rosauer, M. Winter, and
F. Mazel. 2017. A guide to phylogenetic metrics for conservation, community ecology and macroecology.
Biol. Rev. 92:698–715.
11Tylianakis, J. M., R. K. Didham, J. Bascompte, and D. A. Wardle. 2008. Global change and species
interactions in terrestrial ecosystems. Ecol. Lett. 11:1351–1363.
Valiente-Banuet, A., M. A. Aizen, J. M. Alcantara, J. Arroyo, A. Cocucci, M. Galetti, M. B. Garcia, D.
Garcia, J. M. Gomez, P. Jordano, R. Medel, L. Navarro, J. R. Obeso, R. Oviedo, N. Ramirez, P. J. Rey, A.
Traveset, M. Verdu, and R. Zamora. 2015. Beyond species loss: the extinction of ecological interactions in
a changing world. Funct. Ecol. 29:299–307.
Valone, T. J., and J. H. Brown. 1995. Effects of competition, colonization, and extinction on rodent species
diversity. Science 267:880–883.
Van Mele, P. 2008. A historical review of research on the weaver ant Oecophylla in biological control. Agric.
For. Entomol. 10:13–22.
Venail, P. A., A. Narwani, K. Fritschie, M. A. Alexandrou, T. H. Oakley, and B. J. Cardinale. 2014. The
influence of phylogenetic relatedness on species interactions among freshwater green algae in a mesocosm
experiment. J. Ecol. 102:1288–1299.
Way, M. J., and K. C. Khoo. 1992. Role of ants in pest management. Annu. Rev. Entomol. 479–503.
Webb, C., D. Ackerly, M. Mcpeek, and M. Donoghue. 2002. Phylogenies and community ecology. Annu.
Posted on Authorea 10 Feb 2020 — CC BY 4.0 — https://doi.org/10.22541/au.158137036.64067629 — This a preprint and has not been peer reviewed. Data may be preliminary.
Rev. Ecol. Syst. 33:475–505.
Webber, B. L., J. Moog, A. S. O. Curtis, and I. E. Woodrow. 2007. The diversity of ant–plant interactions in
the rainforest understorey tree, Ryparosa (Achariaceae): food bodies, domatia, prostomata, and hemipteran
trophobionts. Bot. J. Linn. Soc. 154:353–371.
Wheeler, W. M. 1917. The mountain ants of western North America. Proc. Am. Acad. Arts Sci. 52:457–
569.
Wickham, H. 2011. ggplot2. Wiley Interdiscip. Rev. Comput. Stat. 3:180–185.
Wilson, E. O. 1987. Causes of ecological success: the case of the ants. The sixth tansley lecture. J. Anim.
Ecol. 56:1–9.
Wisz, M. S., J. Pottier, W. D. Kissling, L. Pellissier, J. Lenoir, C. F. Damgaard, C. F. Dormann, M. C.
Forchhammer, J.-A. Grytnes, A. Guisan, R. K. Heikkinen, T. T. Hoye, I. Kuhn, M. Luoto, L. Maiorano,
M.-C. Nilsson, S. Normand, E. Ockinger, N. M. Schmidt, M. Termansen, A. Timmermann, D. A. Wardle,
P. Aastrup, and J.-C. Svenning. 2013. The role of biotic interactions in shaping distributions and realised
assemblages of species: implications for species distribution modelling. Biol. Rev. 88:15–30.
Wright, E. 2016. Using DECIPHER v2.0 to Analyze Big Biological Sequence Data in R. R J. 8:352–359.
Zeale, M. R. K., R. K. Butlin, G. L. A. Barker, D. C. Lees, and G. Jones. 2011. Taxon-specific PCR for
DNA barcoding arthropod prey in bat faeces. Mol. Ecol. Resour. 11:236–244.
Figure legends:
Figure 1: a. Correlation between number of songbird species and individuals along an elevational gradient
in the eastern Himalayab. Correlation between number of songbird species and arthropod abundance along
the same gradient. Site at 200m and 2000m elevation examined further in this study shown in blue and
yellow respectively. Based on data in (Price et al. 2014)
Figure 2 Venn diagram showing diet overlap at multiple taxonomic levels as assessed with molecular
metabarcoding between weaver ants, birds at low elevations and birds at mid-elevations. Bird and ant
silhouettes taken from phylopic.org. Anthony Caravaggi produced the bird silhouette.
Figure 3: (a-b) Data from 34 trees paired for size and species, where one tree had weaver ants and the
other did not.a. Number of arthropods belonging to the orders Lepidoptera and Coleoptera b. Leaf damage
estimated on 10 leaves distributed around the tree.
12Figure 4: Number of arthropods (excluding ants and suborder Homoptera) before and one month after
weaver ant removal and exclusion experiment. Data from 30 trees paired for size and species, with one
member of each pair subject to weaver ant removal and exclusion. Grey lines and dots show control trees
and purple lines and dots show treatment trees. Darker dots and lines indicate multiple overlapping points.
Figure 5 a. Difference in mean abundance of major arthropod orders in control and treatment trees one
month after ant exclusion and removal (derived from the data in Fig. S7) b.Frequency of different arthropod
orders in bird diets at low elevations (Proportion of individual birds with at least one sequence from that
order, N = 18 individuals)
Posted on Authorea 10 Feb 2020 — CC BY 4.0 — https://doi.org/10.22541/au.158137036.64067629 — This a preprint and has not been peer reviewed. Data may be preliminary.
13Posted on Authorea 10 Feb 2020 — CC BY 4.0 — https://doi.org/10.22541/au.158137036.64067629 — This a preprint and has not been peer reviewed. Data may be preliminary. 14
Posted on Authorea 10 Feb 2020 — CC BY 4.0 — https://doi.org/10.22541/au.158137036.64067629 — This a preprint and has not been peer reviewed. Data may be preliminary.

15
You can also read