Consequence analysis of an explosion by simple models: Texas refinery gasoline explosion case
←
→
Page content transcription
If your browser does not render page correctly, please read the page content below

Consequence analysis of an explosion by simple
   models: Texas refinery gasoline explosion case
                         Justo Lobato*a, Juan F. Rodrígueza, Carlos Jiméneza , Javier
                           Llanosa, Antonio Nieto-Márqueza, Antonio M. Inarejosb
          Faculty of Chemistry, Department of Chemical Engineering, University of Castilla- La Mancha. Campus
          a

           Universitario s/n. 13004. Ciudad Real, Spain. bFaculty of Chemistry, Department of Food Technology,
                 University of Castilla- La Mancha. Campus Universitario s/n. 13004. Ciudad Real, Spain.

                         Análisis de consecuencias de una explosión mediante modelos
                           sencillos. Ejemplo de la explosión de la refinería de Texas

                      Anàlisi de conseqüències d’una explosió mitjançant models senzills.
                                  Exemple de l’explosió de la refineria de Texas

                          Recibido: 30 de abril de 2009; aceptado: 24 de Julio de 2009

Resumen                                                        plosion. Moreover, a thermal radiation model was used to
                                                               estimate the damage caused by the heat released as con-
Los accidentes en las plantas petroquímicas y refinerías       sequence of the explosion. Finally, the Probit methodology
son bastantes destructivos, debido a la gran reactivi-         was used to evaluate the vulnerability of persons. Although
dad de los productos químicos que están presentes en           differences between the data derived from each of them
las mismas. Un accidente que ocurrió en la refinería de        existed, they all reproduced actual damages with a rea-
la ciudad de Texas, el 23 de marzo de 2005, consistente        sonable accuracy. The results reached let us say that the
en la explosión de una nube de vapor (ENV), que se pro-        TNO and BST models predict with a reasonable accuracy
dujo tras la fuga de gasolina y causó 15 muertes ha sido       the effects of the explosion that occurred. Furthermore,
estudiado en términos de vulnerabilidad de las personas        the use of simplified empirical models can be used for risk
a la sobrepresión y la radiación térmica. Con este objeti-     assessment.
vo, se utilizaron varios modelos empíricos sencillos (TNT,     Keywords: Vapour Cloud Explosion (VCE); Consequence
TNO Multienergía y BST) para evaluar los efectos de la         analysis; overpressure; thermal radiation; Refinery
sobrepresión de la explosión. Además, para estudiar los
efectos de la radiación térmica se utilizó un modelo que
permitía calcular el daño causado por el calor irradiado       Resum
por la explosión. Finalmente, se utilizó la metodología Pro-
bit para evaluar la vulnerabilidad de las personas. Aunque     Els accidents en les plantes petroquímiques i refineries
se observó diferencias en los resultados obtenidos por los     són bastant destructius, degut a la gran reactivitat dels
modelos, todos ellos, los de sobrepresión y de radiación       productes químics que són presents en elles. Un accident
térmica, reprodujeron con bastante exactitud los daños         que succeí a la refineria de la ciutat de Texas, el 23 de
reales causados por la explosión en la refinería. Se puede     març de 2005, consistent en l’explosió d’un núvol de vapor
decir que los modelos TNO y BST son los que con mayor          (ENV), que es va produir en haver-hi una fuita de gasolina i
precisión predijeron los efectos de sobrepresión causados      què causà 15 morts, s’estudia pel que fa a vulnerabilitat de
por la explosión. Por tanto, la utilización de modelos empí-   les persones a la sobrepressió i a la radiació tèrmica. Amb
ricos sencillos es factible para la evaluación de riesgos.     aquest objectiu, s’utilitzen varis models empírics senzills
Palabras claves: Explosión de una nube de vapor (ENV);         (TNT, TNO Multienergia i BST) per avaluar els efectes de la
Análisis de consecuencias; Sobrepresión; Radiación tér-        sobrepressió de l’explosió. A més, per estudiar els efectes
mica; Refinería                                                de la radiació tèrmica s’empra un model que permet cal-
                                                               cular el dany causat per la calor irradiada per l’explosió.
                                                               Finalment, s’utilitza la metodologia Probit per avaluar la
Summary                                                        vulnerabilitat de les persones. Tot i que s’observen di-
                                                               ferències en els resultats obtinguts amb els diferents mo-
Accidents in petrochemical plants and oil refineries are       dels, tots ells, tant els de sobrepressió com els de radiació
quite destructive, due to the high reactivity of chemicals     tèrmica, reprodueixen amb força exactitud els danys reals
involved in them. An accident that occurred in the Texas       causats per l’explosió en la refineria. Es pot dir que els
City refinery, on March 23rd 2005, consisting on a vapour
cloud explosion (VCE) that followed a gasoline release and
caused 15 deaths, has been studied in terms of people
vulnerability to overpressure and thermal radiation. With      * To whom correspondence should be addressed:
this aim, simple models (TNT, TNO Multi-Energy, BST)           Tel. +34 926 295 300; Fax: +34 926 295 318:
have been used in order to evaluate the effects of the ex-     Justo.Lobato@uclm.es

372                                                                  Afinidad LXVI, 543, Septiembre-Octubre 2009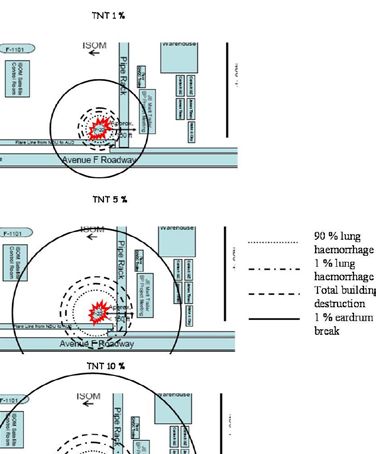
models TNO i BST són els que prediuen amb major preci-                              no et al., 1998). These models require a big mathematical
sió els efectes de sobrepressió causats per l’explosió. Per                         effort and powerful equipment to be handled (Puttock at
tant, la utilització de models empírics senzills és factible                        al., 2000). Furthermore, CFD model requires a few simpli-
per a la avaluació de riscos.                                                       fied assumptions and some adjustable parameters to be
                                                                                    applied, because of the lack of fundamental knowledge
Mots clau: Explosió d’un núvol de vapor (ENV); Anàlisi de                           on turbulent flows in unsteady, compressible and reacting
conseqüències; Sobrepressió; Radiació tèrmica; Refineria                            media (Popot et at., 1996; Tufano et al., 1998).
                                                                                    There are several simplified models such as the TNT-
                                                                                    equivalent method, TNO multy-energy and the Baker-
Introduction                                                                        Strehlow-Tang model (BST) collected in the literature, that
                                                                                    have been used to model the effect of VCEs (Lobato et al.,
Petroleum has been the main energy source of the world                              2006; Pierorazio et al., 2005; Rigas and Sklavounos, 2002;
in the latest 40 years as it can be seen in Figure 1 (http://                       Shariff et al., 2006). Maybe, the best simulation of explo-
www.eia.doe.gov/emeu/consumptionbriefs/cbecs/cbecs_                                 sions could be the combined use of simplified models, as
trends/figb8.gif). It has very important effects on the eco-                        an initial approach, with CFD methods.
nomy of the countries due to the high fluctuation of crude                          In a consequence study of a VCE, the overpressure of the
oil prices and the fact that only a few countries posses                            explosion must be related with different damages cau-
oil reservoirs. It makes it very important the presence of                          sed to both building and humans. Damage criteria can be
a great number of refineries all over the world in order to                         taken from tables that relate overpressure with the Probit
make the most of crude oil.                                                         equation (Finney, 1971; CCPS, 2000).
Every year several fatal accidents occur in chemical                                In this work, the consequence analysis of an accident that
plants. Because of their peculiar characteristics (volatile                         occurred in the Texas City refinery, on 2005, consisting of
compounds, flammability, etc.), many of these accidents                             a VCE that followed to a gasoline release, has been eva-
occur in refineries which are especially dangerous. This is                         luated using three different simplified models to estimate
due to the fact that they are vapour cloud explosions (VCE)                         the overpressure of the explosion and the Probit equation
or boiling liquid expanding vapor explosions (BLEVES). In                           to estimate the vulnerability of persons. Moreover, a sim-
addition, some domino effects can occur in this kind of ac-                         ple thermal radiation model has been used to estimate, in
cidents that could increase the damages and affect other                            conjunction with Probit equation, the vulnerability corres-
zones (Delvosalle et al., 2002).                                                    ponding to the fire ball caused by the explosion.
Recently, one of these accidents occurred in Texas City,
Texas (USA) on March 23, 2005. This is an interesting case
of study not only for being recent but also for its conse-                          2. Theory
quences. In this accident 15 people died and important
material damages occurred (BP fatal accident report).                               2.1. Evaluation of evaporated mass.
Consequence analysis is used to estimate the magnitude                              The evaluation of the quantity of evaporated mass is the
of accident effects in human health, damages in facility/                           most important parameter to be considered in this work.
equipment, economical losses or environmental impacts                               The complexity of the target liquid (gasoline) makes diffi-
associated with accidents involving hazardous materials                             cult its treatment, as it can be considered neither an over-
(toxic, flammable, explosive, radioactive, etc.). Conse-                            heated nor a boiling liquid.
quence analysis estimates releases to the environment,                              The total leak amount, mT (kg), can be calculated by multi-
fire or explosions, and estimates the effects that a release                        plying the discharge rate, QD (kg/s), by the leak time, tL(s),
might have on buildings, employees, or the public (Lobato                           (Eq. (1)), both data are available in the fatal accident inves-
et al., 2006).                                                                      tigation report (BP fatal accident report).
Recently, Vapour Cloud Explosions (VCEs) can be analy-
sed by means of different models. Computational Fluids                                                                                (1)
Dynamics (CFD) modelling techniques have been conside-
red for this purpose (Skalovonnos and Rigas, 2004; Tufa-

 100%

  90%

  80%
            Traditional Renewables

  70%
                                                     Coal

  60%

  50%
                                                                                                 Oil

  40%

  30%

                                                                                                         Natural Gas
  20%

  10%
                                                                                                         Nuclear                  Figure 1. Evolution of
                                                                                        Hydroelectric
  0%
                                                                                                                                 energy sources demand
    1860   1870    1880      1890    1900   1910   1920     1930   1940   1950   1960        1970       1980       1990   2000      in the last century.

Afinidad LXVI, 543, Septiembre-Octubre 2009                                                                                                                373
This calculation provides the total mass present in the leak, Sklavounos, 2002). This model is based on an empirical
a part of which suffers a flash distillation as a result of its law, established from trials done using explosives. This law
pressure change. It has been considered that only the ga- establishes equivalent effects for explosions occurring at
soline fractions with a distillation temperature lower than the same normalized distance, expressed as:
its storage temperature (374.25 K) can suffer this flash dis-
tillation. Using a typical ASTM distillation curve (Table 1),
these fractions represent approximately, 17 % of the total (5)
mass. Consequently, the amount of gasoline, m0 (kg), that
will suffer this flash distillation can be calculated by using where z is the normalized or scaled distance (m/kg1/3), Rd
the following equation (Eq. (2)). is the real distance (m), and WTNT is the equivalent mass of
(2) TNT (kg), calculated by equation 4.
Using this data, an energy balance can be applied to cal- For any given scaled distance, there is a corresponding
culate the mass of vapour cloud that produces the explo- value of overpressure, which is obtained from an empirical
sion (Eq. (3)): chart (see Figure 2) of scaled distance versus overpressu-
re. This graph is based on the results of numerous expe-
(3) rimental programs involving high explosives (CCPS, 2000;
Bodhurtha, 1980; Lees, 1980). Once this overpressure is
obtained, the probability of suffering different damages
where mv (kg) is the initial mass that contributes to the can be calculated from the data reported in Table 2. Data
explosion, Cp (kJ/kg·K) is the heat capacity of the target presented in bold in this table are the damage thresholds
liquid, To and Teb (K) represent respectively the initial and used in the present work to carry out the study of the
boiling temperatures of the liquid and hv (kJ/kg) is the heat effects caused by the explosion.
of evaporation of gasoline.
The initial boiling point of the target gasoline (303 K) is qui-
te close to room temperature (300 K). For this reason, the
amount of evaporated mass due to the liquid behaviour as
a boiling liquid will be considered negligible.
Table 1. ASTM distillation curve for a standard gasoline.
Distillate Volume (%) T (K)
Initial point 303.15
10 330.15
20 349.15
30 363.15
40 372.15
50 380.15
60 389.15
70 400.15
80 415.15
90 437.15
Final point 471.15 Figure 2. Overpressure vs. normalised
distance for its use in TNT model.
2.2. Evaluation of overpressure.
2.2.1. TNT Equivalency Explosion Model. Table 2. Different damages caused by the overpressure
The TNT equivalency explosion model has been chosen (Bodhurtha, 1980; Santamaría y Braña, 1998; Lobato et al.,
because it is simple and tends to be better for estimating 2006; Sariff et al., 2006). The data presented in bold repre-
far-field damage. With this model, the overpressure deve- sent the damage threshold selected in the present work.
loped at specified distances (points of interest) can be cal-
culated. In order to apply the TNT model to the estimation Overpressure (KPa) Damage
of the effects of a VCE, the fraction of total energy of the Occasional breakage of large windows already
0.204
explosion used in the shock wave must be calculated first. under strain
Loud noise. Breakage of windows due to
Once the corresponding value is estimated, it is converted 0.275 sound waves
into the equivalent mass of TNT, WTNT (kg): 0.681 Breakage of small panes of glass already
under strain
20 % windows broken. Minor structural
2.04
(4) damage to houses
Partial demolition of houses, which become
6.8 uninhabitable
where WTNT is the equivalent mass of TNT (kg) that would 13.6 Partial collapse of house roofs and walls
produce the same effects as the explosion, η represents 13.1-20.4 Destruction of cement walls of 20-30 cm width
the explosion yield (dimensionless), it is generally accep- 16.2 1% of eardrum breakage
ted that, taking as a basis for calculation the total quantity 17 Destruction of 50 % of brickwork of houses.
Distortion of steel frame building
of vapor in the cloud, the value of η is between 1% and 10
20.4-27.7 Rupture of storage tanks
% for most explosions. Wgas is the total mass of flammable
34-47.6 Almost total destruction of houses
gas in the cloud, ∆Hc(gas) is the lower heat of combustion of
the material (kJ/kg), and ∆Hc(TNT) is the heat of combustion 47.7-54.4 Breakage of brick walls of 20-30 cm width
of TNT (approximately 4680 kJ/kg). Probable total destruction of buildings.
68.9 Machines weighing 3500 kg displaced and
Despite the limitations due to its simplified nature, the TNT highly damaged
model is still widely used to predict overpressures at a gi- 101 1% death due to lung haemorrhage
ven distance from the center of an explosion (Rigas and
169.2 90% death due to lung haemorrhage
374 Afinidad LXVI, 543, Septiembre-Octubre 20092.2.2 TNO Multi-Energy Model
This model is increasingly accepted as a more reasonable
alternative to be used as a simple and practical method
(Bodhurtha, 1980; Díaz Alonso et al., 2006). It is based on
the premise that a vapour cloud explosion can occur only
within that portion of a flammable vapour that is partially
confined. Thus, the amount of energy released during a
VCE is limited either by the volume of the partially-confined Ps
portion of the flammable vapour cloud (if the flammable
vapour cloud is larger than the partially-confined region)
or by the volume of the vapour cloud (if the vapour cloud
is smaller than the volume of the portion of the partially-
confined space). In both cases, the volume of the cloud
within the partially-confined space can be converted into a
hemisphere of equal volume. The model treats the hemis-
pherical cloud as a homogeneous, stoichiometric mixture
of flammable gas and air, with a combustion energy of 3.1
106 J/m3 (the average heat of combustion of a stoichiome-
tric mixture of hydrogen and air). TNO model has used a R
flux-corrected transport code to numerically simulate the
explosion of a hemispherical, homogeneous, stoichiome- Figure 4. Normalised overpressure vs. norma-
tric cloud, with constant flame speed. TNO presents the lised distance for its use in BST model.
results of this modelling as a family of curves in Figure 3
(Mercx et al., 2000; Van der Berg, 1985). In this chart, ten misphere, m, P0 is the atmospheric pressure, J/m3, and E
curves that span the range of severities from mild deflagra- is the total available energy, J.
tions to detonations have been shown. Each curve is as- With the equation 7 the peak side-on overpressure Ps (N/
signed an integer that indicates its severity. Thus, curve #1 m2), can be calculated
means mild deflagration and #10 stands for detonation. (7)
These curves correlate dimensionless overpressure (over- where is the dimensionless peak overpressure, which
pressure divided by atmospheric pressure) with combus- can be calculated, once is known , from Figure 3.
tion energy scaled distance, which is calculated as fo-
llows: 2.2.3. Baker-Strehlow-Tang Model (BST)
(6) This model has some similarities with the TNO Multi-Ener-
where is the combustion energy scaled distance, di- gy Model. Each model uses a family of curves to correlate
mensionless, Rd is the distance from the centre of the he- with , and both models use equation 6 to calculate.
The method used to construct the graphical relationship
between dimensionless and combustion energy scaled
distance, , is different to that used in the TNO model.
The curves used in the BST model, shown in Figure 4,
are based on numerical modelling of constant velocity fla-
mes and accelerating flames spreading through spherical
vapour clouds [10]. With this method, the strength of the
blast wave is proportional to the maximum flame speed
Ps achieved within the cloud. Thus, each curve in Figure 4
is marked with a flame velocity, which is presented in the
form of a Mach number, Mf. In Table 3, the appropriate
flame speed (Mach number) for the specific situation being
modelled can be selected (Pierorazio et al., 2005; Baker et
al., 1989).
Table 3. Flame Speed in Mach Numbers (Mf) for igni-
tion sources used in the Baker-Strehlow-Tang Model.
Flame Obstacle Density
Fuel
Expan-
Reactivity Low Medium High
sion
High 5.2 5.2 5.2
1D Medium 1.03 1.77 2.27
Low 0.294 1.03 2.27
High 0.59 1.03 1.77
2D Medium 0.47 0.66 1.6
Low 0.079 0.47 0.66
High 0.47 0.58 1.18
2.5 D Medium 0.29 0.55 1.0
R Low 0.053 0.35 0.50
High 0.36 0.153 0.588
3D Medium 0.11 0.44 0.50
Figure 3. Normalised overpressure vs. normalised
Low 0.026 0.23 0.34
distance for its use in TNO Multi-Energy model.
Afinidad LXVI, 543, Septiembre-Octubre 2009 375the case of fireballs, V represents the thermal radiation re-
2.3. Thermal radiation caused by a fireball ceived, and it is calculated as follows:
Thermal radiation model caused by a fireball was used to
estimate the damage caused by the explosion heat. In this
work, the radiation flow on the affected surface has been (15)
calculated. Total evaporated mass, calculated somewhere
else, is needed to apply this model. Once the total evapo-
rated mass is estimated, the flow of radiation per surface 3. Fatal Accident Scenario
area and time unit, I (Jm-2s-1) was calculated using equa- The Texas City Refinery is BP’s largest and most complex
tions 8 to 10 (Santamaría and Braña, 1998): oil refinery in the USA. It produces jet fuels, diesel fuels
and chemical feed stocks. The refinery has a rated capa-
(8) city of 460,000 barrels per day (bpd) and a production of
up to 11 million gallons of gasoline per day (about 48.5
millions litters). The BP Texas refinery is located at Texas
(9) City (Texas), it has 486 hectares and supplies 30 per cent
of all the BP production in the United States and 3 per cent
(10) of all the production in that country. The BP Texas refinery
has 30 process units. Among these units, the isomerisa-
where FR (dimensionless), is defined as the ratio between tion plant (ISOM) is located, where the refinery converts
the energy emitted by radiation and the total energy re- low octane blending feeds into a higher octane feed that
leased by the combustion. The FR values are in the range is included in the unleaded regular gasoline pool. The fa-
0.15 to 0.4, mv (kg) is the initial mass that contributes to tal accident occurred in the unit mentioned above and at
the fireball, t (s) is the duration of the fireball, Dmax (m) is the that time, approximately 800 additional staff were on site
maximum diameter of the ball. for turnaround work (BP fatal accident investigation report,
To calculate the radiation flux over the affected surface 2007).
IR (Jm-2s-1) up to 100 m must be considered the geome- On Wednesday, March 23rd of 2005, at 13:20h, during the
tric view factor, Fvg and the transmissivity τ, defined as the start-up of the Isomerisation Unit (ISOM), an explosion and
fraction of energy transmitted and calculated approxima- fire occurred, killing fifteen and harmed over 170 people in
tely as follows: the BP Products North America owned and operated by
(11) Texas City Refinery.
where Pw (Pa), is the partial pressure of the water vapour The temperature was 24.1ºC, barometric pressure 101,140
and X (m) is the distance to the centre of the ball. Pa, humidity 35% and wind speed 1.5 m/s. The incident
was an explosion in the west section of the complex,
(12) where the isomerisation plant (ISOM) was situated, and
involved the F-20 unit (Figure 5). The flames reached 21
(13) metres height and people found explosion fragments at 8
kilometres from the refinery. Figure 5 shows a scheme of
2.3.1. Thermal radiation vulnerability study the isomeration plant where the explosion occurred (BP fa-
Once the radiated energy caused by a fireball is calculated, tal accident investigation report, 2007). The raffinate split-
an estimation of the vulnerability of persons can be calcu- ter is a single fractionating column, 164 ft tall (50 metres)
lated. In this work, Probit methodology has been used as a with 70 distillation stages. It has an approximate volume
way of dealing with probabilities. The connection between of 3,700 barrels, and processes up to 45,000 BP of raffi-
Probit units (Y) and the percentage of affected population nate from the ARU. The blowdown system had to receive
is given in Table 4 (Eisenberg and Lynch, 1975). Probit quench and dispose hot hydrocarbon vapours and minor
units are calculated as follows: associated liquids from the ISOM relief, vent, and pump-
out systems during upsets or shutdowns. The blowdown
(14) system consisted on the relief pipe work headers, the F-20
unit and the Pump-Out Pump. Vapours dispersed from the
K1 and K2 are empirical constants and take respectively the top of the stack and liquids flew out of the drum through
values of -14.9 and 2.56 in the case of a fireball (Eisenberg a gooseneck into the site’s closed sewer system. F-20 is
and Lynch, 1975; www.mtas.es/insht/ntp/ntp_291.htm). V a vertical drum of 10-ft (3 metres) diameter with a 113-ft-
measures the intensity of the damage-causative factor. In high stack (34.5 metres).
Table 4. Probit units and percentages.
Probit % Probit % Probit % Probit % Probit %
0 0 3.92 14 4.42 28 5.10 54 5.92 82
2.67 1 3.96 15 4.45 29 5.15 56 5.99 84
2.95 2 4.01 16 4.48 30 5.20 58 6.08 86
3.12 3 4.05 17 4.53 32 5.25 60 6.18 88
3.25 4 4.08 18 4.59 34 5.31 62 6.28 90
3.35 5 4.12 19 4.64 36 5.36 64 6.41 92
3.45 6 4.16 20 4.69 38 5.41 66 6.48 93
3.52 7 4.19 21 4.75 40 5.47 68 6.55 94
3.59 8 4.23 22 4.80 42 5.52 70 6.64 95
3.66 9 4.26 23 4.85 44 5.58 72 6.75 96
3.72 10 4.29 24 4.90 46 5.64 74 6.88 97
3.77 11 4.33 25 4.95 48 5.71 76 7.05 98
3.82 12 4.36 26 5.00 50 5.77 78 7.33 99
3.87 13 4.39 27 5.05 52 5.84 80 8.09 99.9
376 Afinidad LXVI, 543, Septiembre-Octubre 2009In the ISOM unit, trailers were used as temporary offi- fatal accident and with the rest of the results derived from
ces. Several trailers involved in the incident were located the present work.
between two operating units, the ISOM and the Naphta
Desulphurisation Unit (NDU). The closest trailer (J.E. Merit 4.2. Effects of the explosion
trailer) was located at 150 ft (45.7 metres) from the base of Once it is known the amount of evaporated mass that ex-
F-20 and it was there where most of the fatalities occurred plodes, simple models, as TNT, TNO and BST were used
at the time of the explosion. In these trailers, fourteen out to estimate the damage caused by the overpressure of the
of the fifteen fatalities took place (BP fatal accident inves- explosion. Some standard damages caused by overpres-
tigation report, 2007). sure are shown in Table 2. These values let us set represen-
The gasoline flowed from the F-20 for 6 minutes, which tative limits of damage over the map of the plant. Results
resulted in a pool fire and a vapour cloud explosion. The obtained with these simple models were compared with
ignition source that leaded to the explosion and following those supplied by BP in a public report of the accident.
fire was probably a starting-up vehicle engine. The failure In the case of TNT, different explosion yields were taken
to institute liquid rundown from the tower, and the failure from 1% to 10 %, getting results of overpressure versus
to take effective emergency action, resulted in the loss of distance. As it is shown in Figure 6, results obtained for
containment that preceded the explosion. This was indi- explosion yields equal to 10% reproduce reasonably well
cative of the failure in following the established security what really happened in the accident, where the big ma-
policies and procedures. jority of fatalities occurred in J.E. Merit Trailer, which was
located at 45.7 m from the explosion and would suffer total
demolition according to the model. TNO model was also
5th Street
Tank Tank Tank Tank
used to calculate the overpressure at different distances.
Results are shown in Figure 7 and predict more severe
Avenue G Roadway effects than the previous model, including 90 % lung hae-
ccc morrhage in the people who were within the region whe-
B-1101
Superior
E-1101
re the trailer was located, apart from the total demolition
Catalyst
F-1102
Warehouse of the trailer. Finally, BST model was used with the same
F-1101 ISOM purpose, considering a 3D flame expansion, high fuel
reactivity and high obstacle density, leading to a value of
NDU
QA/QCTrailer
Pipe Rack
ISOM Satellite
Control Room
Mw=0.588. Figure 8 shows the effect of the explosion using
AU2
Fluor
Contech
Contech
I&E
I&E
the BST model and that the calculated damages using the
BST model were slightly more severe than those obtai-
BP Project Meeting
JE Menit Trailer
Timec
Timec Clay
James
James Hahn &
ned with TNO. In any of the cases, and as commented
N Approx above, this model also reproduces what happened in the
F-20
< 150 ft accident. It is important to notice that, when talking about
Flare Line from NDU to AU2
death, it is hard to simulate and get representative figures,
Avenue F Roadway due, mainly, to the domino effect that accompanies this
Aromatics Recovery Unit sort of accidents. That is the reason why we talk in terms
ULTRACRACKER Site of Turnaround
of building demolition and lung haemorrhage.
Plot Plan of Isomerization Unit (Not to Scale) Predicted damages caused by overpressure vary with the
applied model, increasing in the following order.
Figure 5. Scheme of the Isomeration plant of TNTbetween the vertical and horizontal lines, it means that this
damage would be produced at that distance taking into
account that model. Therefore, death threshold and trai-
ler position plotted in this figure show how TNO and BST
models predict more than 90% of death at nearest trailer
distance. Moreover, it is noticeable that at a distance up
to 125 m there are a total building destructions using the
TNO and BST models whereas with the TNT model these
destructions occurs up to 50 m and using a yield reaction
of 10 %.
Figure 6. Schematic representation of TNT mod-
el results for explosion yields from 1 to 10 %
and for different overpressure damages.
TNO MULTI-ENERGY
Figure 9. Comparison of the results obtained with dif-
ferent models applied to standard damages.
Despite the differences in the results got with the different
models, they all are in a similar and reasonably coherent
order of magnitude. It can be said that what really happe-
ned was an intermediate situation between the predicted
by the models.
Figure 7. Schematic representation of TNO Multi-Energy 4.3 Effect of thermal radiation
model results for different overpressure damages. The methodology explained in point 2.3. to calculate Pro-
bit units was applied from 5 to 150 metres. All the re-
sults are shown in Table 5. As it can be observed, at 45.7
metres (the distance of the nearest trailer) the probability
Baker-Strehlow is, theoretically, over 100 %. The 100 % death probability
threshold is situated at, approximately, up to 90 metres.
It slightly overestimates what really occurred, but it is de-
finitely in a reasonable order of magnitude. It can be ob-
served, that the 50 % of probability of death is reached at
distances close to 120 metres what demonstrates that this
types of accidents are very dangerous.
Table 5. Probability of death by thermal radiation up to 150 m.
Death pro-
X (m) t (s) Fvg IR (kW/m2) V Y
bability (%)
25 1.48 4.20 1953.4 183326 16.12 100
50 1.39 1.05 458.8 26568 11.18 100
75 1.34 0.47 196.6 8583.1 8.29 100
90 1.32 0.32 134.3 5164.1 6.99 98
Figure 8. Schematic representation of Baker-Strehlow- 100 1.31 0.26 107.8 3850.2 6.24 89
Tang model results for different overpressure damages. 110 1.30 0.22 88.3 2952.1 5.64 75
115 1.29 0.20 80.5 2608.2 5.24 60
Figure 9 compares overpressure values versus distance
120 1.29 0.18 73.6 2316.5 4.93 48
obtained with the three different models used in this work,
establishing critical distances and the associated dama- 125 1.28 0.17 67.6 2067.4 4.64 36
ge. In this Figure, horizontal lines represent different over- 130 1.28 0.16 62.3 1853.4 4.36 26
pressure threshold for certain damage, and the vertical 140 1.27 0.13 53.3 1507.6 3.83 12
line represents the nearest trailer position. When the curve 5
150 1.26 0.12 46.2 1243.9 3.34
predicted by a model is placed right to the intersection
378 Afinidad LXVI, 543, Septiembre-Octubre 20095. Conclusions 8. Eisenberg, N.A., Lynch, C.J., Breeding, R.J., (1975). Consequence analysis is a powerful tool to reproduce Vulnerability model. A simulation system for assess- damages occurred in a chemical plant accident. Though ing damage resulting from marine spills. National companies develop complex software that requires huge technology information service report, AD-A015-245, computation capacity, simple empirical models, such as Springfield, M.A. TNT, TNO or BST can be used with a reasonable degree 9. Finney, D.L., (1971). PROBIT analysis. Cambridge of accuracy, needing much shorter computation times and University Press, London. not so powerful equipment to deal with calculations. A 10. http://www.eia.doe.gov/emeu/consumptionbriefs/ spreadsheet excel and the Figures are enough to make all cbecs/cbecs_trends/figb8.gif (accessed on 27th Sep- the calculations. tember 2007). Evaporated mass calculation is a critical data to deal with 11. http://www.mtas.es/insht/ntp/ntp_291.htm, (ac- the rest of predictions. From empirical data, and making cessed on 27th September 2007). several simplifications, the value obtained was 4881.9 kg. 12. Lees, F.P., (1980). Loss prevention in the process in- Data obtained vary with the model applied, though all of dustries. Butterworth-Heinemann, London. them are within a reasonably narrow range. That suggests 13. Lobato, J., Cañizares, P., Rodrigo, M. A., Sáez, C., Lin- that the actual damages can be conceived as an interme- ares, J. J., (2006). A Comparison of Hydrogen Cloud diate situation between those predicted by the models. Explosion Models and the Study of the Vulnerability of Damages calculated for overpressure increase in the fol- the Damage Caused by an Explosion of H2. Interna- lowing order: tional Journal of Hydrogen Energy, 31, 1780-1790. TNT
You can also read