Contact-Based Methods for Measuring Respiratory Rate - MDPI
←
→
Page content transcription
If your browser does not render page correctly, please read the page content below
sensors
Review
Contact-Based Methods for Measuring
Respiratory Rate
Carlo Massaroni 1, * , Andrea Nicolò 2 , Daniela Lo Presti 1 , Massimo Sacchetti 2 ,
Sergio Silvestri 1 and Emiliano Schena 1
 1    Unit of Measurements and Biomedical Instrumentation, Department of Engineering,
      Università Campus Bio-Medico di Roma, Via Alvaro del Portillo, 21, 00128 Rome, Italy;
      d.lopresti@unicampus.it (D.L.P.); s.silvestri@unicampus.it (S.S.); e.schena@unicampus.it (E.S.)
 2    Department of Movement, Human and Health Sciences, University of Rome “Foro Italico”,
      00135 Rome, Italy; andrea.nicolo@yahoo.com (A.N.); massimo.sacchetti@uniroma4.it (M.S.)
 *    Correspondence: c.massaroni@unicampus.it; Tel.: +39-062-2541-9650

 Received: 4 January 2019; Accepted: 17 February 2019; Published: 21 February 2019

 Abstract: There is an ever-growing demand for measuring respiratory variables during a variety
 of applications, including monitoring in clinical and occupational settings, and during sporting
 activities and exercise. Special attention is devoted to the monitoring of respiratory rate because it
 is a vital sign, which responds to a variety of stressors. There are different methods for measuring
 respiratory rate, which can be classed as contact-based or contactless. The present paper provides
 an overview of the currently available contact-based methods for measuring respiratory rate. For these
 methods, the sensing element (or part of the instrument containing it) is attached to the subject’s
 body. Methods based upon the recording of respiratory airflow, sounds, air temperature, air humidity,
 air components, chest wall movements, and modulation of the cardiac activity are presented. Working
 principles, metrological characteristics, and applications in the respiratory monitoring field are
 presented to explore potential development and applicability for each method.

 Keywords: sensors; respiratory frequency; measurement; wearable; contact-based

1. Introduction
      There is an ever-growing demand for measuring respiratory variables during a variety of
applications. Respiratory rate, also known as respiratory frequency ( f R ), appears to be among the
most promising and measured variables because it provides fundamental information. In view of its
peculiar neurophysiological regulation, f R is very sensitive to a variety of physiological, psychological
and environmental stressors [1–3], and is considered to be one of the most informative vital signs [4,5].
Conversely, tidal volume (the other determinant of minute ventilation) plays a major role in satisfying
the metabolic requirements of the human body [1–3]. This explains why f R and tidal volume have
been defined as the behavioral and metabolic components of minute ventilation, respectively [1].
The differential control of f R and tidal volume justifies the special attention devoted to f R monitoring.
      There are different methods for measuring f R , which complicates the choice of the specific sensor
or measurement technique to use. Several factors need to be considered when measuring f R , including
applications, measurement requirements, and user needs. This choice is even more difficult in view of
the limited attempts made so far to classify and detail the numerous f R measuring methods used [6–8].
Therefore, we aim to provide an overview of the currently available methods for measuring f R . Given
the extent of the topic, this review focuses on the contact-based methods only, to guarantee that each
method is described in sufficient detail to enable the reader to make an informed choice on the f R
method to use.

Sensors 2019, 19, 908; doi:10.3390/s19040908                                       www.mdpi.com/journal/sensors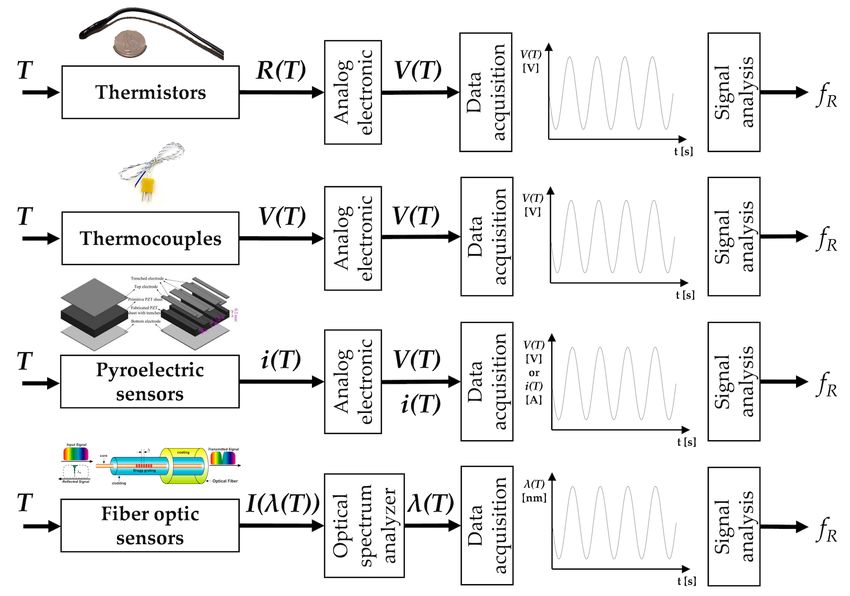
Sensors 2019, 19, 908                                                                                   2 of 47

     The paper is structured in nine sections. Section 1 provides a brief description of the importance
of monitoring f R in clinical settings, occupational settings, and during sporting activities and exercise.
Besides, Section 1 provides a taxonomy of the available techniques for measuring f R , which are
categorized according to the measurand. For each of the methods identified in the taxonomy, we have
dedicated a separate Section (from Sections 2 to 8), which consists of a brief introduction of the
measuring principle and a short overview of the most popular sensors that can be used to transduce
the physical or chemical quantity into a signal to extract f R . At the end of each section, a table
summarizes metrological properties, sensor characteristics and possible applications, and a short
summary describes strengths and weaknesses of the different sensors. Specifically, we describe
methods based on airflow (Section 2), respiratory sounds (Section 3), air temperature (Section 4),
air humidity (Section 5), air components (Section 6), respiratory-induced chest wall movements
(Section 7), and respiratory modulation of cardiac activity (Section 8). The last section is dedicated to
conclusions (Section 9).

1.1. The Importance of Respiratory Rate Monitoring
       Before dealing with the f R methods, we briefly describe the major applications where the
monitoring of f R is invaluable. A further aim is to increase awareness of the importance of measuring
f R . Indeed, despite a large body of evidence indicating that f R is a very relevant vital sign that responds
to a variety of stressors, this parameter has long been overlooked in the clinical field [4,9] as well as in
other fields [8].

1.1.1. Clinical Settings
      Substantial evidence indicates that f R is a very informative vital sign. It is an early indicator of
physiological deterioration [9,10] and a predictor of potentially serious adverse events [4]. Specifically,
f R is an important predictor of cardiac arrest and of intensive care unit admission [4] as well as
an independent prognostic marker for risk assessment after acute myocardial infarction [11]. Besides, it
is fundamental in the early detection of the risk of the occurrence of dangerous conditions such as sleep
apnea [12], respiratory depression in post-surgical patients [13] and sudden infant death syndrome [14].
Furthermore, f R is sensitive to several other pathological conditions including diabetic ketoacidosis,
toxicological issues, shock, pain, sepsis, allergic reactions and dehydration [5]. Yet, f R is overlooked
and under-recorded [4]. Suffice to consider that among four classic vital signs, f R is the only one that is
often measured clinically instead of with objective devices [5], and is frequently omitted from hospital
documentation [4]. The limited consideration given to f R is partially explained by the fact that there
are no clear indications on how f R should be measured in clinical settings, and that clinical staff has
low confidence in the methods currently used to assess f R [15]. Therefore, technological development
and validation studies [16] are required to fill the gap between the urgent need to accurately measure
f R in clinical settings and current clinical practice. The present review may help to reduce this gap.

1.1.2. Occupational Settings
     Technological development is driving an increasing interest in the monitoring of workers during
their activities, with the aim to improve health, well-being, and safety. Various multiparameter
wearable devices measuring f R have been developed and tested with the aim of monitoring workers
facing high levels of psychophysiological stress [17,18]. Monitoring f R during working activities is of
great value because f R is sensitive to cognitive load, emotional stress, environmental challenges, pain,
and discomfort, among other factors [3,19]. Specifically, f R has been proposed as a sensitive marker
of cognitive load, with important implications for workers exposed to highly demanding tasks and
weighty responsibilities, including pilots, soldiers and surgeons [19,20]. Besides, f R can be used as
an indicator of thermal stress because it is substantially influenced by body temperature [21]. This is
important for workers operating in hot environments as well as for those wearing protective clothing
and equipment that may interfere with thermoregulation, including firefighters [22].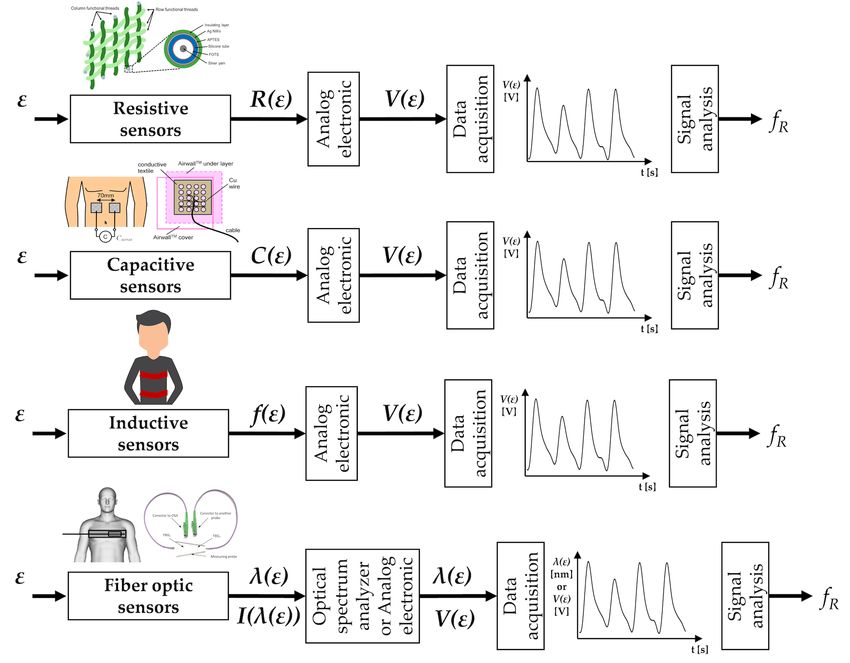
Sensors 2019, 19, 908                                                                                3 of 47

1.1.3. Sport and Exercise
     The importance of measuring f R during exercise has recently been reviewed by Nicolò et al. [8].
The authors make a point for f R being a better marker of physical effort compared to traditionally
monitored physiological variables such as oxygen uptake, blood lactate and heart rate [8]. Unlike these
variables, f R is closely associated with perceived exertion in a variety of exercise conditions [2,23–25]
and experimental interventions [8], and responds very rapidly to abrupt changes in work rate which
occur during intermittent exercise [8,25,26]. This is important because many sporting activities are of
intermittent nature, including soccer and other team sports. Measuring f R during exercise is not only
relevant for athletes but also for other populations. For instance, f R is associated with exercise-induced
dyspnea [27] and is a marker of exercise tolerance in patients with chronic obstructive pulmonary
disease [28]. Furthermore, f R can provide information on physical effort in cardiopathic patients who
have heart rate altered by pharmacological interventions such as beta blockers.
     However, the measure of f R during exercise has been neglected so far [8], and there is a paucity of
respiratory wearable devices that have been specifically designed for sporting activities. Yet, different
exercise modalities may introduce diverse methodological challenges that need to be faced, with motion
artifacts being a classical example. Therefore, a detailed overview of the contact-based techniques
for measuring f R may favor the development and use of respiratory devices designed for specific
applications, including the monitoring of f R during exercise.

1.2. Taxonomy of Available Techniques for Respiratory Rate Monitoring
      Different technologies are available for measuring f R . Such technologies may be classed in
contact-based and contactless. In contact-based measuring techniques, the sensor (i.e., the element
directly affected by the measurand) must be in contact with the subject’s body. Figure 1 shows
a classification of the most popular contact-based techniques for f R monitoring and the related area of
the body where the sensor must be positioned. In this review, we provide an overview of sensors
and measuring systems with different working principles, based on physical and chemical principles.
We have identified seven different techniques, categorized according to the measurand. Some of these
techniques have been split into subclasses: it is the case of chest wall movement sensors that can be
classed in sensors devoted to transducing chest wall strains, impedance changes, and tridimensional
motion caused by the respiratory activity. Similarly, several techniques can be used to retrieve f R
values and respiratory activity from the modulatory effect that breathing has on cardiac activity
(e.g., biopotential and light intensity modulation). In this review, the Table at the end of each section
provides a qualitative overview of:

      (i ) metrological properties:

•     sensitivity, according to the definition reported in the International Vocabulary of Metrology [29];
•     step response time, according to [29];
•     output linearity, according to [29];
•     accuracy, according to [29].

      (ii ) sensor characteristics:

•     Size (i.e., the size of the sensor used to collect the physical/chemical quantity);
•     Cost (including an estimate of the cost of signal conditioning electronics);
•     Real-time monitoring: ability to record the respiratory signal (and f R values) in real time;
•     Measurement intrusiveness: how the sensor or the measuring technique limits the subject’s
      activity and movements;
•     Sensitivity to body motion artifacts: sensitivity of a measuring technique to movements and
      motions not related to breathing that negatively affect the output signal;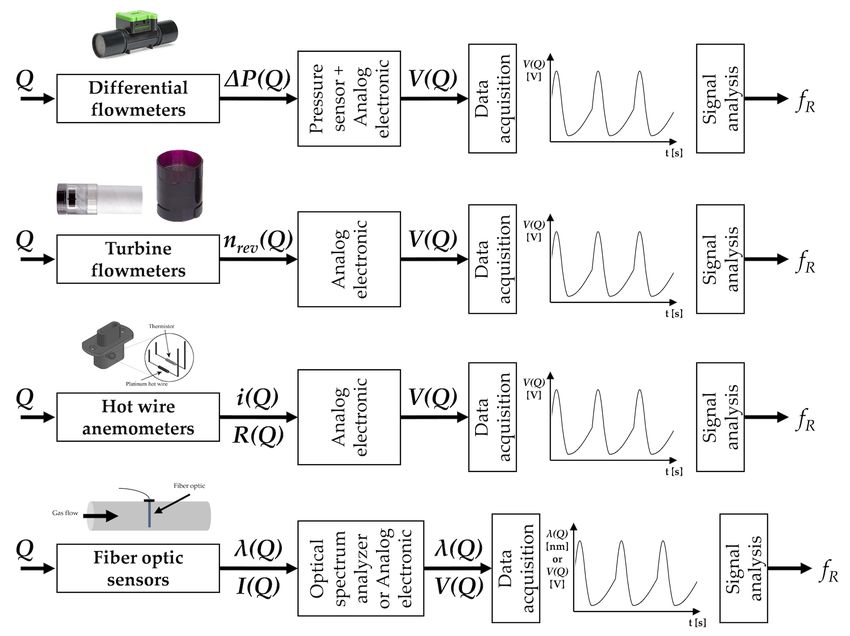
Sensors 2019, 19, 908                                                                                  4 of 47

•     Influence of environmental factors: influence of temperature, humidity, external strains and other
      environmental factors that can affect sensor measurement and consequently the sensor output;
•     Presence of wire: presence of tube, wires, and connections needed to supply the sensors, and/or
      register the physical/chemical quantity, and/or transfer the data for processing.

    (iii ) possible applications based on the aforementioned properties and characteristics. The typical
values of f R at rest measured in breaths per minute (in short bpm) vary with age. In this review, we
have considered the following applications related to specific breathing ranges (valid for adults with
age < 65 years old [30]):

•     slow breathing (in short SB) [31]: f R < 12 bpm
•     quiet breathing (in short QB) [31,32]: 12 bpm ≤ f R ≤ 20 bpm;
•     fast breathing (in short FB) [31]: f R ≥ 21 bpm

     While a f R ≥ 21 bpm is classified as FB at rest, values higher than 60 bpm are commonly registered
during high-intensity exercise [8]. Therefore, when possible, we provide more specific information on
the highest f R that can be registered with different sensors.

      Figure 1. Most popular contact-based techniques for measuring f R and related areas of the body on
      which the sensors must be positioned. PPG = photoplethysmography; ECG = Electrocardiography.

2. Techniques Based on Respiratory Airflow
     Different sensors can be used for measuring the volume and/or the velocity of the inhaled
and exhaled air during breathing. The temporal trend of volume or velocity allows to estimate f R .
Among others, differential flowmeters (DFs), turbine flowmeters, hot wire anemometers (HWAs) and
fiber-optic-based flowmeters have been investigated (see Figure 2).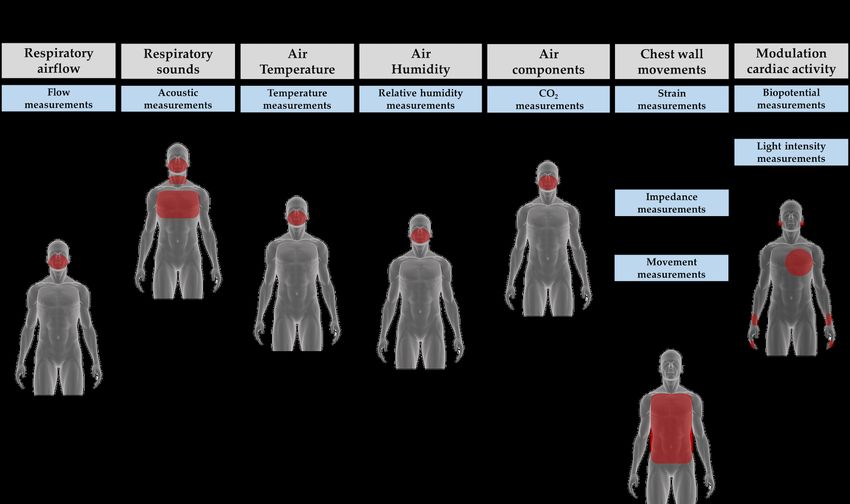
Sensors 2019, 19, 908                                                                                            5 of 47

      Figure 2. Airflow sensors: the main elements composing the measuring chain (sensor, analog
      electronics, data acquisition, post-processing or signal analysis stage) to estimate f R . Analog electronic
      stages vary between different flowmeters because the output quantities are different. ∆P( Q), nrev ( Q),
      i ( Q), R( Q), λ( Q), I ( Q) are pressure drop, turbine revolutions per minute, current, resistance,
      wavelength, and light intensity changes caused by the airflow (Q), respectively. V ( Q) is the voltage
      output. The DF figure is from Sensirion [33]; the turbine flowmeter figure is from MIR [34]; the HWA
      figure is from [35].

2.1. Flow Sensors

2.1.1. Differential Flowmeters
     DFs are largely used for collecting the temporal trend of inhaled and exhaled air during breathing.
In addition, DFs have gained broad acceptance as sensors for monitoring gases delivered by mechanical
ventilators and recorded by commercial spirometers [36,37]. This kind of flowmeters consists of
a pneumatic resistance placed within the pipe in which the gas flows. This resistance transduces the
gas flowrate (Q) within a pressure drop (∆P) with a well-known relationship. Accordingly, these
flowmeters need a secondary element which measures the ∆P value (i.e., a differential pressure sensor).
There are two main types of DFs used in the field of interest:

1.    Pneumotachographs. They can be subdivided into Fleisch, where the resistance consists of
      capillary tubes [38], and into Lilly, where the resistance is a fine wire mesh [39]. In both cases,
      Hagen-Poiseuille law may express the linear relationship between the output (∆P) and the
      input (Q):
                                                     8·µ·L
                                              ∆P =             ·Q                                     (1)
                                                    n · π · r4
      being µ the dynamic viscosity of the gas, and L, r, and n the length, the radius, and the
      number of the capillary, respectively. Although quadratic models have been investigated [40,41],
      the linear relationship (Equation (1)) is mostly used for pneumotachographs. Linearity and a good
      frequency response (response time in the order of tens of ms) are two key factors for the use of
      this flowmeter in respiratory monitoring, if an adequate differential pressure sensor is chosen.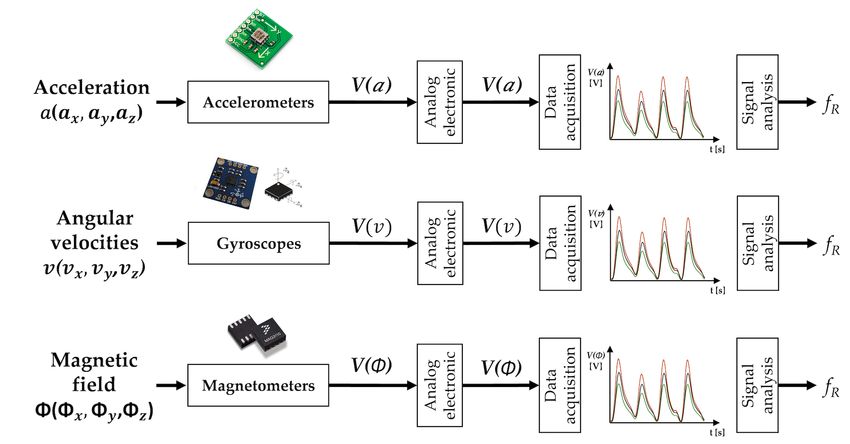
Sensors 2019, 19, 908                                                                                 6 of 47

      One potential concern is related to the influence of the gas composition and the temperature
      on the pneumotachograph response because these factors affect the value of µ in Equation (1).
      Nevertheless, this aspect is relevant for accurate flow measurements, while it can be neglected
      for the estimation of f R .
2.    Orifice meters. They can be split into fixed orifice meters, where the resistance is an orifice plate,
      and into variable orifice meters, where the plate composing the resistance increases its passage
      area with flowrate (e.g., it consists of a flexible flap [42,43]). In both cases, the input-output
      relationship (∆P vs. Q) may be expressed as follows:
                                                                √
                                                      d2            2 · ∆P
                                            Qi = p                                                       (2)
                                                     1−    β4        ρ

      where Qi is the flowrate calculated considering ideal conditions, d is the diameter of the orifice,
      β the ratio between the diameter of the orifice and the internal diameter of the pipe, and ρ the gas
      density. Therefore, the input-output relationship is not linear for fixed orifice meter; conversely,
      the increase of the passage area with flow in the variable orifice meter has the effect of linearizing
      the input-output relationship. As for pneumotachographs, they have a good frequency response
      when an adequate differential pressure sensor is chosen.

      DFs are used to monitor the trend of respiratory flows in both adults and infants since they are
designed to reach an ideal trade-off between sensitivity and additional resistance to the respiratory
system. Indeed, an adequate design of the resistance for both pneumotachographs and orifice
meters can adjust the sensitivity and the measuring range of these sensors allowing the development
of sensors able to either measure very low flowrates (100 L·min−1 ). In addition, DFs can discriminate between inhaled and exhaled
flows since they are bidirectional. However, the need to collect the entire inhaled and exhaled
airflow may pose an important problem because further resistance is added, and the presence of
a collector (e.g., a face-mask) may sometimes not be well tolerated by critically ill patients or even
athletes [6]. These flowmeters are largely used for respiratory monitoring. For instance, this kind of
flowmeter is embedded in medical devices (e.g., spirometers and mechanical ventilators). They are
often used as reference tools to assess new techniques designed ad hoc for f R (or respiratory function)
monitoring [44–46] because they measure the flow directly.

2.1.2. Turbine Flowmeters
     Similar to DFs, turbine flowmeters are used to collect respiratory temporal trends during breathing.
Several spirometers and metabolic carts embed this type of sensors. These flowmeters consist of
a turbine with flat blades in which the air ventilated by the patient is conveyed externally to the
distributor. The distributor is represented by a cylinder with slots on its surface. Slots orient the air
flow tangentially with respect to the blades [47]. The dimensional analysis of this turbine provides the
following equation:
                                             Q           nrev · D2
                                                   = f (           )                                  (3)
                                         nrev · D3           ν
where nrev is the turbine revolutions per minute, D is the inner diameter of the distributor, and ν is the
                                                                                   2
kinematic viscosity. The function n Q· D3 can be obtained as a function of nrevν· D (that is the number
                                     rev
of Reynolds), when ν is negligible. The mass of the blades is tens of mg, and this allows to obtain
a reduced moment of inertia with respect to the rotation axis. For this reason, the dynamic response is
excellent with a rise time much shorter than 10 ms [47]. The number of revolutions is typically collected
using a phototransistor that records the passage of the blade in front of it, providing an impulse for
each passage. The higher is the number of revolutions per minute, the higher is the Q in accordance
with the following Equation (4):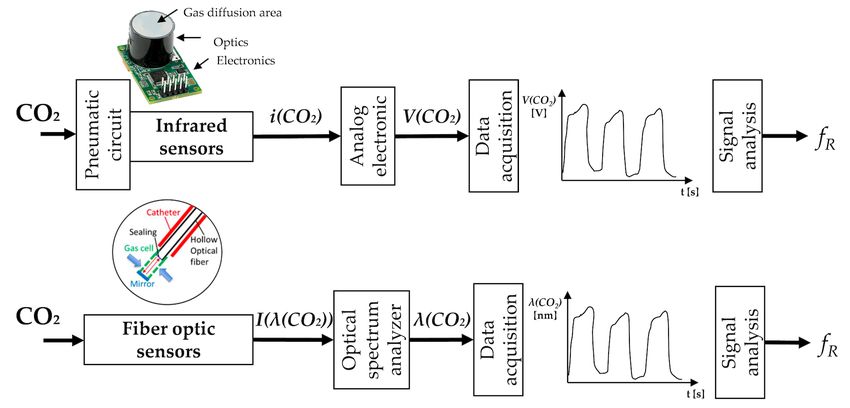
Sensors 2019, 19, 908                                                                             7 of 47

                                              Q = k · nrev                                           (4)

 For Reynolds number values greater than 800–1000, the ratio n·QD3 is constant: the relationship between
Q and nrev is linear, independent from fluid properties (e.g., ν) but dependent on the geometry of the
sensor [47]. An adequate design of the mechanical parts of the sensors can adjust their sensitivity
and the measuring range to allow the linear relationship in Equation (4) to be valid also at low Q
values (≤1 L·min−1 ). These sensors do not need any correction for temperature on exhalation and
are not affected by humidity or altitude changes [48]. Turbine flowmeters can be placed at the end
of a mouthpiece in which the patient can breathe (with the nose closed by a nose clip) or they can be
positioned at the distal extremity of a face-mask.
     Turbine flowmeters are used to measure the breathing pattern in the clinical practice [48] and to
extract respiratory variables and parameters (e.g., the f R , tidal volume, FEV1 and FVC) [49]. These
sensors show good performance in the estimation of the duration of inspiratory and expiratory
breathing phases, and of the respiratory period [50]. Turbine flowmeters are the most used sensors
in commercial certified portable spirometers (medical devices), and they are usually used to provide
reference measurements for the assessment of new measuring systems. In the field of exercise science,
most companies selling metabolic carts (e.g., COSMED S.r.l., Rome, Italy) adopt these flowmeters
in their instruments [51]. The validity of turbine flowmeters has been extensively demonstrated for
a wide range of f R values and during various exercise modalities of different intensities [8,52,53],
suggesting that turbine flowmeters are not affected by motion artifacts.

2.1.3. Hot Wire Anemometers
     Similar to DFs and turbine flowmeters, HWAs are used for collecting temporal trends of inhaled
and exhaled air during breathing, and they are embedded in several commercial mechanical ventilators
and spirometers [36]. These flowmeters consist of one or more heated wires exchanging heat with the
fluid flow. The equilibrium temperature of the wire (TW ) can be expressed as [54]:

                                      i2 · RW = h · S · ( TW − Tg )                                  (5)

where i is the current flowing through the wire, RW is the wire resistance, h is the coefficient of heat
transfer, S is the exchange surface, and Tg is the temperature of the gas. The King0 s law expresses the
relationship between h and the velocity of the gas (v) that hits the wire [55]:
                                                      q
                                         h = A+B·         (ρ · v)                                    (6)

where A and B are two empirical constants.
      As shown by Equations (5) and (6), HWAs have a nonlinear response with high sensitivity at
low Q values; hence they are mainly used for pediatric applications where Q is low. Due to the small
size of the wire (typical diameter of ∼10 µm), the dynamic response is excellent with a rise time
much shorter than 1 ms allowing a flat frequency response up to hundreds of Hz. The main concern
for the use of HWAs in f R monitoring is related to their fragility due to the small size of the wire.
Moreover, the typical configuration with a single wire is not able to discriminate the direction of the
flow, hence the use of more complex configurations based on at least two wires are used to discriminate
between inspiratory and expiratory phases [56]. HWAs are used to measure the breathing pattern
in clinical settings, showing good performances in the estimation of the duration of inspiratory and
expiratory breathing phases, and of the f R . They are embedded in several commercial medical devices
(mechanical ventilators and spirometers), and they are also used to provide reference measurements
for the assessment of new systems [57–59]. They are often used with face-masks, but other solutions
have also been proposed [60]. For instance, a tube-free configuration has recently been proposed as it
allows non-intrusive respiratory monitoring [61].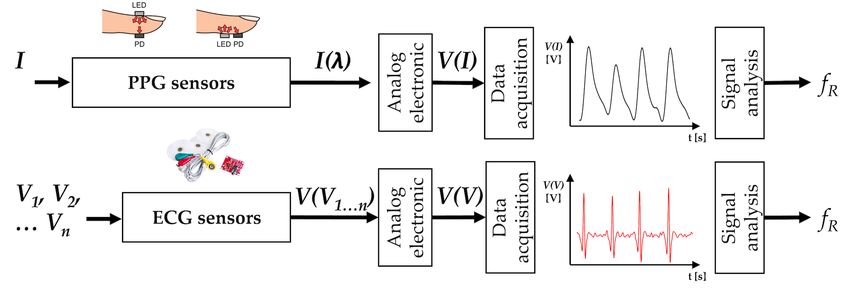
Sensors 2019, 19, 908                                                                                                  8 of 47

2.1.4. Fiber-Optic Based Flowmeters
     Different types of fiber-optic sensors (FOSs) have recently been proposed to monitor
flowrates. Among others, intensity-based FOSs, and fiber Bragg grating (FBG) sensors have
been investigated [62–67]. Intensity-based FOSs have been proposed for breathing pattern
monitoring [62,68–70]. The working principle of the flowmeters proposed in these articles is based
on the changes of coupled light power with a fiber bending caused by the inhaled or exhaled airflow.
Therefore, the light power measured by a photodetector represents the sensor output and depends on
Q. The high sensitivity allows detecting low airflow (
Sensors 2019, 19, 908                                                                                              9 of 47

2.2. Short Summary
     Flowmeters are used for respiratory activities monitoring because of their accuracy, sensitivity and
frequency response especially in the case of DFs, turbine flowmeters, and HWAs. These sensors must
be exposed to the air inhaled and exhaled by the subject. The consequence is that their measurement is
usually quite intrusive, although the small size of the sensing element in the case of turbine flowmeters,
HWAs and of fiber-optic-based flowmeters allows designing configurations that permit unobstructed
measurements. Because of the direct measurement of Q, flowmeters are often used as a reference tool
to assess new techniques designed ad hoc for f R monitoring (even on breath-by-breath basis). When all
the expired and inhaled flow is conveyed into the flowmeters, these sensors allow recording breathing
lung volume and tracking its changes. One of the main concerns related to the use of HWAs is their
fragility, while the DFs are more solid. Turbine flowmeters are good in a wide range of Q, and their
performance is unaffected by humidity, temperature, or altitude changes. Finally, fiber-optic-based
flowmeters may potentially have several advantages (small size, short response time, usability in
harsh environments) but their use is still at a relatively early stage. The first application in respiratory
monitoring on subjects was in 2010, even though no detailed description of their performance can be
found in literature.

3. Techniques Based on Respiratory Sounds
     During breathing, the sound generated by the air flowing through the patient’s throat and airways
may be collected to investigate the inspiration and expiration phases of breathing to estimate f R [72].
The respiratory sounds are characterized by broad spectrum noise with a frequency range depending
on the body location of the sensor (i.e., mouth, trachea or chest wall) [72]. Acoustic sensors adhering
to the skin can be used to measure these sounds. All the measuring techniques and related algorithms
can be referred to Computerized Respiratory Sound Analysis (CORSA). Standardization of CORSA
have recently been provided along with guidelines for breath sound recording [72].
     The working principle of acoustic sensors is based on their sensitivity to physical changes of
the environment surrounding the sound source. The most common sensors are microphones used to
record air pressure changes caused by the sound waves (see Figure 3) [73].

      Figure 3. Acoustic sensors: the main elements composing the measuring chain (sensor, analog
      electronics, data acquisition, post-processing or signal analysis stage) to estimate f R . P is the acoustical
      pressure; V ( P) is the voltage output. The acoustic sensor scheme is adapted from [74].

3.1. Acoustic Sensors

Microphones
     A microphone is a transducer that converts acoustic pressure variation into an electrical signal.
Different methods may be employed to accomplish this conversion: capacitors, electrets, moving-coils,
piezoelectric elements and fiber optics can be used as primary elements of the measuring chain [75].
     The most common primary methods of transduction employ capacitors. In the capacitor
microphones, one plate of the condenser is fixed while the other plate (i.e., the diaphragm), which is
Sensors 2019, 19, 908 10 of 47
very close to it, is free to vibrate when the sound strikes it [76]. As diaphragm moves in and out under
the influence of sound waves, the capacitance varies following Equation (7):
QE = C · E (7)
where Q E is the electrical charge on the plates, C is the capacitance, and E is the applied voltage
(across a variable capacitance). Typically, a battery is used to establish the charge to the condenser;
pre-polarized condenser elements (known as electrets) may also be alternatively used [76]. Additional
circuitry may be used to reduce electrical noise and to achieve wide dynamic ranges.
Dynamic microphones use the principle of magnetic induction in which a coil of wire produces
a small output voltage as it moves through a magnetic field. The voice coil is generally no larger
than 1 cm in diameter to cover the required audio frequency range. The voice coil is attached to
a light diaphragm (in aluminum or plastic) [76]. Dynamic microphones are relatively unaffected by
temperature or humidity.
Usually, the output provided by microphones is amplified, filtered in the bandwidth of 50–2500 Hz
and digitized by a sampling rate higher than at least 5 kHz [77].
During the inspiratory and expiratory phases, the relationship between tracheal sound amplitude
and flow can be represented with a power law curve [78]. Generally, the sound is recorded over
the suprasternal notch of the trachea since this part of the upper airways is generally not affected
by lung disease. The tracheal sound has a direct relationship with airflow and reaches frequency
values up to 1500 Hz under physiological conditions [77]. Alternatively, normal breath sounds can
be recorded at the level of the upper anterior chest wall. These breath sounds have approximately
similar intensities during the inspiratory and expiratory phases of breathing. When the microphone
is positioned on the posterior chest wall, abnormal breathing sounds may be identified because they
contain higher-frequency components and a higher intensity than that of normal breathing sounds [72].
The estimation of f R using an acoustical approach has recently gained popularity in clinical
settings. Different computational techniques can be used to obtain breathing information, as detailed
in [79]. f R can be monitored at the bedside using an adhesive sensor with an integrated acoustic
transducer positioned on the patient’s throat, as in [80]. When the adhesive sensor was compared to
a CO2 sensor used as a reference instrument, a bias of ∼0.0 ± 1.4 bpm was found, with f R ranging
from 6 to 24 bpm [80] (hereinafter the bias is reported as MOD ± LOA, obtained from Bland-Altman
analysis [81]. The bias was used to provide a quantitative values of the agreement between f R estimated
by the technique and reference values. MOD = mean of the differences; LOAs = limits of agreement,
calculated as 1.96 times the standard deviation of the f R measurements estimated by the two methods).
In [82] sounds were acquired in the same position and analyzed using a combined investigation
of the sound envelope and frequency content. Recently, a commercial device that monitors f R via
tracheal sounds has been introduced in clinical settings (Masimo Rainbow SET Acoustic Monitoring,
Masimo Corp., Irvine, CA, USA). However, only a few attempts have been made to develop portable
and unobtrusive devices measuring f R outside the clinical setting [83]. For instance, a miniaturized
and wearable system to estimate f R composed by a small sensor and a noise-robust algorithm has
been described in [83]. Good results have also been obtained using microphones embedded into
a smartphone; when compared to reference measurements (i.e., by a spirometer), a bias of 0.0 ± 1.5 bpm
was found for subjects breathing in a quiet room, with f R ranging from 15 to 35 bpm [78]. Using
the microphone of a Bluetooth headset (breath sounds were recorded at the level of the mouth),
breath-by-breath monitoring of f R was carried out during running activity in an outdoor scenario by
applying specific filters and a sound training phase to discriminate breath content from noise [84].
However, acoustical approaches remain extremely susceptible to background noise (i.e., music,
traffic, other people speech) and to subject activities not related to the breathing such as arms/legs
movements, speaking, coughing and swallowing. Furthermore, an appropriate placement of the
sensor is critical to obtaining accurate and reliable monitoring with this method [80], especially
outside the clinical scenario. Additionally, the actual f R estimation by acoustical means requiresSensors 2019, 19, 908 11 of 47
many more signal processing techniques [84,85] and investigations (i.e., heart sound cancellation [77],
body vibration/movement cancellation or attenuation [86]) than other techniques (e.g., based on the
air flow or temperature measurements). For these reasons, this technique does not usually allow
real-time monitoring of f R .
Table 2 summarizes the main metrological properties, sensors characteristics and applications of
the acoustic sensors used for f R monitoring.
Table 2. Main metrological properties and characteristics of the acoustic sensors used for f R
measurement. X good to excellent, ∼ sufficient, × poor.
Sensors Metrological properties Sensor characteristics Applications
X Sensor size
XSensitivity X Cost Apnea
XStep response time ∼ Real-time monitoring SB
Microphones X/× Output linearity * X Measurement intrusiveness QB
XAccuracy X Sensitivity to body motion artifacts FB
× Influence of environmental factors
∼ Presence of wire **
* it depends on the kind of sensor; ** it depends on the body area on which the sensor is attached (mouth, nose, chest wall).
3.2. Short Summary
Microphone sensors are becoming of interest to respiratory activity monitoring because of their
reduced encumbrance and because they can be embedded in wearable devices. However, acoustical
approaches remain susceptible to both background noise and subject activity not related to the
breathing. This measuring method is not generally recommended to record the respiratory waveform
over time. Some studies have demonstrated good performance in extremely structured environments
(i.e., intensive care unit). A few studies have been investigated this technique outside the clinical
scenario (i.e., sporting activities), but they lack preliminary validation studies.
4. Techniques Based on Air Temperature
During breathing, the exhaled air is warmer than the inhaled air which is at environmental
temperature. The temperature difference between inspired and expired air can reach approximately
15 ◦C [87]. Therefore, different kinds of temperature sensors allow estimating f R , based on the
temperature difference between exhaled and inhaled air.
Different technologies and working principles can be used to sense temperature changes related to
the breathing activity. From a plethora of available sensors, we report the most common electric-based
sensors (i.e., thermistors, thermocouples, and pyroelectric sensors) that are largely employed for
breathing patterns recording and for estimating f R values. In addition, a short description of FOSs is
provided since these kinds of sensor are gaining interest in f R monitoring (see Figure 4).Sensors 2019, 19, 908 12 of 47
Figure 4. Temperature sensors: the main elements composing the measuring chain (sensor, analog
electronics, data acquisition, post-processing or signal analysis stage) to estimate f R . Analog electronic
stages vary between different sensors since the output quantities are different. R( T ), V ( T ), i ( T ), I (λ( T ))
are resistance, voltage, current and light intensity changes caused by the temperature (T), respectively.
V ( T ) is the voltage output. The pyroelectric sensor figure is adapted from [88]; the fiber-optic sensor
figure is adapted from [89].
4.1. Temperature Sensors
4.1.1. Thermistors
The resistive thermometer (i.e., thermistor) is a type of resistor (made from certain metal oxides)
for which resistance is dependent on temperature. There are two types of thermistors: (i ) the negative
temperature coefficient thermistors, which show a resistance drop when the surrounding temperature
increases; (ii ) the positive temperature coefficient thermistors which show an opposite behavior
(the resistance increases with a temperature increment). Steinhart–Hart equation may express the
nonlinear relationship between temperature (T) and the resistance (R) [47]. By using an approximation,
the relationship can be expressed as in Equation (8):
1 1
R = R0 · exp β − (8)
T T0
being R the resistance at any temperature T, R0 the resistance at the reference temperature T0 , and β
a constant that depends on thermistor material [47]. Due to the nature of the basic process, the number
of conducting electrons increases exponentially with temperature. This pronounced non-linearity is
a disadvantage of thermistors and limits their temperature span to about 100 ◦C. However, thermistors
are characterized by high sensitivity in the temperature range of interest for respiratory monitoring
(i.e., 10–40 ◦C). Commercial thermistors are quite small (a few mm in diameter), but they have a quite
high response time (typically some seconds) which can jeopardize a correct analysis of breathing
pattern, especially in the FB case [90,91] and for real-time monitoring purposes. These sensors can be
used to measure the respiratory signal at the level of the nose in adults and infants given their small
size and low intrusiveness, in the clinical scenario. Since the sevenths, these sensors have been proven
to be sufficiently accurate to detect regularity of f R and apnea stages when compared to gold standardSensors 2019, 19, 908 13 of 47
techniques [92]. Given the relatively low cost (less than 10 dollars) and their ease-of-use, they are used
as reference instruments in several studies as in [93,94], during QB.
4.1.2. Thermocouples
A thermocouple produces a temperature-dependent voltage as a result of the thermoelectric
effect (Seebeck effect), i.e., the occurrence of an electric potential occurs when two different metals
are joined into a loop and the two junctions are held at different temperatures [95]. This Seebeck
electromotive force (em f ) is a voltage difference between the two ends of the conductor that depends
on the temperature difference between the ends and a material property called the Seebeck coefficient
σSeebeck as in Equation (9):
Z T2
em f Seebeck ( T2 ) − em f Seebeck ( T1 ) = σSeebeck ( T )dT (9)
T1
When wires of two different materials, A and B, are connected, the electromotive force that occurs
depends on the temperatures of the free ends of the two wires and the temperature of the junction
between the two wires. By considering the two free ends at temperature Tre f and the junction at
a temperature Tm , the voltage difference between the free hands may be written as in Equation (10):
Seebeck Seebeck
V = em f AB ( Tm ) − em f AB ( Tre f ) (10)
Seebeck ( T ) = em f Seebeck ( T ) − em f Seebeck ( T ) the relative Seebeck emf of materials A and B.
being em f AB A B
Some conductive materials and combinations are better than others to form a thermocouple [96].
The specific configuration may influence sensitivity, effects of corrosion, costs, and other characteristics.
The accuracy is similar to that of thermistors, with typical values of 1 ◦C (or ± 0.75% of the measurement
range) [47]. The response time of thermocouples is typically 0.5 s, although small-sized thermocouples
allow obtaining shorter response time [47]. This property encourages the adoption of such sensors also
in case of high values of f R which can occur in the clinical scenario [97]. Size of thermocouples which
can be used for respiratory monitoring are comparable to those of thermistors, so their field of use
is similar. Usually, the cost of thermocouples is higher than thermistors. Because of their size, these
sensors may be integrated into face-masks or placed under the nostrils or into the nose for monitoring
temperature during hypopnea [98–101].
4.1.3. Pyroelectric Sensors
Sensors based on pyroelectric effect may also be used to monitor the temperature of respiratory
airflow [91]. When a pyroelectric sensor is heated, the dipoles within the sensor exhibit random motion
by thermal agitation. This phenomenon causes a reduction in the average polarization of the transducer,
generating a charge build-up on the transducers. The output current (i.e., i) is proportional to the rate of
temperature change. The output voltage produced by the transducer across the amplifier with an input
resistance is related to the cross-sectional area of the transducer surface, the pyroelectric coefficient
of the piezoelectric transducer, the upstream and downstream electrodes average temperature [102].
The i from the pyroelectric sensor can be calculated from the Stefan–Boltzmann law as in:
2 · P · σB · a · γ ∆T
i= · b · T3 · 2 (11)
π·H·c Lo
where ∆T = Tb − Ta is the temperature gradient between the object and its surroundings, P is the
pyroelectric coefficient, σB is the Stefan–Boltzmann constant, a is the lens area, γ is the lens transmission
coefficient, H is the thickness, and c is the specific heat of the pyroelectric element, respectively, and Lo
is the distance to the object [103]. The i value is directly proportional to the ∆T.
Typical accuracy is ±1 ◦C, while typical response time is comparable with that of thermocouples,
or even better in the case of microfabricated pyroelectric sensors [104]. Since the sensors can assume
different shapes as cylindrical [91] or thin films [105], they may be embedded in a face-mask [91] or onSensors 2019, 19, 908 14 of 47
headphones near the nostrils [105] for respiratory monitoring purposes. In [105], an error of 1.12% on
the average f R value was found compared to data recorded by a thermistor.
4.1.4. Fiber-Optic Sensors
Recently, FOSs have been proposed to measure the temperature changes of the exhaled and
inhaled air during breathing. Among others, FBG sensors have been used in the respiratory field.
The principle of work is that the peak Bragg wavelength (λ B ) of an FBG sensor shifts to longer
wavelengths as the temperature increases, and towards shorter wavelengths when the temperature
decreases. The response is linear, and its temperature sensitivity coefficient is a function of the operating
wavelength and the material’s properties of the fiber in which the FBG is inscribed [106]. This change
may be expressed as follow [106]:
!
dni
∆λ B = λ B · α + dT · ∆T = λ B · (α + ζ ) · ∆T (12)
ni
being ni the refractive index of the fiber core, α the coefficient of expansion, ζ the thermo-optic
coefficient of the fiber, and ∆T the temperature change. Peculiarities of these sensors are their small
size (typical outer diameter of the fiber is 250 µm), the biocompatibility, the lightweight and the
intrinsic safety because light powers them. For these reasons, sensors may be placed close to the
patient nose or lips without causing discomfort and risks. Regarding the metrological properties, FBGs
are characterized by a typical response time of 10 ms and sensitivity of 10.0 pm/◦C that guarantee
excellent performance in the monitoring of breathing even at high frequency [107].
Usually, these sensors are embedded into a small probe for monitoring breathing to avoid
mechanical fiber breakage [108]. FBGs have been used to monitor the respiratory signal and f R
by placing the sensor in the nasal-cavity during MR imaging procedure [109]. Alternatively, FBGs
have been used to collect f R during mechanical ventilation by embedding the sensors in a small
probe [108–110]. Despite one FBG is quite inexpensive and its cost is comparable to that of thermistors,
the system used to interrogate the FBGs is expensive (more than 3000 dollars) and bulky. For this
reason, this technology is mainly used for research purposes and tests in laboratory environment, or in
particularly harsh environment (e.g., in the case of f R monitoring in MR room). In addition, FBGs are
intrinsically sensitive to strain, so when used for temperature measurements it is pivotal to avoid or
minimize mechanical strain.
Table 3 summarizes the main metrological properties and characteristics of the temperature
sensors specific for f R monitoring, and their field of use.
Table 3. Main metrological properties and characteristics of the temperature sensors used for f R
measurement. X good to excellent, ∼ sufficient, × poor.
Sensors Metrological properties Sensor characteristics Applications
∼ Sensor size
X Sensitivity X Cost Apnea
∼ Step response time ∼ Real-time monitoring * SB
Thermistors XOutput linearity ∼ Measurement intrusiveness
XAccuracy X Sensitivity to body motion artifacts
× Influence of environmental factors
× Presence of wire
X Sensor size
X Sensitivity ∼ Cost Apnea
X Step response time X Real-time monitoring SB
Thermocouples XOutput linearity ∼ Measurement intrusiveness QB
X Accuracy X Sensitivity to body motion artifacts FB
× Influence of environmental factors
× Presence of wireSensors 2019, 19, 908 15 of 47
Table 3. Cont.
Sensors Metrological properties Sensor characteristics Applications
X Sensor size
X Sensitivity ∼ Cost Apnea
X Step response time X Real-time monitoring SB
Pyroelectric sensors XOutput linearity ∼ Measurement intrusiveness QB
X Accuracy X Sensitivity to body motion artifacts FB
× Influence of environmental factors
× Presence of wire
X Sensor size
X Sensitivity × Cost ** Apnea
X Step response time X Real-time monitoring SB
Fiber-optic sensors XOutput linearity ∼ Measurement intrusiveness QB
X Accuracy X Sensitivity to body motion artifacts FB
× Influence of environmental factors
× Presence of wire
* real-time monitoring is not possible for QB, FB; ** it includes the cost of optical spectrum analyzer to power
the sensors and record the data.
4.2. Short Summary
Temperature sensors may be used for monitoring f R . Depending on their response time (from
10 ms for FOSs up to some s for thermistors), temperature sensors can allow the monitoring of apnea,
SB, QB, and FB. Thermistors typically present a quiet slow response time, hence their use is discouraged
for quiet and fast f R monitoring, where other temperature sensors are preferable. Temperature sensors
are usually placed at the level of the nostrils or/and lips and integrated into mechanical supports or
face-masks to give mechanical stability to the sensor and reduce the sensitivity to body movements.
All temperature sensors require to be exposed to the air exhaled and inhaled by the subject. For this
reason, the measurements are intrinsically obtrusive; however, these sensors generally allow recording
the respiratory waveform over time and the f R analysis on a breath-by-breath basis. In the case of
FOSs, wires are needed to supply the power to the sensor and to deliver light. The sensitivity to
environmental factors, the obtrusiveness and the presence of wires may limit the applicability of
temperature sensors to indoor controlled environments (e.g., during imaging procedures) and in
clinical settings (e.g., intensive care unit, geriatrics), while they are seldom employed in the monitoring
of athletes especially in outdoor scenarios.
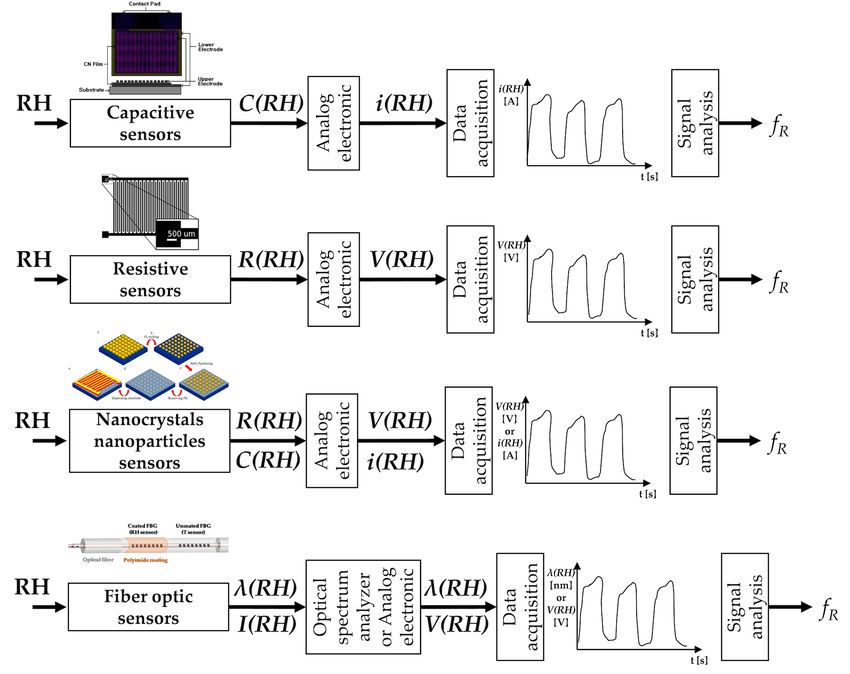
5. Techniques Based on Air Humidity
The inhaled and exhaled air differ in the content of water vapor. Therefore, different types of
sensors and configurations have been proposed to estimate the respiratory signal from the difference
of water vapor contents between inhaled and exhaled air. Indeed, inhaled air is at environmental
conditions (relative humidity (RH) from 40% to 80%), while the exhaled air is at body temperature
and saturated by vapor (RH = 100%) [111]. Among others, electrical and FOSs have been mainly
investigated for respiratory monitoring purposes (see Figure 5).
The principle of work of the electric humidity sensors is based on the sensitivity of one electric
parameter to RH. The most common ones are based on the change of capacitance and of resistance
with RH. Recently, new solutions based on nanoparticles, nanocrystals, and graphene have been
investigated. Among FOSs, FBGs, and long-period grating sensors are used in this application.Sensors 2019, 19, 908 16 of 47
Figure 5. Relative humidity sensors: main elements composing the measuring chain (sensor, analog
electronics, data acquisition, post-processing or signal analysis stage) to estimate f R . Analog electronic
stages vary between different sensors since the output quantities are different. C ( RH ), R( RH ),
λ( RH ), I ( RH ) are capacitance, resistance, wavelength, and light intensity changes caused by the RH,
respectively. V ( RH ) is the voltage output, i ( RH ) is the current output. The capacitive sensors picture
is adapted from [112]; the resistive sensors picture is from [113]; the nanocrystals and nanoparticles
sensors image is from [114]; the fiber-optic humidity sensors picture is adapted from [115].
5.1. Humidity Sensors
5.1.1. Capacitive Sensors
The working principle of capacitive sensors for RH measurements is related to the capacitance
change with the dielectric properties of the material interposed between the two electrodes of the
capacitance [116]. This type of sensors is the most used in RH measurements, representing more
than 75% of the market [117]. Although different configurations have been investigated, usually,
a sandwiched structure with two electrode surfaces on each side or an interdigitated structure with
comb electrodes are used. A dielectric material (i.e., polymer film or ceramic material) is deposited
between the two electrodes; it is usually made of a porous material that either absorbs water vapor
when the environmental RH rises or releases it when RH decreases. The dielectric properties of the
material change with the amount of absorbed water vapor and therefore with the environmental
RH. Since the sensor’s capacitance depends on the dielectric properties, its changes can be used as
an indirect measurement of RH. Usually, an appropriate electronic circuit allows transducing the
capacitance within an electric signal that represents the sensor output. The estimation of the f R is
based on the cyclic changes of the sensor’s output due to RH changes during the two respiratory
phases. These sensors show good linearity and accuracy (around 3%); the rise time is usually of some
seconds although faster solutions have been proposed [116].Sensors 2019, 19, 908 17 of 47
5.1.2. Resistive Sensors
The principle of work of resistive sensors for RH estimation is based on the electrical impedance
change with humidity. Therefore, RH values are estimated starting from the changes of electrical
conductivity of the sensing films [116]. A specific electronic circuit allows the transduction of the
resistance into a voltage signal, which represents the sensor’s output. Several studies have shown the
potential of resistive RH sensors for monitoring f R and for detecting apnea stages. During the 1980s,
this capability was shown on patients and volunteers using a resistive sensor with a rise time of almost
10 s [118]. Faster resistive sensors have been proposed in the literature and assessed in the laboratory
or using simulated breathing patterns [119–122]. Recently, a new instrumented mask embedding one
of this type of sensor has been assessed on humans, showing good performance in the estimation of f R
(limits of agreement of ±1 bpm) [10,123]. Resistive RH sensors have also shown good performance up
to very high f R values (e.g., up to 240 bpm) [10]. Recently a fast and ultra-sensitive electrical humidity
sensor was also tested for f R monitoring on humans and on rats [124]. Thanks to the high resolution
(0.1%) and fast response time (37 ms) it was able to monitor the f R on rats that have smaller tidal
volume and higher f R than humans.
5.1.3. Nanocrystals and Nanoparticles Sensors
The investigation of sensors for RH monitoring fabricated with nanocrystals, nanoparticles and
graphene-based nanocomposites has been encouraged by the high ratio between exchange surface
and volume, so different solutions have been proposed [125–127]. For instance, the resistance of
a thin film of SiO2 nanoparticles which non-linearly changes with RH has been proposed for f R
monitoring [125]. The response and recovery time of the sensor were approximately 1 s. The authors
assessed the capability of the sensor to follow f R values up to approximately 100 bpm at rest and it
is also able to both monitor respiratory signal and discriminate respiratory phases during exercise.
The same group fabricated a flexible nanocrystal-based RH sensor with a response/recovery time
of 40 ms [128]. The system was assessed on humans and showed the capability to follow breathing
patterns, although its output was not compared with a reference system. A cost-effective sensor
($0.005 for materials for the paper chip and $1.50 for the mask) based on the changes of resistance of
a paper with printed graphite electrodes has been also investigated for respiratory monitoring [129].
The sensor was embedded into a mask and showed the ability to follow f R at rest and during walking
up to 60 bpm.
5.1.4. Fiber-Optic Sensors
RH sensors based on fiber optics are gaining broad acceptance for application in f R monitoring.
Among others, FBGs and long-period grating sensors have been largely investigated in this
field [130,131]. Since they can sense only physical parameters (i.e., temperature and strain), polymer
and nanoparticle-based coatings are used to make FBGs and long-period gratings sensitive to
RH [132,133]. The coatings are made of hygroscopic materials that absorb or desorb environmental
water vapor in response to RH changes. This phenomenon induces changes in the gratings behavior
making it able to detect RH changes [134–136]. Also, interferometric-based FOSs have been used for
this application. Solutions based on hygroscopic materials which cause a shift in the interference
pattern due to the sorption of water vapor have been proposed [137].
The metrological properties of these sensors strongly depend on the material coatings and the
coating thickness. For instance, the response time ranges from tens of ms to tens of s [138,139].
The capability of RH sensors based on fiber-optic technology to monitor f R has been investigated
using several configurations. Interferometric-based ones have shown the ability to follow breathing
patterns [140], but the authors did not used a reference to assess the performance of the sensor.
Sensors based on optical fiber gratings have been tested during mechanical ventilation [110,141,142].
The sensor was assessed by analyzing its capability of estimating the f R during mechanical ventilationSensors 2019, 19, 908 18 of 47
from 12 bpm to 24 bpm [143] and on humans, during QB. During the assessment on humans the
results provided by the proposed system were compared with f R values estimated by a reference
(i.e., by a spirometer). The experiments showed good agreement between the two techniques with
an absolute value of the percentage errors lower than 2.07%, with f R values up to 35 bpm [144].
A simple intensity-based sensor able to discriminate inspiratory and expiratory phases due to the
condensation on an optical fiber tip placed in front of one of the two nostrils has been also assessed
on 10 smoking men. The system showed the ability to follow the breathing signal during QB and to
discriminate apnea phases [145].
Table 4 summarizes the main metrological properties and characteristics of the RH sensors specific
for f R monitoring, and their field of use.
Table 4. Main metrological properties and characteristics of the humidity sensors used for f R
measurement. X good to excellent, ∼ sufficient, × poor.
Sensors Metrological Properties Sensor Characteristics Applications
∼ Sensor size
X Sensitivity X Cost Apnea
× Step response time * X Real-time monitoring SB
Capacitive sensors XOutput linearity ∼ Measurement intrusiveness QB **
XAccuracy X Sensitivity to body motion artifacts
× Influence of environmental factors
× Presence of wire
∼ Sensor size
X Sensitivity X Cost Apnea
∼/× Step response time *** X Real-time monitoring SB
Resistive sensors XOutput linearity ∼ Measurement intrusiveness QB **
XAccuracy X Sensitivity to body motion artifacts FB **
× Influence of environmental factors
× Presence of wire
∼ Sensor size
Nanocrystals and X Sensitivity X Cost Apnea
nanoparticles X/ ∼ Step response time **** X Real-time monitoring SB
sensors XOutput linearity ∼ Measurement intrusiveness QB
XAccuracy X Sensitivity to body motion artifacts FB **
× Influence of environmental factors
× Presence of wire
X Sensor size
X Sensitivity × Cost Apnea
X/ ∼ Step response time X Real-time monitoring SB
Fiber-optic sensors XOutput linearity ∼ Measurement intrusiveness QB
XAccuracy ∼ Sensitivity to body motion artifacts FB
∼ Influence of environmental factors
× Presence of wire
* usually some s, but in some cases ∼300 ms; ** it depends on the kind of sensor: QB and FB monitoring is
possible only with sensors with short response time; *** in some cases 10 s, but in some casesSensors 2019, 19, 908 19 of 47
respiratory waveform over time. These sensors have been used in extremely structured environments
(e.g., intensive care unit), but rarely during exercise and in outdoor applications.
6. Techniques Based on Air Components
During breathing, the content of oxygen and carbon dioxide (CO2 ) differs between the inhaled
and exhaled air as a result of cellular respiration. The CO2 percentage fluctuates from typically 0.04%
(You can also read