Coping with Unsustainability - POLICY GAP 7 Lonmin 2003 - 2012 The Bench Marks Foundation
←
→
Page content transcription
If your browser does not render page correctly, please read the page content below
Coping with Unsustainability

            POLICY GAP 7
          Lonmin 2003 – 2012
        The Bench Marks Foundation
               October 2013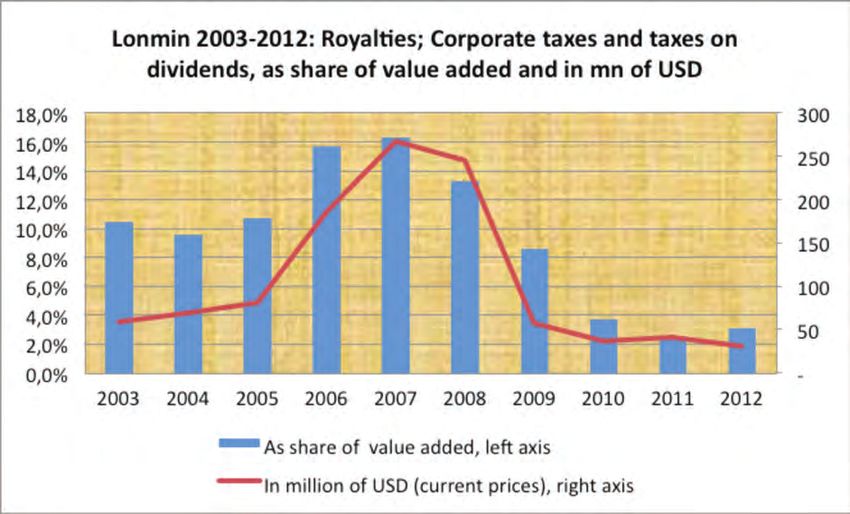
The Bench Marks Foundation

PO Box 62538

Marshalltown 2107

Johannesburg South Africa

Tel/Fax: +27 11 832-1750

Tel: +27 11 832-1743/2

www.bench-marks.org.za

ii | Policy Gap 7
Coping with Unsustainability

           Policy Gap 7
        Lonmin 2003 – 2012

    The Bench Marks Foundation
           October 2013

                                 Policy Gap 7 | iii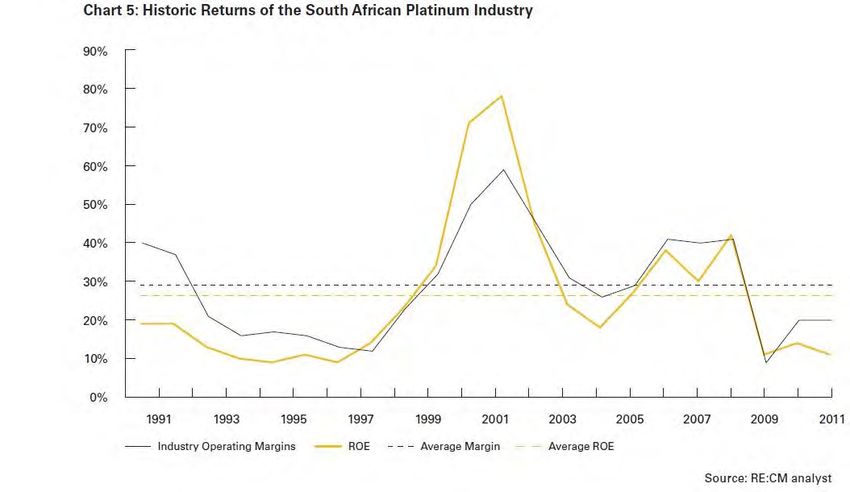
Table of Contents
List of Tables ...........................................................................................................................................................vi
List of Figures ...........................................................................................................................................................vi
Acronyms and Abbreviations...................................................................................................................................vii
Acknowledgments.................................................................................................................................................. viii
The Bench Marks Foundation...................................................................................................................................ix
Foreword ........................................................................................................................................................... x
Executive Summary.................................................................................................................................................xii
1. Introduction.................................................................................................................................................. 1
1.1 Lonmin............................................................................................................................................... 1
1.2 Methodology and focus..................................................................................................................... 2
1.3 Key discussions and findings.............................................................................................................. 2
1.4 Scope and Organisation of the Report............................................................................................... 3
2. Workers and Profits....................................................................................................................................... 4
2.1 The rise of platinum mining and the “profit crisis”............................................................................ 4
2.2 Anglo American Platinum.................................................................................................................. 4
2.3 Profitability and shareholder value.................................................................................................... 4
2.4 The use of contract workers and two responses to the crisis............................................................ 6
2.4.1 AAP cuts contract workers...................................................................................................... 6
2.4.2 Lonmin’s approach.................................................................................................................. 6
2.4.3 The confusion in Lonmin’s contract work reporting............................................................... 7
2.4.4 The confusion in general contract work reporting................................................................. 7
2.4.5 Platinum industry wages........................................................................................................ 8
2.4.6 Gold industry wages............................................................................................................... 9
2.4.7 High share of contractors in the platinum industry................................................................ 9
2.5 Wages and Profits............................................................................................................................ 10
2.5.1 Dividing Value Added between Profit and Wages................................................................ 10
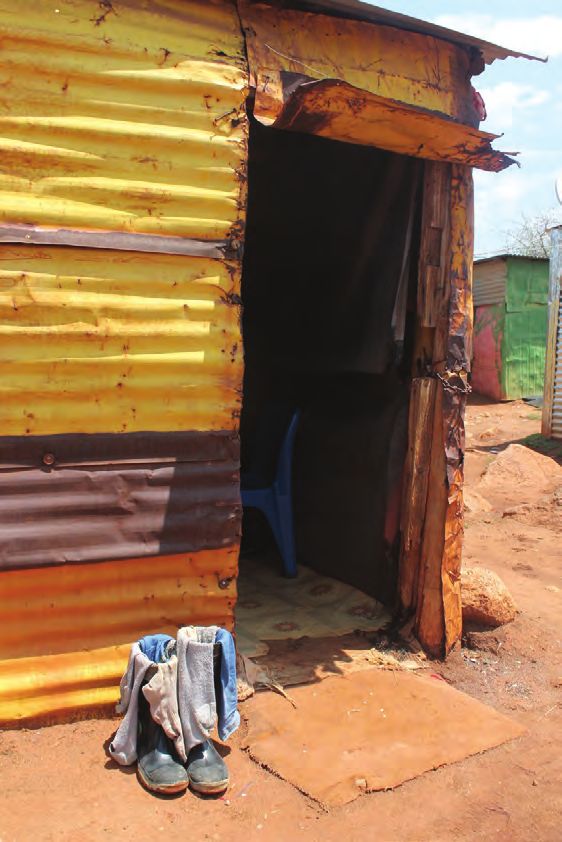
2.5.2 Taxes..................................................................................................................................... 11
2.5.3 Executive Pay........................................................................................................................ 11
2.5.4 Shareholder value................................................................................................................. 12
2.5.5 Social Capital......................................................................................................................... 12
3. Housing....................................................................................................................................................... 17
3.1 House construction programmes..................................................................................................... 17
3.1.1 2003...................................................................................................................................... 17
3.1.2 2004...................................................................................................................................... 17
3.1.3 2005...................................................................................................................................... 18
3.1.4 2006 - 2010........................................................................................................................... 18
3.1.5 2011...................................................................................................................................... 18
3.1.6 2012...................................................................................................................................... 19
3.2 Are the workers able and willing to buy the houses?...................................................................... 19
iv | Policy Gap 7
3.3       A programme of conviction or compliance?.................................................................................... 20
      3.4       What is the status of the Mining Charter?....................................................................................... 21
      3.5       SDRs: Stories to confuse.................................................................................................................. 21
      3.6       The issue of the mining hostels....................................................................................................... 21
                3.6.1 The hostel conversion programme 2003 to 2012................................................................. 21
                3.6.2 Mining hostel number confusion 2011 - 2012...................................................................... 23
                3.6.3 Hostel Conversion Record 2003 to 2012............................................................................... 25
      3.7       So where do Lonmin’s employees live?........................................................................................... 26
4.    Environmental Issues: always on the road to zero impact.......................................................................... 27
      4.1       What about the environment?........................................................................................................ 27
                4.1.1 The issue of “Community Perception”................................................................................. 27
      4.2       No permanent damage.................................................................................................................... 30
      4.3       Dust emissions, legal limits and zero harm...................................................................................... 30
                4.3.1 The original commitment..................................................................................................... 30
                4.3.2 2003 - 2006........................................................................................................................... 30
                4.3.3 2007...................................................................................................................................... 31
                4.3.4 2008 - 2009........................................................................................................................... 31
                4.3.5 2010...................................................................................................................................... 31
                4.3.6 2011...................................................................................................................................... 31
                4.3.7 2012...................................................................................................................................... 32
      4.4       Sulphur dioxide, legal limits and zero harm..................................................................................... 32
                4.4.1 2003...................................................................................................................................... 32
                4.4.2 2004 and 2005...................................................................................................................... 33
                4.4.3 2006...................................................................................................................................... 33
                4.4.4 2007...................................................................................................................................... 33
                4.4.5 2008...................................................................................................................................... 34
                4.4.6 2011...................................................................................................................................... 34
                4.4.7 2003 to 2012 Summary........................................................................................................ 34
      4.5       Water............................................................................................................................................... 35
      4.6       The calcium sulphite solution to the SO2 problem........................................................................... 35
5.    Conclusions and Recommendations........................................................................................................... 38
      5.1       Conclusions...................................................................................................................................... 38
      5.2       Recommendations........................................................................................................................... 39
                5.2.1 Contract workers.................................................................................................................. 39
                5.2.2 Failure to comply with the Mining Charter........................................................................... 39
                5.2.3 Failure to comply with the Codes of Good Practice for the Minerals Industry..................... 40
                5.2.4 False reporting...................................................................................................................... 41
5.3   A final word................................................................................................................................................. 41
References      ......................................................................................................................................................... 42
Endnotes        ......................................................................................................................................................... 45

                                                                                                                                                     Policy Gap 7 | v
List of Tables Table 1: Social Capital spending details 2004......................................................................................................... 14 Table 2: Lonmin “Social Capital” spending details 2005 and 2006......................................................................... 15 Table 3: Allocation of R18.6 million paid to Lonmin Trust Fund in 2006................................................................ 15 Table 4: Mining hostel conversions 2003-2012...................................................................................................... 25 Table 5: Lonmin sulphur dioxide emissions compared to legal limits 2003-2012.................................................. 34 List of Figures Figure 1: Anglo American Platinum, Impala and Lonmin operating margins and Return on Investment................ 5 Figure 2: Employment at AAP and Lonmin compared.............................................................................................. 6 Figure 3: PGM 2005-2012 Average nominal monthly wages by category of employees......................................... 8 Figure 4: Lonmin contractor proportion of workforce and average labour cost 2003-2012.................................... 9 Figure 5: Lonmin’s payments to SA government 2003-2012.................................................................................. 11 Figure 6: Lonmin dividend payments 2003-2012................................................................................................... 12 Figure 7: “Social Capital” and remuneration of Lonmin directors 2003-2012........................................................ 13 Figure 8: Perception of Lonmin in surrounding communities 2004....................................................................... 28 vi | Policy Gap 7
Acronyms and Abbreviations
AAP     Anglo American Platinum
AIDC    Alternative Information and Development Centre
AMD     Acid Mine Drainage
CAR     Corporate Accountability Reports
CaSO3   Calcium Sulphite
CEO     Chief Executive Officer
CoE     Centre of Excellence
CSR     Corporate Social Responsibility
DMR     Department of Mineral Resources
ESSET   Ecumenical Service for Socio – Economic Transformation
GDP     Gross Domestic Product
GLC     Greater Lonmin Community
ICCR    Interfaith Centre on Corporate Responsibility
IMF     International Monetary Fund
LCDT    Lonmin Community Development Trust
LRS     Labour Research Service
MPRDA   Mineral and Petroleum Resources Development Act
NA      Not applicable
NDA     No data available
NGO     Non Governmental Organisation
OECD    Organisation for Economic Co-operation and Development
PGM     Platinum Group Metal
Plc     Public limited company
RDO     Rock Drill Operator
RDP     Reconstruction and Development Plan
SACC    South African Council of Churches
SDR     Sustainable Development Report
SLP     Social and Labour Plan
SO2     Sulphur dioxide
TCCR    Taskforce on Churches and Corporate Responsibility
US$     United States Dollars
VAS     Value Added Statement
WPM     Western Platinum Mine

                                                                 Policy Gap 7 | vii
Acknowledgments This research was commissioned by the Bench Marks Foundation and was conducted by Dr Dick Forslund of Alternative Information and Development Centre (AIDC) on our behalf. This work is owned by the Bench Marks Foundation and all copyright belongs to the Foundation. The Bench Marks Foundation wishes to acknowledge the other contributors to this report: John Capel for setting the terms of reference, for comments and for editing of the study and Roger Etkind for the final edit. Ilan Strauss MSc, consultant at African Development Bank, and Prof Eddie Bain of the North West University, Bench Marks Centre, for their work in peer reviewing the text and their valuable suggestions. They are of course not responsible for any shortcomings or errors in the final report. Ds Piet Beukes, Bench Marks Board member, for his contribution to the final report, his eye for detail and general comments around structure and final editing. Yazeed Kamaldien for the cover photograph of a mineworker’s shack in the Wonderkop townshop near Lonmin’s Marikana mine. We would also like to thank our partners for contributing to this research study: • Christian Aid • Church of Sweden • Diakonia Sweden • Multi Agency Grant Initiative-Hivos • ICCO-Kerk in Actie • Norwegian Church Aid This study does not necessarily represent the views of the supporting donor partners. viii | Policy Gap 7
The Bench Marks Foundation
Bench Marks Foundation is an independent non-governmental organisation established by the South
African Council of Churches (SACC), the Ecumenical Service for Socio–Economic Transformation (ESSET),
Industrial Mission of South Africa, CDT Foundation and the Justice and Peace Department of the South
African Catholic Bishops Conference.

Its international partners are:

•     The Interfaith Centre on Corporate Responsibility (ICCR) – USA.

•     The Taskforce on Churches & Corporate Responsibility (TCCR) – Canada.

•     The Ecumenical Council for Corporate Responsibility – UK.

•     The Christian Centre for Socially Responsible Investment – Australia.

Together with our international partners we share a measurement instrument called the Principles
for Global Corporate Responsibility: Bench Marks for Measuring Business Performance. This is a
comprehensive set of social, economic and environmental criteria and business performance indicators
drawn from a body of internationally recognised human rights, labour and environmental standards
and principles.

The Bench Marks Foundation is mandated by the churches to monitor the investment practices of
multinational corporations to ensure that they respect human rights, operate in a way that protects
the environment and do not externalise costs, that profit making is not done at the expense of other
interest groups and that those most negatively impacted upon are heard, protected and accommodated
within the business plans of the corporation.

The Bench Marks Foundation works with research institutions, its joint project called the Bench
Marks Centre at the North West University, NGOs and religious and community organisations across
the Southern African Development Community. It does evidence based research and strengthens
communities to engage on a more level footing with corporations and governments through the Bench
Marks Monitoring School. It promotes public awareness through media outlets, websites, blogs and
Facebook. It has produced many reports, articles, opinion pieces and written in many academic journals.

Archbishop Desmond Tutu launched the Foundation in 2001 and an office was established in 2003 in
Johannesburg. The Rt. Rev Dr Jo Seoka chairs the organisation and is the founding chairperson of the
Foundation.

What are the Bench Marks Aims and Concerns?

Bench Marks aim is to ensure that the operations of big corporations do not in any way undermine
community life and destroy the environment and that investment is done in a way that respects the
integrity of creation, is just, equitable and promotes human development.

The Bench Marks concern is that private corporations, often with the support of government leaders,
make very large profits while communities suffer high levels of inequality and poverty. The Bench
Marks Foundation is equally concerned about the destruction of our air, water and soil resources that
results from industrial activities such as mining.

                                                                                         Policy Gap 7 | ix
Foreword Policy Gap 7 is the Bench Marks Foundation’s latest study. It focuses on CSR and Mining, but in this case on one specific mining company: Lonmin. In this study we look at Lonmin’s reporting of itself over a period of around 10 years in its corporate Social Development Reports. It seems as if the Corporate Social Responsibility (CSR) discourse is all about reporting in order to be seen to be making progress. However, mining also has a number of disastrous side effects. As much as mining has contributed to developing the South African economy (the city of Johannesburg itself bearing testimony to this) it also has negative economic, social and environmental consequences. Mining uproots and displaces people, causing social disintegration, along with environmental repercussions for the very same people, with far reaching consequences for the country as a whole. It sacrifices the health of surrounding communities as well as workers. Working often deep underground in sub-human temperatures is not what anyone could consider decent work. Mining impacts have winners and losers. The winners are shareholders and executive management, the well-to-do. The losers are surrounding communities, whose water, air, health and livelihoods are negatively affected. Workers too suffer from various lung diseases and stressful working conditions. Around some high polluting companies young people fail medical health assessments and can’t get employed in the very companies that have caused the problem. Women are most impacted upon, many of them torn from subsistence farming only to lose their social status and health, ending up forced into sex work. When we question these negative impacts we are told to read the sustainability reports of these companies. Reading one in isolation seems impressive. Reading ten and trying to work out what has been achieved requires forensic detective work. Trying to gain a picture of what the corporation, in this case Lonmin, has achieved over 10 years, is painstaking. Targets are set, missed, explained or abandoned. Apologies are made, new targets set. Things are conflated together and then separated off and confusion reigns. When we try to measure what Lonmin has done to provide decent accommodation or what it has actually spent in communities over the years, it is difficult to separate fact from fiction. We have long said in the Bench Marks Foundation that we need to go “Beyond Reporting; Beyond Compliance!” to find out what is the truth of CSR. In all our studies we see the huge damage mining is inflicting on people and local communities, whether polluting their water and air or impacting on the general welfare of communities. We also see grand statements by these very same companies on how responsible they are, how they bring jobs to communities, protect the environment and work hand in hand with communities. But all we see as a research and monitoring agency is that things are getting worse. Why are wages and incomes of workers not part and parcel of sustainable development and CSR reporting? In the North, wages and incomes of workers are part of the CSR paradigm as a living wage provides for social stability and economic development. The mining industry needs to incorporate this into its sustainability reporting and say what it intends doing to rectify this anomaly. We do not see any measurable improvements, whether creating local jobs, the use of subcontracted labour, decent housing, or responsible environmental actions. x | Policy Gap 7
This is a human problem; people are suffering. When companies do not comply, they just have to
explain why they messed up. But explaining the failure to comply is not good enough. Tough action
needs to be taken to ensure that people are protected, that our water is drinkable, that the air we
breathe is healthy, and that externalised costs are covered by the industry and not by communities
and local government who do not have the resources. At the heart of mining there are people and
communities and the environment which need to be taken into account – not just shareholder profit.

Rt Rev Dr Jo Seoka                                     John Capel

Chairperson                                           Executive Director

Bench Marks Foundation                                 Bench Marks Foundation

                                                                                      Policy Gap 7 | xi
Executive Summary Background In August 2012, Bench Marks Foundation published the report Policy Gap 6: A Review of Platinum Mining in the Bojanala District of the North West Province. This on-the-spot study revealed the dire social and environmental conditions that prevail in the platinum mining operations of the three biggest platinum companies and in the surrounding communities. Lonmin Plc responded to this critique with an open letter, arguing that the company’s own Sustainable Development Reports provide a rebuttal of the report’s conclusions. This study examines Lonmin’s social and environmental performance over the period 2003-2012 through a close reading of the company’s own Sustainable Development Reports (SDR). The report focuses on a limited number of key areas in a huge quantity of text: • Use of contract workers • “Social Capital” reporting • Housing programs • Community perception reporting • Environmental performance The Platinum Industry The platinum mining industry has grown very rapidly in South Africa. Measured as a proportion of the whole mining industry’s contribution to GDP, it has increased from 10% to 30% in 15 years. After the 1990s, it experienced an extended period of extreme profitability. Since 2008, profitability has been significantly lower, prompting cuts in Lonmin’s Social Labour Plans (SLP) and retrenchment plans at Anglo American Platinum (AAP). Contract Workers Some 30% of the work force in platinum mines is contract labour. In gold mining, by comparison, the contract worker share is between 10% and 15%. Since 2002, 20% to 25% of Lonmin’s workforce has been contract workers and the proportion grew to over 30% in response to the 2008-2009 crisis. In the platinum industry there is no accurate reporting of contract worker numbers and their wages. This is in breach of the legislation. xii | Policy Gap 7
Wages

The past year shows beyond doubt that the level of mine worker incomes is a crucial factor for social
and political sustainability. The wordy SDRs are completely silent on this issue. Rough calculations
based on total employment and total labour cost per year reported by Lonmin give an erratic curve,
but indicate successful cuts in average pay increases per Lonmin employee between 2009 and 2011,
probably as a result of the contract worker strategy.

Lonmin SDRs display value added tables to show the distribution of new income every year to different
stakeholders. During the good times for shareholders, 30% of value added accrued to wages. In times
when new value production decreased, the wage share increased to 70%. The generally higher and
fluctuating wage share at the three big platinum mining companies indicates a stronger position for
labour there than in the rest of the platinum industry. The wage share of value added for the whole
industry has been stable at a very low 30% since 2002, according to StatsSA.

Payments to shareholders, the state and Lonmin directors

From 2003 to 2012, US$ 847 million (about R6 billion) was paid out in dividends to Lonmin shareholders.
It included US$ 31 million in the Marikana year of 2012. No dividends were paid in 2009 or 2010 and
the 2012 level of 3% of value added is low compared with pre-crisis levels.

The portion of the value added paid to the state in corporate taxes dropped from over 16% in 2007 to
less than 4% in 2010 and just over 2% in 2011. Lonmin is not a leader in the Executive pay race, but it
would take an average worker 325 years to earn the value of the CEO’s remuneration.

“Social Capital”

The “social capital” amount reported in the SDRs was less than the amount paid to the Directors until
2010. The directors have numbered between 9 and 12 individuals. The community that is the target of
the “social capital” comprises tens of thousands of individuals.

In the SDRs, Lonmin commits to an average spend of 1% of pre-tax profits on “Social Capital”. But the
total figures for “social capital” in the SDRs, which make up this 1% or more, are almost double those
for the full range of community projects. The company uses the much lower figures when responding
to critics after Marikana, seemingly distinguishing “Social Capital” reporting from what actually benefits
the communities.

Between 2003 and 2007 most of the “social capital” amount went to the Lonmin Community Trust
Fund, which was then rapidly closed down. The SDRs for the years from 2003 to 2007 report that
between 3 and 6 US$ million was spent on “Social Capital” every year. But later SDRs reporting back
to 2006 say that the data is not “available” or “applicable” in relation to “local economic development
projects” and “approved SLP projects” for 2006 and 2007.

                                                                                           Policy Gap 7 | xiii
Houses The SDRs contain many commitments on the provision of houses. Between 2003 and 2012, Lonmin gave support to two RDP projects. In addition, Lonmin repeatedly gives five year plans for its own housing projects. A commitment made in 2006 to build 6,000 houses by 2011, by the following year has become 5,500 by 2011, but no houses were built. Lonmin itself built 1,149 houses in 1999 and has built no houses to completion since then. This fact surfaces in the 2012 SDR. In the strident response to Bench Marks Foundation, Lonmin repeats the 1,149 figure without this qualifying detail. Lonmin wants to sell houses to the employees, but the employees cannot or don’t want to buy them. Commitments under the Mining Charter have not been met. The 2012 SDR renews the commitment to build 5,500 “low density” houses by 2014. The 1,149 houses from 1999 are now suddenly taken into account. By this means Lonmin has silently cut the commitment made in 2007 and 2008 to build 5,500 new houses. Hostels Lonmin makes an early general commitment in 1999, repeated in the 2004 SDR, to “eliminate the single sex hostel living”. In 2006, the company commits to “convert” all hostels to family or bachelor “units” by 2011. This commitment, and obligation, is not met. It is repeated again in 2012, to be met by 2014. Between 2003 and 2010, the original number of hostels to convert is stated as 114. In 2012 that original number is changed to 128, or to 146 depending on the document. There is no explanation. Lonmin has completed 79 hostel conversions according to the SDRs. In 2012, however, the number given is 97. But both numbers fit with 49 hostels left to convert by September 2012, depending on whether the original number was 128 or 146. The aim of the hostel conversions is to “address the housing shortage”, says a preface to one SDR. But according to well-placed sources every 8 beds provided by the old hostels only convert into between 2 and 3 beds in the new housing “units”. The hostel conversions trigger growth of the informal settlements. Beside the confusing numbers given in the SDRs, the hostel conversion process is unsustainable and defunct. What the community thinks Lonmin’s critique of the 2012 Bench Marks Foundation report alleged, amongst other things, that it was guilty of confusing what the communities think about their environment with accounting for the actual conditions. Yet from 2004 to 2008 Lonmin seems to understand that both objective measurement and subjective experience are important. However from 2009, Lonmin abandons its survey of so called “community perception”. This appears to happen when no more improvements can be registered in the surveys. xiv | Policy Gap 7
Dust

The 2004 SDR commits the company to meet “air quality permit requirements”. Yet the SDRs all contain
admissions of exceeding the limits set by the permit. A new Air Quality Act changed the measurement
in 2005 to one that was less onerous. It contained different limits for residential and industrial areas.
Lonmin has exceeded both residential and industrial dust pollution limits every year up to 2012. On
average, the SDRs report 90% compliance with the permit. No sanctions are reported.

Sulphur dioxide

The situation with sulphur dioxide is a tale of Lonmin exceeding permitted limits, of those limits being
increased without explanation and of Lonmin then again exceeding the increased limits. In 2003
Lonmin emitted more than eight and a half times the limit of 4.8 tonnes per day. This report has not
investigated for how long this had been going on. In 2004 and 2005 Lonmin was probably in breach
of the 4.8 tonne limit. In 2006, the company was compliant because of the first of the unexplained
increases in the legal limit from 4.8 to 8.3 tonnes per day. In each of the following 3 years, Lonmin was
in breach of the new limit. In 2011 the limit is increased again to 17.9 tonnes (more than 3 times the
original limit) and Lonmin seems to have got the increases under control. By 2012 the emissions have
decreased to just above the previous, lower limit of 8.3 tonnes.

From air pollution to water pollution

Every year “unplanned discharges” into rivers have occurred. This is not permitted. The SDRs report
new measures implemented or planned to prevent this. Lonmin has since 2004 used a scrubbing plant
to reduce the sulphur dioxide emissions. But “the capture of SO2 has resulted in the generation of
calcium sulphite as a waste product”. Provisional dams for this waste product have started to leak.

The more effective Lonmin is in combatting its sulphur dioxide emissions in the air, the more calcium
sulphide the mining project produces on the ground. An option of conversion of the sludge into gypsum
for cement production awaits the company’s assessment as to its profitability.

Conclusion

Lonmin Plc has won awards for its environmental and socio-economic performance. The company says
it is “best in class” in sustainability. But it is running an unsustainable project. If Lonmin is “best in class”,
platinum mining in South Africa is not environmentally, socially or politically sustainable. On occasion,
the SDRs report that the mining license might be in danger. This report concludes that, judging from the
SDRs 2003-2012, that danger is very unlikely to materialise. No sanctions of any kind have ever been
meted out against Lonmin.

                                                                                                  Policy Gap 7 | xv
xvi | Policy Gap 7
1
Introduction
This report aims to shed some light on the revolt that has shaken the mining industry in South Africa since
2012 and still hasn’t subsided. In January 2012, over 17,000 workers embarked on a six week strike at
Impala Platinum Mine in Rustenburg. This was followed by a strike at Aquarius Platinum. In both of these
strikes several workers were killed by security guards of the companies. Then, on 16th August, 34 striking
employees of the British owned platinum mining company, Lonmin Plc, were shot dead by the police. At
least 78 other workers were wounded. From the end of August a wave of strikes spread to platinum, gold
and coal mines. The workers demanded drastic wage increases and they still do.

1.1       Lonmin
Lonmin is the world’s third largest producer of so called Platinum Group Metals (PGMs). Although it
is a British company, “99.9% [of the employees] reside in SA”.1 It has not been known as an especially
negligent or ruthless mining employer. In fact the company has argued that it acts in a more socially
and environmentally responsible manner than other mining companies.2 In a strident response to
the critical Public Eye People’s Award nomination3 in 2013, after the Marikana massacre, Lonmin
commended itself for having a “best in class safety record in the country”.4 This means, for example,
that whilst in the 2011 financial year 12 workers were killed at work in Anglo American Platinum (AAP)
and 7 at Impala, 6 were killed at Lonmin (although this is double the 3 killed every year during the four
preceding years).5

Lonmin’s ”sustainability” performance (if this expression is appropriate) has been acknowledged by the
business community several times.

      “We are pleased to announce that as a part of Nedbank Green Mining Awards, our
      sustainable development efforts were widely recognised. We were winners of both the
      environmental and the socioeconomic categories, as well as runners up in both categories”.6

Bench Marks Foundation decided to conduct this study because it wanted to highlight how one of
the “better” companies performs when it comes to sustainable development. In a 2010 corporate
reporting competition, Lonmin was awarded “The Lang Communications award for Most Improved
Narrative” by the Strategic Planning Society. And it is Lonmin’s “narrative” that this study critically
examines: Lonmin’s own story as it appears in the so called “Sustainable Development Reports” (SDRs).

                                                                                             Policy Gap 7 | 1
1.2 Methodology and focus In their SDRs the large mining companies try to show controlling authorities, shareholders and the interested English reading public that their profit-maximising operations are not only good for investors and supporting businesses, but also for the employees, the surrounding communities and South Africa’s general development. We have conducted a close reading of Lonmin’s texts from 2003 to 2012, chronologically following how Lonmin reports about half a dozen social and environmental themes through the years. We followed key words like “housing“ and ”house“ through the electronic SDR documents. We compared the data reported and the “stories“ told over 10 years of reports. The methodology tries to follow the “structured data analysis“ and ”witness hermeneutics” developed by Arne Trankell. 7 We go back and forth through a substantial collection of data and statements about past events to separate fact from fiction. In the process we try to establish causal links between real events. We also draw upon a strand of historical research called genealogy and focus on the use of language by those in power and how they control – or try to control – ”Truth”.8 So it is through the SDRs that we assess the sustainability of Lonmin’s operations.9 We rely mainly on Lonmin’s own reporting and data, adding occasional other sources where necessary. We do not hold Lonmin to account against the complicated and changing legislative framework itself. We encounter that framework through what Lonmin says about it, as would an interested lay person. We hold the company to account against its own promises and stated goals, and against regulations and laws as Lonmin itself cites them. So it may well be the case that the company is in breach of the law and the Mining Charter on more counts than appear from its own reports. 1.3 Key discussions and findings Lonmin fails to live up to its own sustainability goals. If it is true that it performs better or much better than most of its mining company peers, which we have no reason to question, its failure indicates that South African mining in general is not sustainable. What does this mean? Nature, for her part, has been very patient with the South African mining industry. It took a long time before she started to hit back with phenomena like Acid Mine Drainage (AMD). Can an industrial project or a whole industry also become socially unbearable and therefore politically unsustainable? What happened at Marikana, as well as the continued social and labour unrest in the mining industry, all seem to indicate that a socially and environmentally unsustainable project can indeed become politically unsustainable. People affected by the operations or running them on the ground – and under it – cannot go on living as they do any longer. They revolt. But what is unsustainable for mineworkers and their communities is not necessarily unsustainable for the controlling authorities. It is not clear what a mining company in South Africa must do to lose its mining license for failure to comply with laws and regulations. A tentative conclusion is that a mining operation can go on for as long as the company in charge of it displays public awareness of its failures, negotiates new agreements with the authorities, expresses respect for the laws and promises to correct failures in the coming years. This is what the corporate “narrative” in the Sustainable Development Reports seeks to do in order to negotiate the political terrain. With Nature, however, no negotiated deals are possible. 2 | Policy Gap 7
1.4       Scope and Organisation of the Report
Lonmin’s SDRs cover a wide range of social and environmental problems that are connected to the
excavation and processing of PGM ore in South Africa. The reports comprise a vast amount of material.
We focus on a limited number of key issues. Section Two focuses on the use of contract workers to
reduce labour costs. Section Three covers the problem of providing decent housing for mineworkers
and their families. Section Four looks at Lonmin’s reporting on “community perception” of its operations
and environmental issues such as dust pollution and sulphur dioxide emissions.

To put the reading of Lonmin’s SDRs into the context of contemporary economic history, we start with
a very short overview of how platinum mining in South Africa has risen in importance since the 1990s.
The notion of “profitability” is central in 2013 when debating threats of retrenchments. In Lonmin’s
reports “profitability” also affects social projects, leading to the company’s official scaling down of the
housing projects when declining sales and returns on investment set in from 2008.

                                                                                             Policy Gap 7 | 3
2 Workers and Profits 2.1 The rise of platinum mining and the “profit crisis” The phenomenal growth of the platinum mining industry in South Africa from the 1990s – and the decline of gold mining – has been comprehensively described by Gavin Caps.10 In the 15 years from 1996 to 2011, platinum mining’s share of the value added by the whole mining industry to South Africa’s Gross Domestic Product (GDP) rose from less than 10% to 30%. Gold mining today, on the other hand, accounts for only 10% of what all Mining and Quarrying in South Africa adds to GDP.11 Starting from the 2000s, the industry has been extremely profitable. Recently, strikes have of course inflicted losses. But under normal (non-strike) conditions the industry is still profitable, despite a corporate narrative to the contrary in company press statements.12 2.2 Anglo American Platinum In January 2013, AAP threatened to retrench 14,000 employees and mothball the Khuseleka and Khomanani mines in Rustenburg. This figure was reduced to 6,000 at the beginning of May 2013 and has now been reduced again. This is not about closing down mines which are losing money.13 It is about restoring profitability in the face of the global decline in demand for PGMs, of which 54% was used for autocatalysts in 2007.14 The June 2012 Interim Report from AAP, issued before the strike wave, describes unequivocally the positive operating contribution of both Khuseleka and Khomanani to AAP’s balance sheet, as well as increases in refined PGM per worker of more than 20% at both mines. According to AAP’s own report, the productivity increase at the two mines doubles the average productivity increase of all its mines.15 The 2012 Annual report estimates their life span to be at least another 20 years. 2.3 Profitability and shareholder value In corporate discourse “unprofitable” doesn’t mean loss making. It means making less profit than the company can make elsewhere. This logic is salient today in platinum mining, which saw soaring platinum prices after 2000, the spectacular fall in prices in 2008, and much lower global demand for the commodity today.16 After 2008, returns on investment in platinum mining are very poor, but only when compared to before (see Figure 1 below). 4 | Policy Gap 7
Figure 1: Anglo American Platinum, Impala and Lonmin operating margins and Return on Investment

Source: Diagram in Whitburn (2012)

The average operating margin for the three biggest platinum producers (AAP, Implats and Lonmin)
taken together has been close to 30% over twenty years. Paul Whitburn estimates that the “long-term
cost of equity” in South Africa, is 14%.17 This “cost” reflects what shareholders demand back in annual
returns on shares they hold in South African companies, and it is a world leading rate of return. South
African non-financial firms are “highly profitable”, commented the IMF in its 2012 Article 4 Report on
South Africa. With about 12-13% “return on assets”, South Africa comes third among 19 developing
countries.18

However, platinum mining is not up to that mark today. David Holland and Brian Kantor use yet another
measure to show a steep decline in profits.19 They even play with the prospect of nationalisation,
because of a poor 3 to 4 year outlook from a shareholder point of view.20 This is an interesting thought.
From the point of view of society, and compared to the costs (to society) of mass retrenchments,
an industry that pays for wear and tear of its infrastructure as well as wages to 135,000 permanent
workers (and 63,000 “contractors”)21 is not loss making. It makes a net contribution of value to the
economy, in the short term and in the long term. But the shareholders see a decline of return on
equity22 to 10% or lower, with no hope of recovery. They see employees who are no longer prepared to
wait for any trickle down effects of high growth, and who are militantly organised to increase wages at
the expense of profits. For the majority shareholder this spells crisis.

Faced with this situation, investors look around for other investment possibilities, sell their shares and
send the company share price plummeting. This undermines the total value and creditworthiness of
the enterprise. It can make it harder to borrow money. It can trigger clauses in loan contracts, forcing
a company to pay higher interest rates on company bonds and other loans. It eventually pushes the
wagon closer to the brink of insolvency or take-over.

                                                                                            Policy Gap 7 | 5
When laws regulating capital flows are lifted, investors start to act with the whole world in their sights.
In Lonmin’s case, this short term profit-maximising logic has been in play since 2008. When its profits
started to decline, Lonmin saw a continuous steep fall in the company’s value on the stock market, from
about R79bn in September 2007 to R17bn in August 2012. That is a 78% fall in market value.23
2.4 The use of contract workers and two responses to the
crisis
2.4.1 AAP cuts contract workers
The giant AAP reacted to the global crisis that started in 2008 with massive retrenchments. In 2007 the
company had a workforce of 88,300 in South Africa; in 2012 the number had fallen to 51,000. All types
of employment contracts are included in these numbers, but most of AAP’s retrenchments since 2008
have hit contract labour.
From 2008 to 2009, AAP retrenched more than 7,000 of its “own” or “established” employees.24
However, the retrenchment of contract workers started one year earlier. The number of contract
workers fell by 12,000 between 2007 and 2008. 39,000 contract workers in 2007 declined to a little
more than 4,000 in 2012 (see Figure 2 below).25
Figure 2: Employment at AAP and Lonmin compared
Source: AAP and Lonmin Sustainable Development Reports.
6 | Policy Gap 72.4.2 Lonmin’s approach
Lonmin reacted differently to the crisis. Save for cutting the total workforce by a net total of 1,600
employees between 2008 and 2009, workforce numbers have constantly been rising during the whole
period 2002-2012 (see Figure 2 above).
Partly, this seems to be a result of holding back on mechanisation (with consequences for the work
load and risks in the shafts). This approach was announced to the press in July 2012.26 Judging from
Lonmin’s employment statistics, it could however be that a low mechanisation strategy has been in
place for a longer period.
Whilst at AAP the proportion of contract workers in the total workforce has consistently fallen, from
almost half in 2006 and 2007 to 8% in 2012,27 at Lonmin between a quarter and a fifth of the workforce
is contract labour, and has been at least since 2002.28
Lonmin obviously took an optimistic view of the crisis of 2008-2009. Indeed, the 2009 SDR is entitled
“Preparing for recovery…”. However, by 2012 the media was filled with reports about the indebted
Lonmin and the fall in its share price.29 The crisis at the end of 2012 and the rumours in the media that
the company needed a “refill” of capital from shareholders are beyond the scope of this study.
2.4.3 The confusion in Lonmin’s contract work reporting
Lonmin’s CEO Ian Farmer declared in the 2009 SDR: “In 2009, we completed a major restructuring
programme, which led to around 7,000 fullå time employees and contractors leaving the business”.30
Yet this doesn’t fit with the report on permanent staff turnover and the report on total employment in
the same SDR.
Instead, a detailed table and the accompanying text give “a net labour loss of 4,121” for permanent
staff. 31 In fact, the decline in total labour force between 2008 and 2009 at Lonmin was only 1,605
workers after taking into account the growing use of contract workers, although this conclusion depends
on how much of this growing use is an effect of more accurate reporting. We are informed that the
number of part time and full time contract workers of various kinds was under-reported before 2009.32
2.4.4 The confusion in general contract work reporting
It is relevant to make a general comment here. There is a break in 2006/2007 in the statistics on contract
employment and wages within platinum mining (see Figure 3 below). From 2007 the Department of
Mineral Resources (DMR) managed to get reports from more companies about the number of contract
labourers hired and their wages. But wage levels for contractors are still guesstimates, made either by
the staff or by the companies themselves. The bigger the company, the less accurate is their contract
labour data, especially when it comes to the reported wage bill. Larger companies use hundreds of
subcontractor firms. They are obliged by law to report accurately about their employee numbers and
wages, but so far they have not. At the time of writing, DMR has given them time to rectify this and is
negotiating target dates with the mines for the reporting of accurate labour data.33
Policy Gap 7 | 7This means that the contractor data in Figure 3 below must be treated with great caution. Figure 3: PGM 2005-2012 Average nominal monthly wages by category of employees Source: Department of Mineral Resources.34 According to DMR, the average earnings of a contract worker in 2011 were about 60% of an established worker’s in PGM mining. Contract worker data is in general uncertain and all data for 2012 is preliminary. A break in the contract worker wage data is marked with an arrow. The failure to take into account or comment on retrenchment or increased hiring of contract workers also leads to other anomalies. The 2009 SDR from Lonmin identifies a jump in staff turnover rate from 7% to 23% compared to the previous year. That is a very high figure. Yet the number still doesn’t include the hiring and firing of contract workers.35 2.4.5 Platinum industry wages According to DMR, the average wage in platinum mining rose about 11% per year for established workers in nominal terms (i.e. inflation not taken into account) between 2005 and 2012.36 DMR’s preliminary data for 2012 show a 13.7% rise in the permanent worker average wage in platinum mining in November and December, compared to June and July. If we compare the average for the last two months of the year with the average from January to June, the increase is 26%.37 The averages include high and very high wages for supervisors and the like. How much of this wage increase applied to Rock Drill Operators (RDOs) and workers in lower pay grades is not clear. In the Quarterly Labour Force Statistics, Stats SA reports a R5,800 median wage for the whole mining sector up until 2011. The data is not available for the different mining subsectors.38 The contract worker average wage in platinum remained just below R10,000 in 2012 – i.e. it was stagnant – and about 20,000 contract workers lost their work during the strike period. The contract worker share, in platinum, fell from 35% to 28%. The drop started in August 2012. 8 | Policy Gap 7
2.4.6 Gold industry wages

By contrast, the contract worker share in gold mining has for a long time been 12 and 13% of the
workforce, according to DMR. The mine revolt spread to the gold mines. But the preliminary statistics
show no notable wage increases at the end of 2012 and no notable change in employment. The average
established wage in gold mining in 2012 was between R2,000 and R3,000 lower than in platinum , and
rose by less than 6%. The contract average was stagnant. It was about R1,500 below the established
wage at the end of the year.39

2.4.7 High share of contractors in the platinum industry

Contrary to the consensus in the business press, it is comparatively easy to retrench staff in South
Africa. The country’s large swings in employment, like during the crisis 2008-2009, “reflect the generally
weak employment protection”, writes the IMF economist Nir Klein in an otherwise traditional paper (in
which he makes the usual argument that real wage increases in South Africa from 2009 to 2011 were
too high).40 He adds in a footnote, with reference to the OECD that in 2008: “South Africa’s employment
protection legislation index is….the lowest among the G20 emerging markets”.

Besides its precariousness, one important corporate rationale for labour casualisation and contracting is
of course the lower cost to the shareholders. The increased use of contract labour makes the composition
of the work force crucial, from the corporate point of view, to mitigate the effect of successful wage
bargaining. When the share of contract labour goes back to historical levels, permanent staff can also
be recruited from the pool of contract labour at lower entry wages.

As shown above, Lonmin reacted to the crisis by increasing the use of contract labour in 2008-2009.
The contract labour share at Lonmin stood at 23% in 2012 (see Figure 4 below).

Figure 4: Lonmin contractor proportion of workforce and average labour cost 2003-201241

                                                                                            Policy Gap 7 | 9
Many contract workers do the same work as permanent workers, such as rock drilling, and they participate in education and training sessions (something the SDRs point out). There is, however, no disclosure of labour cost strategies in the SDRs, even if wage levels are crucial for grassroot political and social sustainability. There are no tables of wages for different occupations. After the Marikana massacre, Lonmin’s publication of a RDO wage bill in a press statement and in a Fact Sheet42 is an exception. To summarise, pledges of transparency and accountability don’t stretch to wages. For contract labour and labour broking, the books are not in order. We are forced to approximate wage levels from tables on employment and total labour costs. From these we see a tendency towards successive cuts in average pay increases, which seems to have been successful at Lonmin between 2009 and 2011, albeit not from the point of view of the mine worker community (see Figure 4 above). 2.5 Wages and Profits In this section we examine how the Value Added at Lonmin is divided up. If we were looking at a cooperative project instead of a company, the division of the value created in a year between “wages” and “profits” would be a division between how much should support the cooperative members’ consumption and how much should be reinvested in the project. It is a division of “total value added”. In the South African national accounts, this “total value added in a year” – the sum of gross profits and compensation to employees – effectively corresponds to GDP.43 Within the amount allocated to profits we look at its components: the amount paid to the government in taxes, the amount paid out to executive and non-executive directors, the amount paid out to the shareholders in dividends and the amount allocated to the community in “Social Capital”. 2.5.1 Dividing Value Added between Profit and Wages The Value Added Statement (VAS) in the SDRs shows how the new wealth created every year has been distributed to the so called “stake holders”. This can differ from company to company and from year to year in the same company, and the detail we are given differs too. But what is clear is that the wage share of the value added, taken from the Lonmin SDRs, falls to about 30% during the “good times” for the shareholders (2003-2008). It rises to above 70% in the “bad times” for the shareholders (2009). It then drops to 50% again in 2010-2011 when profits recovered somewhat. Interestingly, Stats SA reports a stable wage share of value added as low as 30% in the whole platinum sector from 2002 onwards.44 This is significantly lower than for the three platinum giants, judging from the value added statements in their SDRs, where the wage share also fluctuates much more. If the data is accurate, this tells a story of a stronger position for labour at AAP, Impala and Lonmin than in the platinum mining industry at large. Many readers might think that wage compression is positive, from some general “economic” point of view, or because wages are “costs”. But from the point of view of society, also reflected in the national accounts of South Africa, wages are not a “cost”.45 They are a part of the national income. 10 | Policy Gap 7
You can also read