Core Strategy and Settlement Strategy - South ...
←
→
Page content transcription
If your browser does not render page correctly, please read the page content below

Core Strategy
and Settlement
Strategy

                                                            Core Strategy and Settlement Strategy (CS)
Vision
Maximise the potential of the County to
deliver a compact settlement form in line
with National and Regional population
targets, with a strong focus on
regeneration and the redevelopment of
brownfield over greenfield lands.

DRAFT SOUTH DUBLIN COUNTY DEVELOPMENT PLAN 2022-2028   27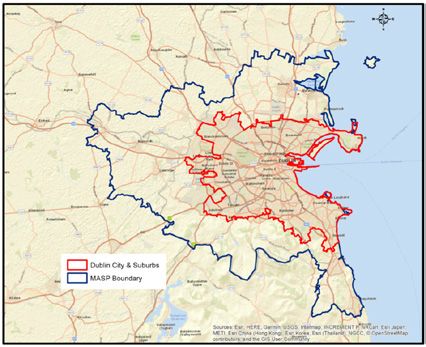
2.0 Introduction
                                             The purpose of this Chapter is to set out the Core Strategy for the Plan which has
                                             informed the overall vision for future development within the County up to 2028.
                                             Climate Action is integrated as a central overarching theme for all aspects of the
                                             Development Plan, a key element of which is compact growth.

                                             The Core Strategy is made up of the settlement hierarchy and growth strategy for
                                             South Dublin County and is an essential part of the Plan demonstrating that the
                                             quantum and location of development in the County is in line with National and
                                             Regional planning policy.

                                             2.1 Climate Action
                                             The promotion of a compact urban form of development is a central part of
                                             mitigating climate change. The policies and objectives of this Core Strategy seek to
                                             provide for a consolidated urban form within existing settlements that are integrated
                                             with existing and planned public transport and the delivery of social and physical
                                             infrastructure. Such measures set the tone for the delivery of successful and
                                             sustainable communities within the County over the lifetime of this Plan and beyond.

                                             In applying this approach, alongside the various other components in the
                                             Development Plan, it is our aim to strive towards the delivery of connected
                                             neighbourhoods and the 10-minute settlement concept. This would provide for
                                             community facilities and services that are accessible within a 10-minute walk or cycle
Core Strategy and Settlement Strategy (CS)

                                             from home or accessible via public transport services connecting people to larger
                                             scaled settlements where such services are available.

                                             This is promoted through a combination of the compact settlement form contained in
                                             the plan’s Core Strategy and Settlement Strategy, and the policies and objectives to
                                             promote active travel and public transport set out in Chapter 7 Sustainable
                                             Movement.

                                             2.2 Executive Summary
                                             This Core Strategy and Settlement Strategy quantitatively demonstrates how much
                                             land is required to meet the residential and employment need of an additional 46,518
                                             people up to 2028. To provide for this level of growth in line with National policy, a
                                             need for 23,730 new homes between the Census year 2016 to 2028 within the County
                                             has been identified.

                                             Taking account of completed units between 2017 and 2021 (5,914 Units) there is an
                                             overall requirement of 17,817 units between 2021 and 2028. The Core Strategy (Table
                                             10) demonstrates how this target can be met up to 2028 taking into consideration
                                             units under construction. It has been developed by applying a four-step approach to
                                             the identification and assessment of lands capable of meeting this housing
                                             requirement.

                                             28                                   DRAFT SOUTH DUBLIN COUNTY DEVELOPMENT PLAN 2022-2028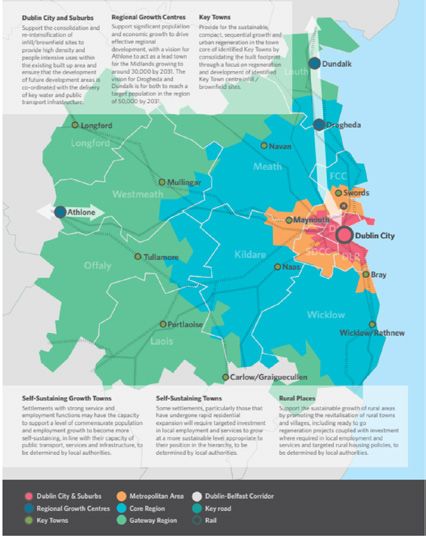
1.                  2.               3.                4.
 Land Capacity      Infrastructure      Planning       Deliverability
    Study            Assessment        Assessment        Analysis

àà The housing target for South Dublin County, as set by Ministerial Guidelines and
     the NPF Road Map, is 17,817 homes up to 2028.
àà Of this there are currently 4,557 homes under construction, thereby reducing the
     need to 13,260 homes up to 2028.
àà The Council has assessed all appropriately zoned lands with the potential for
     residential development and has applied a residential density for each site in line
     with Ministerial Guidelines.
àà   Informed by this work, there is a total Land Capacity of 1,039ha with the potential
     for 44,472 units. However, by excluding Long Term Strategic Lands the land
     capacity reduces to 477ha with the potential to accommodate 23,731 units.
àà   An Infrastructure Assessment was carried out for these lands to identify the
     capacity of lands in Tier 1 (i.e. zoned and serviced) which has a total of 11,597
     homes and in Tier 2 (i.e. zoned and serviceable within the lifetime of the plan)
     which has a total of 12,133.
àà   A further Planning and Deliverability assessment was carried out across the Tier 1
     and 2 lands and has been found to have sufficient capacity to meet total housing
     target set for the County.
àà   Based on above – the core strategy identifies that there is no requirement to zone
     additional lands to meet population or housing targets.

2.3 Statutory Context

                                                                                            Core Strategy and Settlement Strategy (CS)
The Planning and Development Act, 2000, as amended (the Act) places an obligation
on the Planning Authority to prepare a ‘Core Strategy’ which articulates an evidence-
based strategy for the spatial development of the County within the period of the
Development Plan.

The principle of the Core Strategy therefore is to demonstrate that a Development
Plan, its objectives and the Housing Strategy are consistent, as far as practicable,
with National and Regional development objectives. These objectives are set out in
the National Planning Framework (2018) and the Regional Spatial and Economic
Strategy (2019) and prevailing Ministerial Guidelines with specific reference to
Specific Planning Policy Requirements.

The Act requires a Core Strategy to include a settlement hierarchy; evidence-based
population and housing targets for urban areas (cities, towns and villages) and rural
areas; to demonstrate how zoning proposals accord with national and regional policy;
and to demonstrate regard for the Retail Planning Guidelines for Planning Authorities,
DECLG (2012).

While the Act does not expressly require the Core Strategy to contain information
concerning other land uses, such as employment and commercial, the Guidance Note
on Core Strategies, DECLG (2010) recommends that Planning Authorities undertake

DRAFT SOUTH DUBLIN COUNTY DEVELOPMENT PLAN 2022-2028                                   29
an appropriate level of analysis to ensure that sufficient lands are zoned at suitable
                                             locations, taking account of higher-level planning policies and required physical
                                             infrastructure.

                                             Further to the above, the Core Strategy is to be represented in the written statement
                                             by Core Strategy tables, and by a diagrammatic map or other such visualisations.

                                             2.4 Strategic Context
                                             The parameters within which the Planning Authority frames the Core Strategy are
                                             defined within National and Regional planning policy frameworks comprising:

                                             àà Project Ireland 2040: National Planning Framework;
                                             àà The Eastern and Midlands Regional Spatial and Economic Strategy 2019-2031,
                                                  including the Dublin Metropolitan Area Strategic Plan, and
                                             àà Section 28 Ministerial Guidelines including Specific Planning Policy Requirements
                                                  outlined under Section 28(1) of The Act.

                                             Each of these documents and the parameters they set are discussed in turn as
                                             follows:

                                             2.4.1 National Planning Framework (Project Ireland 2040)1

                                             The National Planning Framework (NPF), supported by the National Development
                                             Plan (NDP), is the Government’s high-level strategic plan for shaping the future
Core Strategy and Settlement Strategy (CS)

                                             growth and development of the country to the year 2040.

                                             The NPF is centered around ten National Strategic Outcomes (NSOs) which are
                                             supported by ten Strategic Investment Priorities under the National Development
                                             Plan – Figure 1. Development Plans must align with these NSOs, which are
                                             underpinned by National Policy Objectives (NPOs). The preparation of the County
                                             Development Plan has been informed by these NSOs and related NPOs.

                                             These NSOs incorporate the ten UN Sustainable Development Goals (SDGs) as
                                             outlined in the introduction. By complying with the National Planning Framework, the
                                             Development Plan in turn, aligns with the UN SDGs.

                                             The NPF’s number one strategic objective, Compact Growth, sets a clear
                                             development outcome to grow our existing urban areas creating a priority to build on
                                             brownfield / infill development first, before considering greenfield lands.

                                             This approach seeks to make the optimum use of existing infrastructure and
                                             encourage more people, jobs and activity into existing built-up urban and settlement
                                             areas ensuring that, when it comes to choosing a home, there are viable attractive
                                             alternatives available.

                                             1  External Link to the National Planning Framework - https://npf.ie/wp-content/uploads/Project-Ireland-
                                             2040-NPF.pdf

                                             30                                           DRAFT SOUTH DUBLIN COUNTY DEVELOPMENT PLAN 2022-2028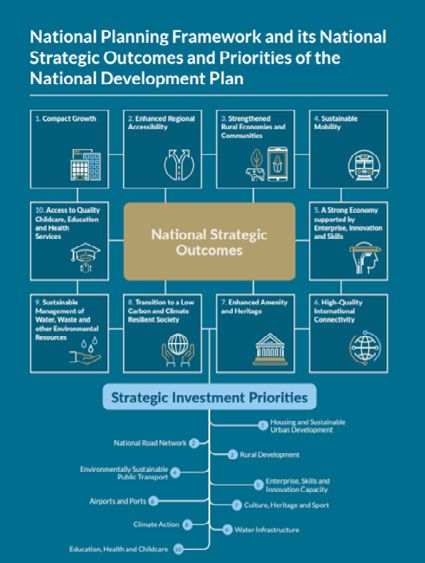
Core Strategy and Settlement Strategy (CS)

Figure 1: National Strategic Outcomes and Strategic Investment Priorities, Source: NPF 2018

On this basis, the parameters set for the Core Strategy will focus future population
and employment in a manner that complies with the National Policy Objectives of the
NPF.

DRAFT SOUTH DUBLIN COUNTY DEVELOPMENT PLAN 2022-2028                                          31
2.4.2 Ministerial Guidelines

                                             The Department of Housing, Local Government and Heritage (the Department) over
                                             the lifetime of different governments has produced various Ministerial Guidelines,
                                             known as Section 28 Planning Guidelines, to inform and guide local authorities in
                                             carrying out their duties.

                                             The contents of the following Guidelines have informed the Core Strategy and the
                                             policies and objectives of the Development Plan:

                                             àà Housing Supply Target Methodology for Development Planning, Guidelines for
                                                  Planning Authorities, December 2020
                                             àà   Design Standards for New Apartments – Guidelines for Planning Authorities, 2020
                                             àà   Urban Development and Building Height Guidelines, 2018
                                             àà   Interim Guidelines for Planning Authorities on Statutory Plans, Renewable Energy
                                                  and Climate Change, 2017
                                             àà   Sustainable Residential Developments in Urban Areas, May 2009
                                             àà   The Planning System and Flood Risk Management – Guidelines for Planning
                                                  Authorities, 2009
                                             àà   Appropriate Assessment of Plans and Projects in Irelands – Guidance for Planning
                                                  Authorities, 2009
                                             àà   Implementation of the SEA Directive: Guidelines for Regional Authorities and
                                                  Planning Authorities, 2004

                                             Since 2018, the Planning and Development (Amendment) Act, 2018 introduced a
                                             requirement for Planning Authorities to implement Specific Planning Policy
Core Strategy and Settlement Strategy (CS)

                                             Requirements (SPPRs) where they are set out in Guidelines, in the performance of
                                             their functions. A statement of compliance with the various Section 28 Ministerial
                                             Guidelines and associated SPPRs is contained within Appendix 1.

                                             2.4.3 Eastern and Midland Regional Spatial and Economic Strategy 2019 –
                                             2031 (RSES)

                                             The Eastern and Midland Regional Spatial and Economic Strategy 2019 – 2031
                                             (EMRSES) is a strategic plan to support implementation of Project Ireland 2040 (NPF
                                             and NDP) and the economic policies and objectives of the Government, by providing
                                             a long-term strategic planning and economic framework for the development of the
                                             region.

                                             The RSES sets out a settlement and economic growth strategy to ensure the needs of
                                             the Region’s citizens are met providing for access to housing, employment
                                             opportunities and services, ease of travel and overall well-being.

                                             This approach is guided by sixteen Regional Policy Objectives (RPOs) which are
                                             aligned with the UN Sustainable Development Goals, the EU thematic objectives and
                                             the National Strategic Outcomes (NSOs) of the NPF to set the framework for City
                                             and County Development Plans. By ensuring this alignment is maintained to a local
                                             level, the Regional Assembly can assist local authorities in aligning with EU priorities

                                             32                                    DRAFT SOUTH DUBLIN COUNTY DEVELOPMENT PLAN 2022-2028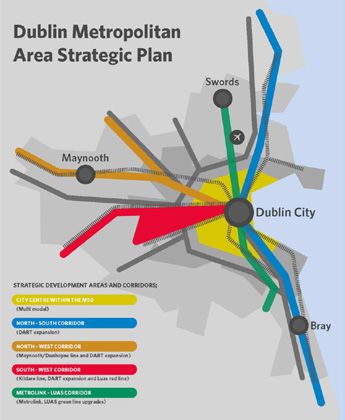
to leverage funding and partnership opportunities.

The RSES policy framework for the region is first divided into three Functional Urban
Areas (FUA)2 comprising: The Dublin Metropolitan area (DMA), the Core Region and
the Gateway Region and extends across local and regional boundaries. Figure 2
below illustrates the extent of the FUA for the Eastern Region which frames the
settlement strategy for Development Plans to follow. All of South Dublin County is
located within the Dublin Metropolitan Area with a significant area of the County also
within the settlement identified as Dublin City and Suburbs. The development within
the DMA forms a central part of the policy within the RSES guided by the Dublin
Metropolitan Area Strategic Plan (MASP).

                                                                                                             Core Strategy and Settlement Strategy (CS)

2   As set out in the National Planning Framework, the Functional Urban Area is defined by the standard-
ised EU/OECD as those Electoral Districts from which at least 15% of the relevant city areas workforce is
drawn.

DRAFT SOUTH DUBLIN COUNTY DEVELOPMENT PLAN 2022-2028                                                    33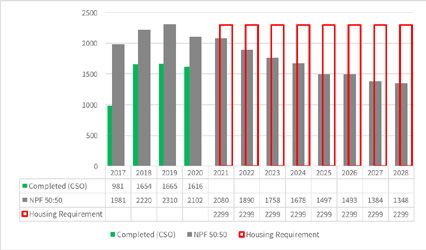
Core Strategy and Settlement Strategy (CS)

                                             Figure 2: RSES Settlement Strategy, Source: Eastern and Midlands Regional Spatial and
                                             Economic Strategy 2019

                                             The Regional settlement strategy comprises seven levels with Dublin City and
                                             Suburbs forming the top-level settlement for the region. For South Dublin County,
                                             Dublin City and Suburbs is the only regionally identified settlement within the County.

                                             The settlement hierarchy of the RSES requires each Local Authority to identify
                                             settlements which are either: Self-Sustaining Growth Towns, Self-Sustaining Towns,
                                             Towns and Villages and/or Rural areas. Under the CSO, Newcastle, Rathcoole, Saggart
                                             and Brittas are identified settlements outside Dublin City and Suburbs but their

                                             34                                      DRAFT SOUTH DUBLIN COUNTY DEVELOPMENT PLAN 2022-2028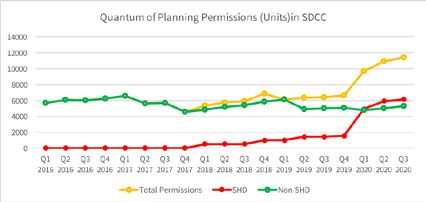
settlement type is not identified within the RSES, this being left to the Development
Plan.

Under the RSES, RPO 3.2 requires local authorities in preparing their core strategies
to set out measures to achieve compact urban development targets of at least 50%
of all new homes within or contiguous to the built-up area of Dublin City and Suburbs
and a target of at least 30% for other urban areas. The extent of the Dublin City and
Suburbs boundary within the DMA is shown under Figure 2 below and comprises the
majority of South Dublin County’s existing urban environment.

                                                                                             Core Strategy and Settlement Strategy (CS)
Figure 3: Area of Dublin City and Suburbs and MASP boundary. Source: EMRSES, 2019

The RSES includes population figures for the Region, the parameters of which are set
out under Appendix B of the EMRSES, which envisages South Dublin County to grow
by an additional 50,233 persons from 2016 to 2031 as illustrated under section 2.5.2
below. For South Dublin County up to 2028, the targeted population growth is an
additional 46,518 persons. The RSES growth strategy for meeting the needs of the
existing and future population was based on the availability of land, resources,
environment and infrastructure capacity. A part of this growth strategy is to deliver
sustainable growth of the DMA through the Dublin Metropolitan Area Strategic Plan
(MASP).

DRAFT SOUTH DUBLIN COUNTY DEVELOPMENT PLAN 2022-2028                                    35
2.4.4 Dublin Metropolitan Area Strategic Plan (MASP)
Forming a part of the RSES, the Dublin Metropolitan Area Strategic Plan (MASP) sets
out a 12 to 20-year strategic planning and investment framework for the Dublin
Metropolitan area. The MASP is an integrated land use and transportation strategy for
the Dublin Metropolitan Area that sets out:
àà A vision for the future growth of the metropolitan area.
àà Large scale strategic residential employment and regeneration.
àà A sequence of infrastructure priorities.
Core Strategy and Settlement Strategy (CS)
Figure 4: Strategic Development Areas and Corridors, MASP, Source: EMRSES 2019
36 DRAFT SOUTH DUBLIN COUNTY DEVELOPMENT PLAN 2022-2028As the MASP is an integrated land use and transportation strategy it provides a
regional level framework which aligns population and employment growth with
associated transport and infrastructure investment priorities. This is identified
through strategic residential and employment areas. The Strategic Corridors and
areas of relevance for South Dublin County are set out as follows:
1. The South West Corridor (Kildare line, DART expansion and Luas Red Line).
2. The City Centre within the M50 area (Multi modal).
South West Corridor
The South West Corridor is divided between the two rail lines (Luas Red Line and
Kildare line).
Along the Kildare line, the MASP identifies residential development at Adamstown
SDZ and the phased development at Clonburris SDZ in addition to a new residential
community at Kilcarbery and the promotion of and development at Grange Castle
Business Park for employment. Irish Rail are currently preparing a Railway Order to
progress the application to upgrade capacity and electrify the Kildare line as far as
Hazelhatch.
Along the Luas Red Line, the MASP identifies residential and mixed-use development
through the regeneration of brownfield lands in Tallaght and the re-intensification of
older industrial estates at Naas Road/ Ballymount. The new district at Fortunestown
near the emerging town of Saggart/Citywest is identified for residential growth.
Core Strategy and Settlement Strategy (CS)
City Centre within the M50
As part of the City Centre within the M50 area, the MASP identifies the significant
brownfield lands at the Naas Road within South Dublin County and Dublin City, with
potential for residential development and more intensive employment/ mixed uses.
The framework for the Core Strategy and Settlement Strategy below incorporates
each of these strategic growth corridors / areas identified in the MASP.
2.5 Population and Housing Data
This section sets out the information used to inform the preparation of the Core
Strategy for the Development Plan period 2022 - 2028. This part examines historical
and current available information in relation to population and housing and targets
set by National and Regional Planning policy context.
2.5.1 South Dublin County Population - Baseline
South Dublin County experienced continued population growth over the last 10 - 20
years. While the rate of growth reduced between 2002 and 2006, the years
thereafter have contributed to an overall increase of +16.72% (+39,932 persons)
between 2002 and 2016, as illustrated under Table 1.
DRAFT SOUTH DUBLIN COUNTY DEVELOPMENT PLAN 2022-2028 37Table 1: South Dublin County Population (persons) Trend 2002 - 2016, CSO
Year Population Change (No.) Change (%)
2002 238,835 +20,107 +9.19%
2006 246,935 +8,100 +3.39%
2011 265,205 +18,270 +7.39%
2016 278,767 +13,562 +5.11%
2002 – 2016 - +39,932 +16.72%
Understanding the spatial pattern of growth provides a picture of the pressures on
existing need for infrastructure/services. Table 2 illustrates the growth in population
in the urban settlements and rural areas (rural areas are outside urban/town areas
and population of towns with less than 1,500 persons) between 2006 and 2016 within
the County.
The historic trend shows that South Dublin County has grown by +12.9% or 31,832
persons over a ten-year period. However, despite this general growth, there was an
overall decline in rural population between 2011 and 2016. This trend follows national
and international movement of people from rural to urban areas.
The accompanying Housing Strategy and Interim Housing Needs Demand
Assessment (HNDA) set out under Appendix 11 has examined the demographic
changes and age profile of the County up to 2028, informing housing need.
Core Strategy and Settlement Strategy (CS)
Table 2: South Dublin County Urban, Rural and Settlement Populations (2006 – 2016)34
2016 % 06 - 16 06 – 16
Settlement / Area 2006 2011 2016 share of Change Change
County (No.) (%)
South Dublin County3 246,935 265,205 278,767 100% +31,832 +12.9%
Urban 240,607 259,729 273,215 98.01% +32,608 +13.6%
Dublin City and Suburbs4 235,306 251,505 262,638 94.21% +27,332 +11.6%
Saggart 868 2,144 3,133 1.12% +2,265 +260.9%
Rathcoole 2,927 3,421 4,351 1.56% +1,424 +48.7%
Newcastle 1,506 2,659 3,093 1.10% +1,587 +105.4%
Rural 6,328 5,476 5,552 1.99% -776 -12.3%
2.5.2 Population – Projections
The RSES, guided by the National Planning Framework Implementation Roadmap
(the Roadmap), has set low and high population projections for the region up to
2026 and 2031. This is broken down for each Local Authority and for South Dublin
3 Urban / Town Area: Towns with a settlement boundary with a total population of 1,500 + persons.
4 Dublin City and Suburbs area – See Appendix 2B for further detail.
38 DRAFT SOUTH DUBLIN COUNTY DEVELOPMENT PLAN 2022-2028County; the high population target has been chosen for the Development Plan
period.
Table 3: South Dublin – RSES Population Projection 2016 - 2031
2016 2026 2031
Low High Low High
South Dublin County 278,767 308,000 314,000 320,500 329,000
Change (No.) from 2016 - +29,233 +35,233 +41,733 +50,233
Change (%) from 2016 - +10.49% +12.64% +14.97% +18.02%
The Roadmap provides scope to South Dublin County to bring forward the 2031
population figures by up to 25% by 2026. In terms of ‘Headroom’, the Roadmap
indicates that an additional 50% growth is already accounted for in the National
population targets up to 2026. Thus, the application of 50% growth beyond the Plan
period is already accounted for in the targets.
Translating the high RSES projection figures, including the frontloading up to 2026,
population projections for the Development Plan period to 2028 is shown under
Table 4. The remaining 2026 to 2028 figure was calculated on the basis of a pro rata
average year (2 year) of the remaining balance between 2026 and 2031.
Table 4: 2022 - 2028 Population Projections - Adjusted
2016 2026 2028
Low High Low High
Core Strategy and Settlement Strategy (CS)
South Dublin County Council 278,767 315,308 322,808 317,385 325,285
Change (No.) from 2016 - +36,541 +44,041 +38,618 +46,518
Change (%) from 2016 - +13.1% +15.8% +13.8% +16.7%
Average Annual Pop growth
- +3,654 +4,404 +3,218 +3,877
(2016 – 2028)
2.5.3 South Dublin County Housing - Baseline
In 2016, there were 98,387 residential units within South Dublin County. Of this figure,
3,495 units were vacant representing 3.6%. Table 5 below shows the change in
housing stock between 2002 and 2016. While new housing units accounted for just
1,089 units between 2011 and 2016, a reduction of vacant units (1,730 units) increased
the active housing stock by 2,819 units. This rate of vacancy falls on the lower side of
the range of 2.5% to 6%5 which is considered to be normal in a properly functioning
housing market.
5 Page 15 of the National Vacant Housing Reuse Strategy 2018 – 2021, available at: https://www.housing.
gov.ie/sites/default/files/publications/files/national_vacant_housing_reuse_strategy_0.pdf
DRAFT SOUTH DUBLIN COUNTY DEVELOPMENT PLAN 2022-2028 39Table 5: South Dublin County Housing Stock (2002 - 2016)
Total Housing
Year Vacant (%) Change (No.) Change (%)
Stock
2002 76,666 2,146 (2.8%) - -
2006 87,484 5,424 (6.2%) +10,818 +14.1%
2011 97,298 5,225 (5.4%) +9,814 +11.2%
2016 98,387 3,495 (3.6%) +1,089 +1.12%
2002 – 2016 - +1,349 +21,721 +28.3%
Table 6 illustrates the growth in housing and vacancy levels between 2011 – 2016
within the different settlement areas.
In the five years 2011-2016, 4,549 units were newly occupied either through
occupation of previously vacant houses or new build. Of the new housing stock, 86%
was located within Dublin City and Suburbs, followed by 8% in Rathcoole 4.5% in
Saggart and 1.5% in Newcastle. It is noted that Saggart’s housing stock increased by
51% between 2011 and 2016 because of reduced vacancy.
Table 6: South Dublin County Housing and Vacancy (2011 - 2016)
2011 - 2016 2011 - 2016
2011 2016
Type - Change (No.) - Change (%)
Units Vacant Units Vacant Units Vacant Units Vacant
5,225 3,495
County 92,073 94,892 +2,819 -1,730 +3.1% -33.1%
Core Strategy and Settlement Strategy (CS)
(5.7%) (3.7%)
5,016 3,328
Total Urban 90,483 93,270 +2,787 -1,688 +3.1% -32.7%
(5.5%) (3.6%)
Dublin City 4,49 3,033
86,695 89,125 +2,430 -1,462 +2.8% -32.5%
and Suburbs (5.2%) (3.4%)
282 152
Saggart 1,167 1,294 +127 -130 +10.9% -46.1%
(24.2%) (11.8%)
111 80
Rathcoole 1,456 1,679 +223 -31 +15.3% -27.9%
(7.6%) (4.8%)
128 63
Newcastle 1,165 1,172 +7 -65 +0.6% -50.8%
(11%) (5.4%)
209 167
Rural 1,590 1,622 +32 -42 2% -20.1%
(13.1%) (10.3%)
2.5.4 Planning and Construction Activity
The monitoring of construction and planning activity is an invaluable tool to ensure a
clear understanding of housing delivery and the type of planning permission and
commencements at different locations across the County. There are a number of data
sources in relation to housing activity available. Principal sources used are; SDCC
figures supplied to the Housing Supply Coordination Taskforce (HTF), the Building
Control Management System (BCMS) commencements and the Central Statistics
Office (CSO).
40 DRAFT SOUTH DUBLIN COUNTY DEVELOPMENT PLAN 2022-2028The Housing Taskforce (HTF) tracks the quantum of residential development for 10 or
more units in the four Dublin Local Authorities on a quarterly basis, since 2016. It
provides detailed insight into planning and construction activity in the residential sec-
tor and the inter-relationship between same.
The Central Statistics Office (CSO) quarterly reports monitor housing completions.
The information is also broken up by Eircode for spatial locations and for each Local
Authority. As required under the Housing Supply Guidelines discussed below, the
CSO data forms the benchmark for constructed units and guides the formation of
this Core Strategy. Figure 5 illustrates how completed units have increased between
2017 and 2020 with 5,914 units constructed over that period. Between 2017 and 2020
inclusive, as construction activity recovered after the economic crash, an average of
1,478 units were completed a year. The most recent years (2018 – 2020) reached an
average of 1,644 units a year.
Core Strategy and Settlement Strategy (CS)
Figure 5: Constructed Units in SDCC and Cumulative Total 2011 – 2020, Source: CSO, NDQ06
In Quarter 3 of 2020, there was planning permission in SDCC for 11,448 units which
were either under construction or permitted and not commenced across normal (99
units and less) and Strategic Housing Development applications (more than 99 units).
Strategic Housing Developments (SHDs) comprise a total of 54% of the total units
with permission A significant quantum was granted since Q4 2019 with on-going
pre-planning for further units.
In terms of deliverability, between commencement of the SHD process in 2017 and
Q3 2020, 11% of the permitted SHD units have either commenced construction or
have been built. Delivery of these 100 plus unit developments in South Dublin County
has generally occurred along the periphery of the County (Citywest/Fortunestown)
and established areas (Rathfarnham) but not in the regeneration lands which account
for 30% of all SHDs permitted in the County. The deliverability of SHDs, especially
within key growth areas, will form part of the Core Strategy monitoring process.
Figure 6 illustrates the historical trend of planning permissions since 2016 up to Q3
2020. The graph shows how SHDs have increased the total quantum of planning
permissions within the County.
DRAFT SOUTH DUBLIN COUNTY DEVELOPMENT PLAN 2022-2028 41Figure 6: Quantum of Planning Permissions within South Dublin (Source: HTF Series 2016 -
2020)
Figure 7 below illustrates the number of sites with extant planning permission and of
these, the quantum which are under construction per quarter since 2016 in South
Dublin. The average trend indicates that half of sites (51%) with planning have not
commenced. This could reflect a range of factors including market forces, permission
sought to increase land value for re-sale, issues with sourcing the appropriate level of
funding to commence construction, capacity of construction industry, etc. While
COVID-19 has influenced this gap in terms of commencements, the trend of planning
permissions relative to active sites (see linear lines in Fig. 7) was continuing to
Core Strategy and Settlement Strategy (CS)
diverge by the end of 2020.
Figure 7: Construction Activity of Residential Sites in South Dublin County (Source: HTF Series
2016 - 2020)
42 DRAFT SOUTH DUBLIN COUNTY DEVELOPMENT PLAN 2022-2028Based on these trends, it can be assumed that South Dublin County will have, on an
ongoing basis, a quantum of sites that are suitable for residential development and
that have the benefit of planning permission, which may not be brought forward for
development within the lifetime of the Plan, or sites which may not come forward for
planning at all.
2.5.5 Housing Supply Targets
The Department of Housing, Local Government and Heritage issued Section 28
Guidelines titled: “Housing Supply Target Methodology for Development Planning”,
December 2020 (‘the Supply Guidelines’) to assist in providing Planning Authorities
with the figures and methodology to incorporate national and regional population
and housing projections into their statutory functions.
The Supply Guidelines, informed by research carried out by the Economic and Social
Research Institute (ESRI), outline that of the three options put forward by ESRI in
their projections; the option to be used by local authorities in their Core Strategy is
the NPF 50:50 City scenario. Table 7 shows the overall target for housing for South
Dublin County for the Development Plan period.
Table 7: South Dublin Housing Demand Figures 2021 – 2028*
South Dublin County Council Annual Average Total Households
ESRI NPF scenario projected new household
A 1,806 21,680
demand 2017 to 2028
Core Strategy and Settlement Strategy (CS)
B Actual new housing supply 2017-end of 2020 1,479 5,914
Homeless households**, and estimated
C N/A 2,050
unmet demand as of Census 2016
Housing Demand 2021-2028 = Total
D 2,299 17,817
(B+D-C)/ 7.75yrs
*Methodology based on Housing Supply Guidelines issued by Department of Housing, Local
Government and Heritage
** Homeless figure as per the ESRI data and has not increased to date.
As outlined in Figure 5, South Dublin County’s annual rate of construction between
2017 and 2020 inclusive was on average 1,479 units a year with the last three years
averaging 1,644 units. However, this was below the overall average demand for the
County for 2017 – 2031 of 1,832 units a year set out by the ESRI in ‘Projected Housing
Demand by Local Authority Area 2020 – 2031, ESRI NPF Scenario Housing Supply
Target’. The shortfall, as result, has been carried forward into the years leading up to
and the lifetime of the Development Plan period up to 2028 requiring on average
2,299 housing units a year.
The required housing figures, in the context of the NPF 50:50 scenario and units
completed is outlined in Figure 8. The specific calculations and methodologies in
arriving at the above figures, in line with the Ministerial Guidelines, is set out under
Appendix 2B.
DRAFT SOUTH DUBLIN COUNTY DEVELOPMENT PLAN 2022-2028 43Figure 8: South Dublin County Council – Average Annual Housing Supply Requirement up to
2028
2.5.6 Development Plan Population and Housing Requirements
Based on the population targets and housing need set out within National and
Regional planning policy, the Development Plan must accommodate an additional:
Core Strategy and Settlement Strategy (CS)
46,518
In doing so, the housing
persons 17,817
need, which accounts for
up to a target housing units between
the current under supply
population of 2021 in 2028
amounts to:
325,285 in 2028
The combination of the additional housing units required alongside the population
growth indicates an anticipated reduction in average household size for the overall
County. By 2028, with a total population of 325,285 persons and a total housing stock
of 118,632 houses, the household size will be an average of 2.74 per house. This is a
reduction from 2.99 in 2016 and is consistent with the downward national trend of
household size, from 2.75 in 2016 to 2.5 in 2040, outlined in the National Planning
Framework.
It is noted that there is variation above and below the household size depending on
the typologies of extant planning permission, as well as demographic and household
composition in each neighbourhood area whether urban or rural. This average
household size has informed the population distribution as part of the Settlement
Strategy, informed by the Core Strategy, as set out in the next section.
44 DRAFT SOUTH DUBLIN COUNTY DEVELOPMENT PLAN 2022-20282.6 Core Strategy
This Section of the Chapter sets out the following elements that comprised the
preparation of the Core Strategy:
àà Land capacity - available land for development
àà The Planning, Infrastructure and Deliverability of available land
àà Proposed land for the Development Plan period.
This Core Strategy section has been prepared in the Context of Sections: 2.3
(Statutory Context), 2.4 (National, Regional and Ministerial Planning Policy), and 2.5
(Population and Housing data) of this Chapter.
1. 2. 3. 4.
Land Capacity Infrastructure Planning Deliverability
Study Assessment Assessment Analysis
2.6.1 Land Capacity Study
The Development Plan is tasked with ensuring that sufficient and suitable land is
zoned for residential use, or for a mixture of residential and other uses, to meet the
requirements of the projected population and to ensure that a scarcity of such land
does not occur at any time during the period of the Development Plan.
Core Strategy and Settlement Strategy (CS)
A Land Capacity analysis was carried out by the Planning Department to calculate
the potential yield of undeveloped land (RES, RES-N, TC, REGEN, VC, DC, LC and
SDZ) zoned in the 2016 - 2022 County Development Plan.
The capacity figure has been prepared in the context of Section 28 Ministerial
Guidelines promoting higher densities, especially near existing and proposed public
transport services as set out in the ‘Sustainable Residential Development in Urban
Areas’ (2009), ‘Sustainable Urban Housing: Design Standards for New Apartments’
Guidelines and ‘Urban Development and Building Heights Guidelines for Planning
Authorities’ (2018).
The potential yield of undeveloped lands excludes units built and units under con-
struction since the previous capacity audit in 2015. Since then, 5,914 units have been
built while 4,557 are under construction amounting to a total of 10,471 units. These
figures form part of the Core Strategy Table 10 and formation of the Settlement
Strategy discussed further in this Chapter.
Therefore, the total land capacity including long term development land within the
County is 1,039 hectares with capacity to accommodate: 44,472 residential units. This
equates to an average of 43 units per hectare.
Excluding those lands identified for strategic long-term development within SDZs
and major regeneration sites, outside the Development Plan period (see below)
DRAFT SOUTH DUBLIN COUNTY DEVELOPMENT PLAN 2022-2028 45allowable under Ministerial Circular, 20106, the analysis estimates a potential for
23,730 units on 477 hectares of developable land within the lifetime of the
Development Plan period. This equates to an average yield of 50 units per hectare.
Zoned land with extant permission not commenced (estimated 6,517 units) has been
recognised and factored into the Core Strategy figure. In considering such extant
permissions a deliverability analysis has also been carried out and has informed the
development of the Core Strategy.
The potential yield of undeveloped land in each settlement and neighbourhood area,
identifying greenfield and brownfield lands, is contained within Table 9.
Strategic Long Term Development Areas (SDAs)
As indicated above, South Dublin County has strategic long term development
potential within the Strategic Development Zones (SDZs) and zoned regeneration
areas. These areas provide a strategic quantum of development for South Dublin
along existing and planned rail corridors which are identified as key residential and
employment growth areas within the Metropolitan Area Strategic Plan. Table 8 below
illustrates the full capacity of these lands:
Table 8: Total Land Capacity within Strategic Development Areas
Strategic Total Land (Hectares)
Overall Unit
Settlement Development
Capacity
Zones (SDZs) Brownfield Greenfield
Adamstown SDZ
5,240 0 80
Core Strategy and Settlement Strategy (CS)
Planning Scheme
Dublin City Clonburris SDZ
7,730 – 11,098 0 252
and Suburbs Planning Scheme
(Within and Naas Road lands * 267 13
Contiguous) Tallaght Local Area
8,400 - 11,144 108 0
Plan (Regen Lands)
Sub-Totals of SDAs - 375 (51%) 345 (49%)
Totals 21,370 – 27,482 720
* Final figure will be subject to the Naas Road Framework Plan.
Significant areas of these lands have been excluded from the land capacity over the
Development Plan period except where it is considered a percentage of development
can occur within that timeframe. Of the total capacity for the SDA lands,
approximately 150 ha providing for more than 7,500 units has been identified as
being deliverable over the Development Plan period and is included in the land
capacity figures in Table 9. This figure for SDA lands is informed by an understanding
of the pipeline and potential for housing delivery on Council owned lands, historical
trends of housing delivery on SDA lands within South Dublin and by delivery of
similarly designated sites within the region.
6 The Guidance Note on Core Strategies, DECLG (2010) outlines that “any excess (of lands or housing
capacity) will not normally include lands identified for strategic long-term development as part of Strategic
Development Zones or major regeneration sites within key areas”.
46 DRAFT SOUTH DUBLIN COUNTY DEVELOPMENT PLAN 2022-2028It is recognised that a wide range of elements can influence the deliverability of
strategic long term development areas, including: Market viability, site assembly,
public / private funding streams, timelines and funding for delivering physical
infrastructure, and pressure for piecemeal sites coming forward.
Having regard to the numerous variants, the need for developing a plan-led approach
to these strategic lands is critical to their successful growth in a manner which
contributes towards Quality Design and Healthy Placemaking in line with the
provisions of Chapter 5 of this plan. In this regard, SDZ schemes are in place for
Adamstown and Clonburris. Tallaght Town Centre is subject to a Local Area Plan
adopted in 2020.
The Naas Road/ Ballymount lands form a significant landbank within South Dublin
adjoining Dublin City Council. The development of the Naas Road lands, as noted
under the RSES, is a medium to long-term infrastructure sequence with potential for
residential development and more intensive employment/mixed uses. The
development of this area requires significant investment and site assembly to enable
the full development potential and is subject to a Strategic Framework Plan in
collaboration with Dublin City Council. The full build out of these lands will take time,
and ensuring it is plan-led is central to the successful development of the County and
the wider region.
Policy CS1: Strategic Development Areas
Prioritise housing and employment growth within the identified residential and
employment growth areas set out under the Metropolitan Area Strategic Plan.
Core Strategy and Settlement Strategy (CS)
CS1 Objective 1:
To ensure a sustainable and plan led allocation of housing and employment
growth within the strategic development areas of South Dublin County in line with
the provisions of the MASP.
CS1 Objective 2:
To support continued collaboration between infrastructure providers, state
agencies and local authorities to inform cross sectoral investment plans and
capital spending plans to accelerate the development of strategic development
areas and secure the best use of public lands in the Dublin Metropolitan Area
– consistent with RPO 5.1.
CS1 Objective 3:
To seek funding from appropriate sources, including central government funding
mechanisms, to secure the delivery of National Strategic Outcomes for the
strategic development areas under the National Planning Framework.
DRAFT SOUTH DUBLIN COUNTY DEVELOPMENT PLAN 2022-2028 47Policy CS2: Naas Road/Ballymount Regeneration Lands
Deliver a development framework for the regeneration of the Naas Road lands in
conjunction with Dublin City Council which underpins the strategic aims of the
National Planning Framework and Regional Spatial and Economic Strategy
CS2 Objective 1:
To prepare a Local Area Plan or other appropriate mechanism for the zoned
Regeneration (REGEN) lands at Naas Road/Ballymount to include the Local
Centre zoning (LC) at Walkinstown. The LAP or equivalent will provide a
framework for the sequential and phased development of the lands, integrating
sustainable transport, land use and blue and green infrastructure. The spatial
planning of the area will be informed by the Naas Road Framework until such time
as a Statutory Plan is in place.
CS2 Objective 2:
To facilitate a co-ordinated approach and vision to any future sustainable
development of the Naas Road Framework area in consultation with Dublin City
Council, and all relevant stakeholders including the local community, and ensure
that the needs of the existing and new community will be met, and the provision of
necessary community and physical infrastructure is delivered in tandem with any
new development.
Land Capacity and Zoning Requirements
Excluding lands identified for strategic long-term development that will happen
beyond the timescale of this Development Plan within SDZs, and major regeneration
sites (allowable under Ministerial Circular, 2010), there is potential for 23,730 units on
Core Strategy and Settlement Strategy (CS)
477 hectares of developable land within the lifetime of the Development Plan period.
The breakdown of the capacity per neighbourhood area and settlement and analysis
of capacity against housing need is set out under Table 9 below.
Based on the housing capacity of existing undeveloped zoned land in South Dublin
County, there is no requirement to zone additional land to serve the needs of
population and housing targets set by the Ministerial Guidelines and the NPF
Roadmap described under Sections: 2.3 (Statutory Context), 2.4 (Strategic Context
- National, Regional and Ministerial Planning Policy), and 2.5 (Population and Housing
Data) of this Chapter.
48 DRAFT SOUTH DUBLIN COUNTY DEVELOPMENT PLAN 2022-2028Table 9: Capacity of undeveloped lands within South Dublin
Greenfield sites Brownfield sites
Settlement Type
Residential (HA)
Mixed-Use (HA)
Total Potential
Total Potential
Residential
Settlement
Mixed-Use
(Units)
(Units)
(Units)
Name
(HA)
Tallaght 22.5 0 661 0 0 28.13 0 2,902 50.7 3,563
Naas Road 0 0 0 0 0 21.73 0 1,123 21.73 1,123
Templegoue,
Walkinstown,
Dublin City and Suburbs
97.02 0 4,222 0 0 11.88 0 890 108.9 5,112
Rathfarnham,
Firhouse
Clondalkin,
Clonburris and 4.05 10.84 286 798 73.31 17.62 2,744 1,355 105.82 5,183
Grange Castle
Lucan,
Adamstown, 5.92 0.36 464 20 52.6 16.93 1,748 1,226 75.81 3,458
Palmerstown
Citywest 45.94 2.64 2,604 159 2.45 2.25 245 135 53.28 3,143
Sub-total of Dublin City
175.5 13.84 8,237 977 128.36 98.54 4,737 7,631 416.2 21,582
and Suburbs
Self-Sustaining Town:
5.77 0.27 202 10 0 1.13 0 39 7.17 251
Saggart
Core Strategy and Settlement Strategy (CS)
Self-Sustaining Growth
Town:
22.79 1.42 797 50 0 1.12 0 39 25.33 886
Newcastle
Self-Sustaining Growth
Town:
24.47 1.13 820 39 1.94 0 0 68 27.54 927
Rathcoole
Sub-total of Towns 53.03 2.82 1,819 99 1.94 2.25 0 146 60.04 2064
Sub-total of urban area 228.5 16.66 10,056 1,076 130.3 100.7 4,737 7,777 477 23,730
Combined Totals 245 11,132 231 12,514
A – Total Capacity South Dublin County - - 477 23,730
B - Housing Need for South Dublin County (2017 – Q3 2028) - - - 23,731
C - Completed Units (2017 – 2021) - - - 5,914
D – Housing Need for South County Dublin (2021 – 2028) (B
- - - 17,817
minus C)
E - Units under construction (Estimated from Feb 2021) - - - 4,557
F - Net Housing Need for South Dublin County (2021 – 2028) - - - 13,260
(D minus E)
G – Surplus (A minus F) across Tier 1 and Tier 2 - - - 10,470
Note: Rural housing and population growth has not been included within the land capacity
figure but has been considered in the context of the rural settlement strategy policy and past
trends in order to inform the Core Strategy.
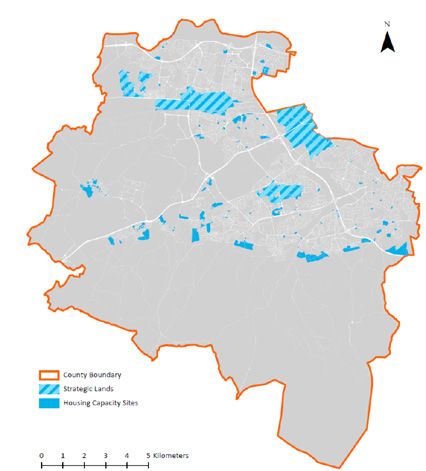
DRAFT SOUTH DUBLIN COUNTY DEVELOPMENT PLAN 2022-2028 49Image of Land Capacity Sites
The below map illustrates the extent of the total housing capacity sites of 44,472 on
1,039 Hectares on available already zoned land.
Core Strategy and Settlement Strategy (CS)
Figure 9: Housing Capacity Sites
As set out above, there is a Housing Need for 13,260 new homes up to 2028 which in
addition to the units under construction will meet the requirement for 17,817 homes.
The following sections examine the suitability of lands capable of delivering these
13,260 new homes over the lifetime of the Development Plan period.
50 DRAFT SOUTH DUBLIN COUNTY DEVELOPMENT PLAN 2022-20282.6.2 Tiered Approach to Land Zoning
An Infrastructural Assessment of the available developable lands was undertaken
guided by the requirements under NPO 72a of the NPF. Further detail of the
assessment is set out under Appendix 2A of the Development Plan.
NPO 72a requires Planning Authorities to apply a standardised, tiered approach to
differentiate between; i) zoned land that is serviced (Tier 1) ; and ii) zoned land that is
serviceable within the life of the Plan (Tier 2) (Appendix E of the National Planning
Framework, 2040).
The infrastructural assessment determined that all existing zoned lands with potential
to deliver homes could be categorised as either Tier 1 or Tier 2 lands in line with the
NPF criteria capable of facilitating a potential total of 23,730 units.
Tier 1 lands have the potential to accommodate: 11,597 units on c.196 hectares and
Tier 2 lands have the potential to accommodate: 12,133 units on c.281 hectares.
Following from the above it is noted that the NPF specifically discusses the
prioritising of development lands and states that there are many other planning
considerations relevant to land zoning beyond the provision of basic enabling
infrastructure including overall planned levels of growth, location, suitability for the
type of development envisaged, availability of and proximity to amenities, schools,
shops or employment, accessibility to transport services etc.
It is set out that weighing up these factors, together with the availability of
infrastructure, will assist planning authorities in determining an order of priority to
Core Strategy and Settlement Strategy (CS)
deliver planned growth and development.
2.6.3 Planning Analysis
Having established that all existing lands zoned within the County fall within Tier 1 or
Tier 2 and to inform an order of priority to deliver planned growth and development
in line with the NPF, a further planning analysis was carried out. This assessed existing
zoned lands in respect of their ability to contribute towards National Strategic
Outcomes relating to compact growth, enhanced regional accessibility, sustainable
mobility, climate action and a transition to a low carbon and climate resilient society.
(Appendix 2A refers).
Of the 477 hectares of existing zoned lands, (which excludes those lands identified as
long-term strategic lands within the SDAs), 343 ha capable of delivering 16,992 units
achieved a high planning score and 134 Ha capable of delivering 6,738 units received
a medium to high planning score.
The result of this further planning assessment indicates that all lands currently zoned
and identified as being capable of delivering residential development within the
County were capable of contributing in a positive manner to the achievement of the
above NSOs.
DRAFT SOUTH DUBLIN COUNTY DEVELOPMENT PLAN 2022-2028 512.6.4 Deliverability Analysis
As set out above, all existing zoned lands within the County were either Tier 1 or Tier
2 and were capable of contributing towards the achievement of the considered NSOs.
Consideration is also given to ensuring that the delivery of housing to meet the needs
of current and future population in line with national targets during the course of the
plan period can be sustainably achieved.
In this regard the balance between the deliverability of units and avoiding an overly
rigid identification of specific capacity lands forms a key part of the Core Strategy.
The approach taken considers the need to promote compact growth in a balanced
way within each neighbourhood area according to its role and function within the
settlement hierarchy.
To achieve this objective a prioritised level of growth of undeveloped land (excluding
units/land under construction) for each Neighbourhood Area based on past
construction and deliverability was applied with a focus on the SDAs identified under
the MASP; amounting to 9,439 units representing a total of 71% of units being within
the SDZs and Regeneration Lands (57% at 7,616) and within Fortunestown (14% at
1,823). In addition, a further allocation of 3,075 (23%) has been provided for within
the Dublin City and Suburbs settlement of undeveloped land, excluding land under
construction. This facilitates the delivery of a total of 12,514 units, or 94% of the
County’s growth which exceeds the requirements of NPO 3b and RPO 3.2. The
remaining balance has been allocated to the three settlements: Saggart, Newcastle
and Rathcoole totalling 746 units (6%), providing for an overall total allocation of
13,260 units. In addition to the units under construction this provides for the supply
target of 17,817 units over the course of the Plan.
Core Strategy and Settlement Strategy (CS)
The Council is actively engaged with social and affordable housing delivery and has a
strong supply pipeline which will be delivered over the Development Plan period and
will provide for a significant proportion of the annual housing targets for the County.
However, in terms of deliverability from a private development perspective, the
following factors have been considered:
àà 94% of the allocated unit growth is within Dublin City and suburbs with
approximately half of allocated lands identified as brownfield. Such lands can
present challenges in terms of contaminated sites, landownership and site
assembly, phasing and sequencing.
àà The housing data and trends within the County indicate that approximately half
(51%) of sites with permission are activated at any given time while the remainder
may take time to commence based on a range of factors (e.g. raising of funding,
potential market changes) or that permissions may not be implemented at all
during their lifetime.
àà Larger developments (SHDs) comprise a significant element of permitted units
throughout the County and delivery has been limited to certain neighbourhood
areas to date.
This presents a challenge which the Council is closely monitoring and in recognition
of the above, a flexible approach to provide for delivery has been incorporated into
52 DRAFT SOUTH DUBLIN COUNTY DEVELOPMENT PLAN 2022-2028the Plan through Objective CS3 Objective 3. This will ensure an adequate supply of
suitable lands come forward to complement the Council’s supply pipeline and achieve
the housing supply targets.
Therefore, while the County has an excess of zoned land required to deliver the
supply targets this is considered necessary to facilitate a choice in sites that come
forward recognising that not all sites may be available within the plan period. The
analysis carried out identified that such lands are serviced (Tier 1) and/or serviceable
(Tier 2) and achieve a medium to high planning score. As a result, they have the
potential to contribute towards sustainable development, ensuring that any obstacles
to delivery in one area or site can be overcome by provision within another site or
area. This will ensure sufficient lands are available to meet the supply targets
identified.
Key to ensuring this flexible approach and alignment with National and Regional
Planning Policy is the Council’s Active Land Management objective to monitor
construction and planning activity throughout the County at a settlement level as
outlined under section 2.6.7: Monitoring of Growth / Active Land Management of this
Chapter. The Core Strategy figures for each neighbourhood area serve as a
benchmark for monitoring to ensure compliance with National and Regional figures.
2.6.5 Core Strategy – 2022 – 2028 Development Plan
Table 10 sets out the Core Strategy for this Development Plan. Figure 10 represents a
diagrammatic map of the Core Strategy.
Core Strategy and Settlement Strategy (CS)
In line with the above, the Core Strategy figures set out in Table 10 factor in built units
alongside sites under construction, sites with planning permission but not
commenced, a proportion of deliverable units within the strategic long-term
development areas (SDZs and Regeneration lands which may include Tier 2 lands in
areas such as Clonburris where funding to service such lands has been allocated) and
sites allocated government funding.
Growth was allocated based on an estimated year on year unit delivery within each
Neighbourhood Area based on the considerations set out above.
This has been guided by the housing capacity of existing undeveloped zoned land in
South Dublin, the needs for Housing units by the Ministerial Guidelines and other
Planning policy documents set out under Sections: 2.3 (Statutory Context), 2.4
(Strategic Context - National, Regional and Ministerial Planning Policy), 2.5
(Population and Housing Data), 2.6 (Core Strategy) of this Chapter.
DRAFT SOUTH DUBLIN COUNTY DEVELOPMENT PLAN 2022-2028 53Table 10: Core Strategy Table 2022 – 2028
(Units) 2021 – 2028
Population Growth
Area / Settlement
2016 units & share
from2016 persons
persons and share
Settlement Type
2016 to Q4 2020
Total 2028 units
Neighbourhood
Total Land (HA)
Estimated Built
Total Housing
and share (%)
and share (%)
and share (%)
2016 persons
Target 2028
2021 - 2028
No. (%)
Name
(%)
(%)
Tallaght 24,080 700 2,000 26,780 76,525 +5,175
71,350 42.54
(25%) (12%) (11%) (22%) (24%) (7%)
Naas Road 396 15 1,010 3,349 +1,965
1,384 20.02 1,421 (1%)
(0.4%) (0%) (6%) (1%) (142%)
Templegoue,
Dublin City and Suburbs
Walkinstown, 28,503 1,750 1,953 32,206 85,264 +7,098
78,166 55.91
Rathfarnham, (30%) (30%) (11%) (27%) (26%) (9%)
Firhouse
Clondalkin,
14,869 200 5,385 20,454 55,206 +10,706
Clonburris and 44,500 122.3
(16%) (3%) (30%) (17%) (17%) (24%)
Grange Castle
Lucan,
19,069 1,625 3,322 24,039 68,483 +9,483
Adamstown, 59,000 93.83
(20%) (28%) (19%) (20%) (21%) (16%)
Palmerstown
Citywest 2,503 1,164 2,833 6,502 15,900 +7,662
8,238 78.52
(3%) (20%) (16%) (5%) (5%) (93%)
89,420 5,454 16,503 111,402 304,726 42,088
Sub-Total 262,638 413
(94%) (93%) (93%) (93.7%) (93%) (+16%)
Self-Sustaining Town:
1,142 85 96 1,323 3,531 +398
3,133 3.57
Saggart (1%) (1%) (0.5%) (1%) (1%) (13%)
Core Strategy and Settlement Strategy (CS)
Self-Sustaining Growth
Town: 100 638 1,847 5,039 +1,946
3,093 1,109 (1%) 32.66
(2%) (3.6%) (2%) (2%) (63%)
Newcastle
Self-Sustaining Growth
Town: 1,599 250 580 2,429 6,409 +2,058
4,351 24.43
(2%) (4%) (3%) (2%) (2%) (47%)
Rathcoole
3,850 435 1,314 5,599 14,979 +4,402
Sub-Total of Towns 10,577 60.65
(4%) (7%) (7%) (5%) (5%) (42%)
273,215 93,270 5,914 474 17,817 117,001 319,705 +46,491
Urban Aggregate
(98%) (100%) (98.3%) (98%) (17%)
5,552 1,622 0 0 0 1,622 5,579 +27
Aggregate Rural Area
(2%) (2%) +(0.5%)
46,518
South Dublin Totals 278,767 94,892 5,914 474 17,817 118,623 325,285
(+16.7%)
* Percentages are rounded to the nearest whole number.
Note: The allocation for Rural Housing and Population growth is based on new housing
delivery over the previous plan period and will be managed through the rural settlement policy.
Note: Estimated built units taken from the Housing Task force data which was cross referenced
against the CSO figures to determine the Neighbourhood share.
54 DRAFT SOUTH DUBLIN COUNTY DEVELOPMENT PLAN 2022-2028Lucan
M4 M50
Adamstown N4
Clonburris
Grand Canal
Naas Road
Clondalkin
Grange Castle
Kilcarberry
Newcastle Tallaght
Fortunestown
Saggart
N7 Rathcoole
Citywest
N81
River Dodder
Core Strategy and Settlement Strategy (CS)
N
Self-Sustaining Growth Town Luas Red Line
Self-Sustaining Town Dublin Cork Railway
Existing Urban Centres within Dublin City & Suburbs
Dublin City & Suburbs
MASP Residential Growth Areas
MASP Employment Area
Strategic Green Corridors
MASP Regeneration Land
Figure 10: South Dublin County Core Strategy Map 2022 – 2028
DRAFT SOUTH DUBLIN COUNTY DEVELOPMENT PLAN 2022-2028 55You can also read


