Correlation between fundus autofluorescence and visual function in patients with cone rod dystrophy - Nature
←
→
Page content transcription
If your browser does not render page correctly, please read the page content below
www.nature.com/scientificreports
OPEN Correlation between fundus
autofluorescence and visual
function in patients with cone‑rod
dystrophy
Satoru Kanda1,2, Takumi Hara2, Ryosuke Fujino1,2, Keiko Azuma2, Hirotsugu Soga2,
Ryo Asaoka2,3,4, Ryo Obata2 & Tatsuya Inoue2,5*
This study aimed to investigate the relationship between autofluorescence (AF) signal measured
with ultra-wide field imaging and visual functions in patients with cone-rod dystrophy (CORD). A
retrospective chart review was performed for CORD patients. We performed the visual field test
and fundus autofluorescence (FAF) measurement and visualized retinal structures with optical
coherence tomography (OCT) on the same day. Using binarised FAF images, we identified a low FAF
area ratio (LFAR: low FAF/30°). Relationships between age and logMAR visual acuity (VA), central
retinal thickness (CRT), central choroidal thickness (CCT), mean deviation (MD) value, and LFAR were
investigated. Thirty-seven eyes of 21 CORD patients (8 men and 13 women) were enrolled. The mean
patient age was 49.8 years. LogMAR VA and MD were 0.52 ± 0.47 and − 17.91 ± 10.59 dB, respectively.
There was a significant relationship between logMAR VA and MD (p = 0.001). LogMAR VA significantly
correlated with CRT (p = 0.006) but not with other parameters. Conversely, univariate analysis
suggested a significant relationship between MD and LFAR (p = 0.001). In the multivariate analysis,
LFAR was significantly associated with MD (p = 0.002). In conclusion, it is useful to measure the low
FAF area in patients with CORD. The AF measurement reflects the visual field deterioration but not VA
in CORD.
Retinal dystrophy belongs to a set of hereditary diseases that affect photoreceptors and lead to blindness in devel-
oped countries1. The worldwide prevalence of retinal dystrophy is estimated at more than 2 million patients, and
several causative genes have been identified2. In inherited retinal dystrophies, cone-rod dystrophy (CORD) is
characterized by primary cone photoreceptor i mpairment3. At the end stage, CORDs occasionally cause periph-
eral visual dysfunction, followed by the loss of rod photoreceptor cells.
Fundus autofluorescence (FAF) allows us to evaluate retinal pigment epithelium (RPE) and photoreceptor
function non-invasively. The usefulness of FAF has been reported in several retinal diseases, such as retinitis
pigmentosa (RP), Stargardt disease, and CORD, in previous studies4–16. In general, the hyperfluorescence in blue
FAF shows abnormal accumulation of lipofuscin and suggests degenerating photoreceptor cells; in contrast, the
hypofluorescence in blue FAF is considered to be RPE and photoreceptor cell a trophy17–21.
The Optos (Optos 200Tx; Optos, Dunfermline, UK) allows the visualization in the retina at 200° in a
single frame. In previous studies, the utility of this instrument was revealed in R P12,22, age-related macular
degeneration23, chorioretinitis24, and retinal d
etachment25. FAF can also be measured in this area using the
device. The aim of our study was to investigate the relationship between FAF measured with the Optos and visual
functions in patients with CORD.
1
Asahi General Hospital, 1326, Asahi‑shi, Chiba, Japan. 2Department of Ophthalmology, The University of
Tokyo, 7‑3‑1 Hongo, Bunkyo‑ku, Tokyo, Japan. 3Department of Ophthalmology, Seirei Hamamatsu General
Hospital, Shizuoka, Japan. 4Seirei Christopher University, Shizuoka, Japan. 5Department of Ophthalmology and
Micro‑Technology, Yokohama City University, 4‑57 Urafune‑cho, Minami‑ku, Yokohama, Kanagawa 232‑0024,
Japan. *email: inouet‑tky@umin.ac.jp
Scientific Reports | (2021) 11:1911 | https://doi.org/10.1038/s41598-021-81597-7 1
Vol.:(0123456789)www.nature.com/scientificreports/
Methods
The present study enrolled consecutive CORD patients. The study protocol was approved by the Research Eth-
ics Committee of the Graduate School of Medicine and Faculty of Medicine at The University of Tokyo. The
study adhered to the tenets of the Declaration of Helsinki. Written informed consent was obtained from each
participant. Written informed consent and consent to publish the data in an online open access publication were
obtained from each participant. For the participant under the age of 20, informed consent was obtained from
the parents.
The diagnosis of CORD was made based on optical coherence tomography (OCT), fluorescein angiography
(FA), and electroretinogram (ERG). Each patient underwent visual field testing with the Humphrey field analyser
(HFA; Carl Zeiss Meditec, Dublin, CA) using the Swedish interactive threshold algorithm standard programme
and the 10-2 test pattern. Unreliable visual fields were excluded from the study; the fixation losses ≥ 20%, the
false-positive rates ≥ 15%, and the false-negative rates ≥ 33% as determined by SITA-Standard26.
In addition to visual field testing with HFA, wide-field fundus FAF images were obtained using the Optos
imaging system simultaneously. The Optos uses green light of a wavelength of 532 nm for excitation and detects
the emitted signal with a detector for light of a wavelength of 570–780 nm27. To improve image quality and
because OCT measurements and ophthalmoscopic examination were concurrently performed, the pupil was
dilated using topical applications of tropicamide and phenylephrine. We simultaneously obtained spectral-
domain OCT (SD-OCT) images using Spectralis OCT (Heidelberg Engineering, Heidelberg, Germany). Sub-
sequently, the central retinal thickness (CRT) and central choroidal thickness (CCT) were measured in each
CORD eye.
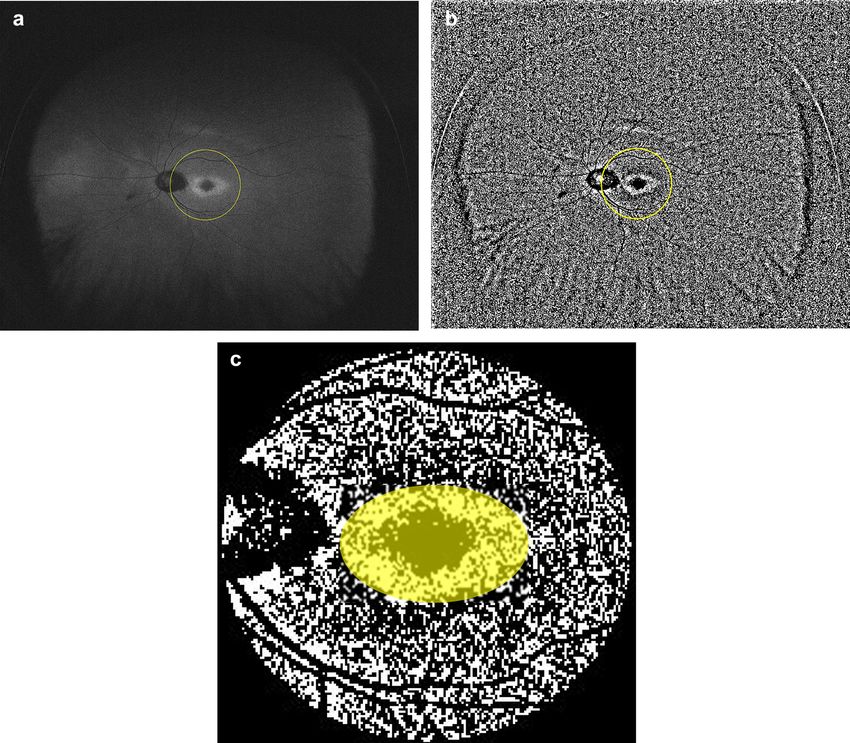
Using the images measured with Optos, we calculated a low FAF area using the ImageJ software (http://image
j.nih.gov/ij/; provided in the public domain by the National Institutes of Health, Bethesda, MD, USA). We ana-
lysed FAF images within 30° in the macula because the centre of the optic nerve head is located approximately
15° nasal to the fovea (Fig. 1A). First, the border of the abnormal FAF area was identified. Next, the obtained FAF
images were binarised with Niblack’s method (Fig. 1B). The images were converted to 8-bit images and adjusted
with Niblack’s auto-local threshold in ImageJ software. With Niblack’s method, we could automatically separate
the low FAF area from the total abnormal FAF area. Finally, the sum of low FAF signals was measured within
the abnormal autofluorescence area in the binarised image, and the low FAF area ratio (LFAR) was calculated as
the sum of low FAF pixels within 30° (Fig. 1C).
Correlations between visual functions (logMAR VA and the MD value) and morphologic parameters (CRT,
CCT, and LFAR) were investigated using the linear mixed model. Subsequently, models were selected to identify
the optimal linear regression model using the second-order bias-corrected Akaike’s information criterion (AICc)
index from all 2 4 patterns, comprising four variables (age, LFAR, CRT, and CCT). AIC is a well-known statisti-
cal measure used in model selection, and AICc represents a corrected version of AIC that provides an accurate
estimate even with a small sample s ize28,29.
Variables selected through model selection were considered to be statistically significant. All statistical analy-
ses were performed using the statistical programming language R ver. 3.4.3 (The R Foundation for Statistical
Computing, Vienna, Austria).
Results
Characteristics of the subjects are shown in Table 1. Thirty-seven eyes (18 right and 19 left eyes) of 21 patients
with CORD (eight men and 13 women) were expand. LogMAR VA and MD were 0.52 ± 0.47 [− 0.079 to 1.52]
and − 17.91 ± 10.59 [− 35.45 to − 0.58] dB, respectively. There was a significant relationship between logMAR
VA and the MD value (Fig. 2 p = 0.001, linear mixed model). The univariate analysis suggested that logMAR
VA significantly correlated with CRT (Fig. 3, p = 0.006, linear mixed model) but not with other parameters,
i.e., age, LFAR, or CCT (p > 0.05). Based on the AICc model selection, among age, LFAR, CRT, and CCT, the
optimal model for logMAR VA included only CRT (AICc = 39.3); LogMAR VA = 0.98–0.0040 (standard error
[SE] = 0.00136, p = 0.006) × CRT (Table 2).
The univariate analysis revealed a significant correlation between MD and LFAR (Fig. 4, p = 0.001, linear
mixed model) but not between MD and other parameters (age, CRT, and CCT, p > 0.05). The optimal model for
MD included only LFAR (AICc = 232.4). MD = − 14.9 to 34.7 (SE = 9.71, p = 0.002) × LFAR. No remaining vari-
able, i.e., age, CCT, or CRT, was included (Table 3).
Discussion
In the current study, the visual field and OCT measurements were performed along with wide-field FAF in
patients with CORD. We found that CRT significantly correlated with logMAR VA, suggesting that CRT was
the most useful parameter to predict logMAR VA. LFAR correlated with MD, but CRT did not correlate with
MD. This implied that the FAF measurement was more useful compared to OCT parameters when analysing
visual field deterioration in CORD.
In daily practice with CORD, VA is the most frequently used method to evaluate visual function. The cur-
rent result that VA was significantly associated with CRT supported the usefulness of this approach. However,
VA mainly reflected the visual function around the macula, and more detailed evaluation of retinal sensitivity
could not be performed without measuring the visual field. The current results suggested that MD of the visual
field correlated with LFAR but not with CRT or CCT. This result was in agreement with that of a previous study
by Oishi et al., who suggested that there was a correlation between the area of abnormal FAF and the central
scotoma size measured with Goldmann perimetry but not between the area of abnormal FAF and logMAR VA30.
These findings suggested that the disease status of CORD could not be completely explained simply based on
the thicknesses of the retina and choroid and were instead useful to evaluate retinal atrophy, particularly in the
Scientific Reports | (2021) 11:1911 | https://doi.org/10.1038/s41598-021-81597-7 2
Vol:.(1234567890)www.nature.com/scientificreports/
Figure 1. (a) Example of a fundus autofluorescence image of a 61-year-old man with cone-rod dystrophy. The
yellow circle indicates the area within 30° around the macula. FAF fundus autofluorescence, CORD cone-rod
dystrophy. (b) Binarization of the fundus autofluorescence image. The binarised image in the yellow circle area
was used to calculate the low FAF area ratio. FAF Fundus autofluorescence. (c) Calculation of the low fundus
autofluorescence (FAF) area ratio (LFAR). Using the binarised image, the low FAF signal was measured as the
sum of black pixels in the presumable abnormal autofluorescence area (yellow circle). Next, LFAR was calculated
as the ratio of black pixels in the abnormal FAF area to total pixels within 30° around the macula.
RPE and photoreceptor cells, with the FAF measurement. However, we did not evaluate the outer retinal struc-
ture, such as ellipsoid zone and interdigitation zone, which were reported to be affected in eyes with C ORD31.
It appears that the outer retinal structure rather than CRT might be associated with visual field deterioration.
There are previous reports that suggested the usefulness of measuring the FAF pattern in eyes with CORD. In
contrast to low AF resulting from retinal atrophy, particularly in the RPE and photoreceptor cells, the hyper-AF
area suggested a degenerative process. The hyperfluorescent AF signal was also important when assessing the
disease status of C ORD32,33. For instance, peripherin-2 (PRPH2) is one of the causative genes of CORD, and the
mutation of PRPH2 has been shown to be associated with a speckled pattern of FAF34. Other studies reported that
FAF imaging in eyes with X-linked RPGR-associated CORD demonstrated parafoveal hyperfluorescent rings, and
the size of the rings gradually increased over time16,35. Furthermore, hyper-AF was observed in the abnormal area
in eyes with R P36. Leber congenital amaurosis caused by the Crumb1 gene demonstrates a unique AF pattern in
which the AF signal is preserved in the para-arteriolar region37. In the current study, to highlight the usefulness
of the hypo-AF signal, we calculated LFAR in eyes with CORD even when both hyper- and hypo-AF signals
were observed in the abnormal AF area (Fig. 1). It is of our further interest to examine whether similar results
are obtained when the abnormal hyperfluorescent area are also analyzed. Furthermore, genetic backgrounds
Scientific Reports | (2021) 11:1911 | https://doi.org/10.1038/s41598-021-81597-7 3
Vol.:(0123456789)www.nature.com/scientificreports/
Variable Mean ± SD Range
Gender (male:female) 8:13
Age (years) 49.4 ± 15.6 17 to73
LogMAR VA 0.52 ± 0.47 − 0.079 to 1.52
Mean deviation − 17.9 ± 10.6 − 35.45 to − 0.58
LFAR 0.11 ± 0.17 0.0050 to 0.74
CRT (μm) 108.6 ± 55.1 24 to 217
CCT (μm) 206.4 ± 75.7 104 to 453
FL 0.047 ± 0.061 0 to 0.19
FP (%) 1.49 ± 2.26 0 to 10
FN (%) 4.03 ± 6.09 0 to 25
Table 1. Characteristics. SD standard deviation, Log MAR logarithm minimal angle resolution, LFAR low
fundus autofluorescence area ratio, CRTcentral retinal thickness, CCTcentral choroidal thickness, FL fixation
loss, FP false positive, FN false negative.
1.5
1.0
Log MAR VA
0.5
0.0
-35 -30 -25 -20 -15 -10 -5 0
MD[dB]
Figure 2. Relationship between logMAR VA and the MD value. There was a significant correlation between
logMAR VA and MD (p = 0.001, linear mixed model). VA visual acuity, MD mean deviation.
1.5
1.0
Log MAR VA
0.5
0.0
50 100 150 200
CRT[um]
Figure 3. Relationship between logMAR visual acuity (VA) and central retinal thickness (CRT). CRT was
significantly associated with logMAR VA (p = 0.006, linear mixed model). CRTcentral retinal thickness, logMAR
VA logarithm minimal angle resolution visual acuity.
of CORD were not investigated in the current study, so further studies are required to clarify the relationship
between an abnormal FAF area and VF deterioration considering genetic information.
A limitation of the current study was the accuracy of the visual field test. We used HFA to evaluate the visual
function in eyes with CORD. However, severe loss of central visual function might hamper accurate visual
field tests performed with HFA because of poor fixation. It may be valid to measure the visual field using a
microperimeter, in which the position of the retina is tracked, and the same location is stimulated at each target
Scientific Reports | (2021) 11:1911 | https://doi.org/10.1038/s41598-021-81597-7 4
Vol:.(1234567890)www.nature.com/scientificreports/
Univariate analysis Multivariate analysis
Variable Estimate Standard error p value Estimate Standard error p value
Age 0.00029 0.0066 0.97 N.S N.S N.S
LFAR 0.47 0.64 0.47 N.S N.S N.S
CRT 0.0040 0.0014 0.006 − 0.0040 0.0014 0.006
CCT 0.0016 0.0011 0.12 N.S N.S N.S
Table 2. Relationship between logMAR VA and other parameters. logMAR VA, logarithm minimal angle
resolution visual acuity; LFAR, low fundus autofluorescence area ratio; CRT, central retinal thickness; CCT,
central choroidal thickness; N. S., not selected.
0
-5
-15
MD[dB]
-25
-35
0.0 0.2 0.4 0.6
LFAR
Figure 4. Relationship between the mean deviation (MD) and low fundus autofluorescence area ratio (LFAR).
There was a significant relationship between MD and LFAR (p = 0.006, linear mixed model). MD mean
deviation, LFAR low fundus autofluorescence area ratio.
Univariate analysis Multivariate analysis
Variable Estimate Standard error p value Estimate Standard error p value
Age − 0.014 0.15 0.92 N.S N.S N.S
LFAR − 34.7 9.8 0.001 − 34.7 9.8 0.001
CRT 0.024 0.017 0.17 N.S N.S N.S
CCT 0.018 0.011 0.11 N.S N.S N.S
Table 3. Relationship between MD value and other parameters. MD mean deviation, LFAR low fundus
autofluorescence area ratio, CRTcentral retinal thickness, CCTcentral choroidal thickness, N.S. not selected.
presentation even with the loss of central visual function. Moreover, the sample size was relatively small. A further
study involving a larger number of eyes would be required.
Conclusion
In conclusion, it is useful to measure the low FAF area in patients with CORD, as suggested by the significant
relationship between LFAR and MD.
Received: 31 August 2020; Accepted: 7 January 2021
References
1. Hartong, D. T., Berson, E. L. & Dryja, T. P. Retinitis pigmentosa. Lancet 368, 1795–1809 (2006).
2. Berger, W., Kloeckener-Gruissem, B. & Neidhardt, J. The molecular basis of human retinal and vitreoretinal diseases. Prog. Retin.
Eye Res. 29, 335–375 (2010).
3. Traboulsi EI. Cone dysfunction syndromes, cone dystrophies, and cone-rod degenerations. Genetic Diseases of the Eye in Oxford
University Press. 410–420 (2012).
4. Robson, A. G. et al. Comparison of fundus autofluorescence with photopic and scotopic fine-matrix mapping in patients with
retinitis pigmentosa and normal visual acuity. Invest. Ophthalmol. Vis. Sci. 45, 4119–4125 (2004).
Scientific Reports | (2021) 11:1911 | https://doi.org/10.1038/s41598-021-81597-7 5
Vol.:(0123456789)www.nature.com/scientificreports/
5. Robson, A. G. et al. Functional characterization and serial imaging of abnormal fundus autofluorescence in patients with retinitis
pigmentosa and normal visual acuity. Br. J. Ophthalmol. 90, 472–479 (2006).
6. Murakami, T. et al. Association between abnormal autofluorescence and photoreceptor disorganization in retinitis pigmentosa.
Am. J. Ophthalmol. 145, 687–694 (2008).
7. Fleckenstein, M. et al. Discrete arcs of increased fundus autofluorescence in retinal dystrophies and functional correlate on micro-
perimetry. Eye (Lond). 23, 567–575 (2009).
8. Oishi, A. et al. Wide-field fundus autofluorescence imaging of retinitis pigmentosa. Ophthalmology 120, 1827–1834 (2013).
9. Lima, L. H. et al. Progressive constriction of the hyperautofluorescent ring in retinitis pigmentosa. Am. J. Ophthalmol. 153, 718–727
(2012).
10. Lima, L. H. et al. Structural assessment of hyper auto fluorescent ring in patients with retinitis pigmentosa. Retina 29, 1025–1031
(2009).
11. Lois, N. et al. Fundus autofluorescence in Stargardt macular dystrophy-fundus flavimaculatus. Am. J. Ophthalmol. 138, 55–63
(2004).
12. Smith, R. T. et al. Lipofuscin and autofluorescence metrics in progressive STGD. Invest. Ophthalmol. Vis. Sci. 50, 3907–3914 (2009).
13. Cukras, C. A. et al. Centrifugal expansion of fundus autofluorescence patterns in Stargardt disease over time. Arch. Ophthalmol.
130, 171–179 (2012).
14. Kellner, S. et al. Lipofuscin- and melanin-related fundus autofluorescence in patients with ABCA4-associated retinal dystrophies.
Am. J. Ophthalmol. 147, 895–902 (2009).
15. von Ruckmann, A., Fitzke, F. W. & Bird, A. C. In vivo fundus autofluorescence in macular dystrophies. Arch. Ophthalmol. 115,
609–615 (1997).
16. Robson, A. G. et al. Functional correlates of fundus autofluorescence abnormalities in patients with RPGR or RIMS1 mutations
causing cone or cone rod dystrophy. Br. J. Ophthalmol. 92, 95–102 (2008).
17. Delori, F. C. et al. In vivo fluorescence of the ocular fundus exhibits retinal pigment epithelium lipofuscin characteristics. Invest.
Ophthalmol. Vis. Sci. 36, 718–729 (1995).
18. Holz, F. G. et al. Evaluation of fundus autofluorescence images. Atlas Fundus Autofluorescence Imaging 20, 71–76 (2007).
19. Schmitz-Valckenberg, S. et al. Fundus autofluorescence imaging: Review and perspectives. Retina 28, 385–409 (2008).
20. Freund, K. B. et al. Increased fundus autofluorescence related to outer retinal disruption. JAMA Ophthalmol. 131, 1645–1649
(2013).
21. Duncker, T. et al. Correlations among near-infrared and short-wavelength autofluorescence and spectral-domain optical coherence
tomography in recessive Stargardt disease. Invest. Ophthalmol. Vis. Sci. 23, 8134–8143 (2014).
22. Hashimoto, Y. et al. A novel method for the objective identification of hyperautofluorescent ring in retinitis pigmentosa using
binarization processing. Transl. Vis. Sci. Technol. 8, 20 (2019).
23. Witmer, M. T. et al. Peripheral autofluorescence findings in age-related macular degeneration. Acta Ophthalmol. 90, 428–433
(2012).
24. Seidensticker, F. et al. Wide-field fundus autofluorescence corresponds to visual fields in chorioretinitis patients. Clin. Ophthalmol.
5, 1667–1671 (2011).
25. Witmer, M. T. et al. Ultra-wide-field autofluorescence imaging in non-traumatic rhegmatogenous retinal detachment. Eye (Lond).
26, 1209–1216 (2012).
26. Anderson, D. R. & Patella, V. M. Automated Static Perimetry 2nd edn. (CV Mosby, Washington, 1999).
27. Kernt, M. et al. Choroidal pigmented lesions imaged by ultra-wide-field scanning laser ophthalmoscopy with two laser wavelengths
(Optomap). Clin. Ophthalmol. 4, 829–836 (2010).
28. Nakagawa, S. & Schielzeth, H. A general and simple method for obtaining R2 from generalized linear mixed-effects models.
Methods Ecol. Evol. 4, 133–142 (2013).
29. Burnham, K. P. & Anderson, D. R. Multimodel inference: Understanding: AIC and BIC in model selection. Sociol. Methods Res.
33, 261–304 (2004).
30. Oishi, M. et al. Wide-field fundus autofluorescence abnormalities and visual function in patients with cone and cone-rod dystro-
phies. Invest. Ophthalmol. Vis. Sci. 55, 3572–3577 (2014).
31. Lima, L. H., Sallum, J. M. & Spaide, R. F. Outer retina analysis by optical coherence tomography in cone-rod dystrophy patients.
Retina 33, 1877–1880 (2013).
32. Lima, L. H. et al. Progressive expansion of the hyperautofluorescent ring in cone-rod dystrophy patients. Ophthalm. Genet. 39,
492–499 (2018).
33. Wang, N. K. et al. Fundus autofluorescence in cone dystrophy. Doc. Ophthalmol. 119, 141–144 (2009).
34. Michaelides, M. et al. Cone-rod dystrophy, intrafamilial variability, and incomplete penetrance associated with the R172W muta-
tion in the peripherin/RDS gene. Ophthalmology 112, 1592–1598 (2005).
35. Tee, J. J. L. et al. Quantitative analysis of hyperautofluorescent rings to characterize the natural history and progression in RPGR-
associated retinopathy. Retina 38, 2401–2414 (2018).
36. Oishi, A. et al. Wide-field fundus autofluorescence imaging in patients with hereditary retinal degeneration: A literature review.
Int. J. Retin. Vitreous 12, 5–23 (2019).
37. Tosi, J. et al. Case report: Autofluorescence imaging and phenotypic variance in a sibling pair with early-onset retinal dystrophy
due to defective CRB1 function. Curr. Eye Res. 34, 395–400 (2009).
Author contributions
S.K., T.I. and R.A. wrote the main manuscript text. T.H., R.F., H.S., K.A. and R.O. reviewed the manuscript.
Competing interests
The authors declare no competing interests.
Additional information
Correspondence and requests for materials should be addressed to T.I.
Reprints and permissions information is available at www.nature.com/reprints.
Publisher’s note Springer Nature remains neutral with regard to jurisdictional claims in published maps and
institutional affiliations.
Scientific Reports | (2021) 11:1911 | https://doi.org/10.1038/s41598-021-81597-7 6
Vol:.(1234567890)www.nature.com/scientificreports/
Open Access This article is licensed under a Creative Commons Attribution 4.0 International
License, which permits use, sharing, adaptation, distribution and reproduction in any medium or
format, as long as you give appropriate credit to the original author(s) and the source, provide a link to the
Creative Commons licence, and indicate if changes were made. The images or other third party material in this
article are included in the article’s Creative Commons licence, unless indicated otherwise in a credit line to the
material. If material is not included in the article’s Creative Commons licence and your intended use is not
permitted by statutory regulation or exceeds the permitted use, you will need to obtain permission directly from
the copyright holder. To view a copy of this licence, visit http://creativecommons.org/licenses/by/4.0/.
© The Author(s) 2021
Scientific Reports | (2021) 11:1911 | https://doi.org/10.1038/s41598-021-81597-7 7
Vol.:(0123456789)You can also read