Correlations between personality traits and roosting behaviours suggest a behavioural syndrome in little brown bats - Brill
←
→
Page content transcription
If your browser does not render page correctly, please read the page content below
Behaviour 157 (2020) 143–183                                   brill.com/beh

   Correlations between personality traits and roosting
   behaviours suggest a behavioural syndrome in little
                      brown bats

                        Quinn M.R. Webber ∗ and Craig K.R. Willis
     Department of Biology and Centre for Forest Interdisciplinary Research (C-FIR),
                           University of Winnipeg, MB, Canada
        * Corresponding author, current address: Cognitive and Behavioural Ecology
Interdisciplinary Program, Memorial University of Newfoundland, St. John’s, NL, Canada,
                        e-mail address: webber.quinn@gmail.com

      Received 14 May 2019; initial decision 11 June 2019; revised 20 November 2019;
               accepted 4 December 2019; published online 30 January 2020

Abstract
Behavioural syndromes are composed of correlated suites of personality traits and can include
traits related to the behaviour and ecology of free-ranging animals. We used captive little brown
bats (Myotis lucifugus) to test the hypothesis that behaviours measured in standardized tests re-
flect personality traits and form behavioural syndromes with roosting behaviours. We predicted:
(1) measured behaviours would be repeatable; (2) personality traits and roosting behaviours would
form behavioural syndromes; and (3) individuals with similar personality scores would associate
more strongly. We observed repeatability for some traits and evidence of behavioural syndromes.
Activity was strongly repeatable across time and contexts. More central individuals roosted in
larger groups, while individuals with high roost-fidelity roosted in larger groups. Individuals with
similar activity scores were also more likely to associate in day roosts, suggesting some behavioural
assortment. Our results have implications for how behavioural variation might influence transmis-
sion of white-nose syndrome.

Keywords
Chiroptera, repeatability, roost fidelity index, roost selection, social assortment, white-nose
syndrome.

© The authors, 2020                                                               DOI 10.1163/1568539X-00003585
This is an open access article distributed under the terms of the CC-BY-NC 4.0 License.

                                                                          Downloaded from Brill.com04/17/2020 07:53:18AM
                                                                                                           via free access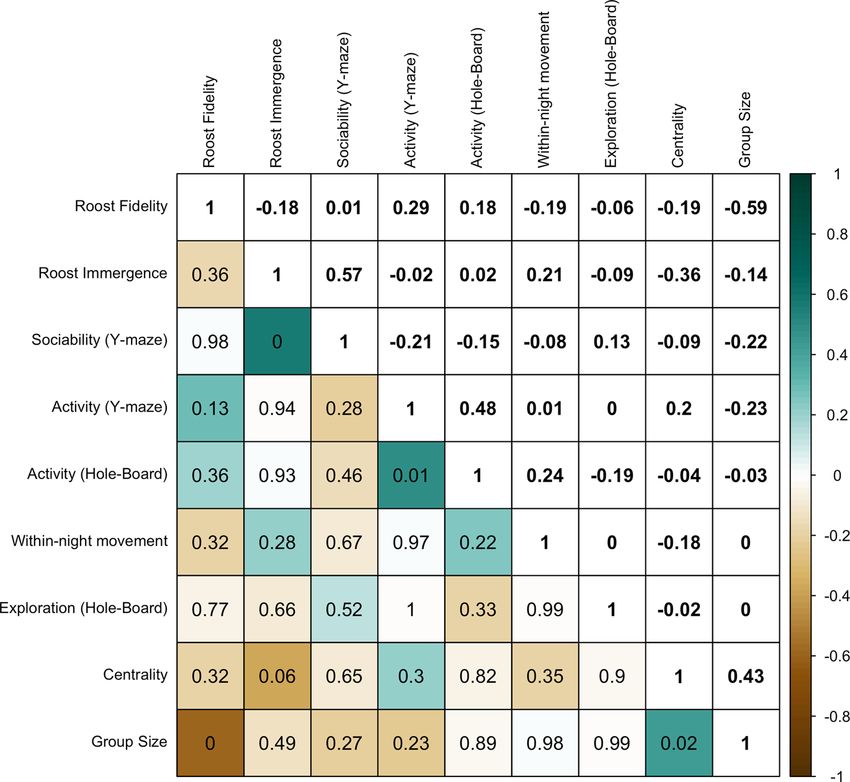
144            Correlations between personality and roosting behaviour

1. Introduction
Animal personality is defined as consistent individual variation in a be-
havioural trait expressed across time and, like other behaviours (e.g., Roberts
& Sherratt, 2002), animal personality traits can affect fitness (Sih et al., 2004;
Réale et al., 2007). Personality traits have been identified for a range of
vertebrates (Bell et al., 2009) and identifying these traits is important for un-
derstanding behavioural evolution (Sih et al., 2012). Some personality traits
are better suited to certain environmental conditions than others and, there-
fore, environmental variation should select for a range of personality traits
within populations (Sih et al., 2012; Nicolaus et al., 2016). For instance, tem-
poral fluctuation in food abundance maintained population-level variation in
personality of red squirrels (Tamiasciurus hudsonicus) because more aggres-
sive females had higher fitness in years with abundant food but lower fitness
in years of food scarcity, presumably because of greater resource acquisition
ability but greater energetic costs (Boon et al., 2007). This kind of fluctuating
selection should promote behavioural diversity within populations which, in
turn, could lead to selection favouring correlated suites of behaviours (Sih
et al., 2012). Such correlations among behavioural traits are known as ‘be-
havioural syndromes’. Behavioural syndromes can include behaviours not
typically associated with animal personality and can have implications for
fitness (Biro & Stamps, 2008; Sih et al., 2012).
    Linking personality with other behaviours, such as sociality, may help
explain the adaptive benefits of personality (Aplin et al., 2013; Korsten et
al., 2013). For example, in sticklebacks (Gasterosteus aculeatus), bold indi-
viduals had many weak social connections while shy individuals had fewer
but stronger social connections (Pike et al., 2008), while in common lizards
(Lacerta vivipara) more social individuals had higher fitness (Cote et al.,
2008). If personality influences associations among conspecifics via social
assortment (i.e., individuals with similar combinations of traits are more
likely to associate: Croft et al., 2009), personality could influence fitness
depending on the behavioural phenotypes of associating individuals (Smith
& Blumstein, 2008). Recent empirical evidence indicates that social be-
haviours are repeatable (Aplin et al., 2015; Vander Wal et al., 2015) and
social behaviour could be related to some personality traits contributing to
behavioural syndromes.
    Temperate-zone bat species could provide a good study system to test
for correlations among personality traits and social behaviour because fe-

                                                          Downloaded from Brill.com04/17/2020 07:53:18AM
                                                                                           via free access
Q.M.R. Webber, C.K.R. Willis / Behaviour 157 (2020) 143–183 145
males of many species form fission-fusion societies that, in summer, are
characterized by frequent roost switching and daily changes in group compo-
sition through merging (i.e., fusion) and splitting (i.e., fission) of sub-groups
(Kerth & Konig, 1999; Willis & Brigham, 2004; Garroway & Broders, 2007;
Patriquin et al., 2010, 2016). In bats, fission-fusion dynamics and social as-
sociation are non-randomly distributed (Silvis et al., 2014; Webber et al.,
2016) and not necessarily mediated by kinship (Metheny et al., 2008; but see
Patriquin et al., 2013) suggesting a possible role for alternative mechanisms,
like animal personality, to influence roosting associations. For instance, as
colonies merge and split, day-roosting group size can vary over time, while
roost fidelity can also vary if individuals prefer or avoid certain roosts. Per-
sonality, or social assortment of individuals with similar combinations of
traits, could influence this variation (Croft et al., 2003). For instance, in gup-
pies (Poecilia reticulata), more social individuals were more likely to shoal
together than with less social individuals (Croft et al., 2005), a finding which
could extend to bat fission-fusion dynamics and help explain why some pairs
of individuals in a given colony tend to roost together more often than oth-
ers (Willis & Brigham, 2004). The time-scale associated with the rate of
fission-fusion for bat maternity colonies (i.e., days to weeks) can influence
a wide range of ecological processes, such as transmission of information
or pathogens and parasites (Reckardt & Kerth, 2007) or access to food and
other resources (Kerth & Reckardt, 2003).
Understanding the roosting and social behaviour of North American bat
species has also become an important priority from a ‘conservation be-
haviour’ perspective (Sutherland, 1998) because of extraordinary population
declines from the invasive fungal disease white-nose syndrome (WNS; Frick
et al., 2010, 2017). Understanding the influence of social assortment on roost
selection decisions of bats could be important for understanding transmission
of the fungal pathogen that causes WNS, identifying critical summer habitats
for protection and enhancement and the potential for evolutionary responses
of bat populations to WNS. For example, individuals with highly sociable or
explorative personality traits, or combinations of traits, may be more likely
to transmit the fungus that causes WNS potentially acting as super-spreaders
(Hoyt et al., 2018). Conversely, individuals with less sociable or exploratory
personalities could be less likely to contract high fungal loads and, if these
personality traits are heritable in bats, WNS could drive directional selection
on personality, given high rates of mortality and strong selection differentials
Downloaded from Brill.com04/17/2020 07:53:18AM
via free access146 Correlations between personality and roosting behaviour
currently at play (Willis, 2015). Preliminary evidence suggests that WNS
survivors may have reduced social aggregation during hibernation (Langwig
et al., 2012) which is thought to reflect within-individual behavioural change
(i.e., sickness behaviour; Brownlee-Bouboulis & Reeder, 2013; Bohn et al.,
2016) but could also reflect increased survival of less sociable individuals
and directional selection on sociality (Willis, 2015). This could have pro-
nounced implications for the habitat requirements of bats. For example, if
WNS drives the evolution of reduced sociability and smaller summer colony
sizes, significantly more high quality roosting habitat may be required if pop-
ulations are ever to recover to pre-WNS numbers of individuals. Quantifying
natural variation in behavioural traits of healthy bats is therefore an impor-
tant conservation priority (Willis, 2015) and generating predictions about
whether individuals with certain combinations of traits may be more likely to
acquire WNS could inform models projecting long-term outcomes of WNS
(e.g., Maslo & Fefferman, 2015).
Long-term recapture rates for free-ranging bats are typically low and,
while repeatability of some social behaviours has been demonstrated over
timescales ranging from a few days to several years (e.g., contact calls of
free-ranging Thyroptera tricolor: Chaverri & Gillam, 2015), to date, repeata-
bility of putative personality traits has only been quantified in bats on a
short-term basis (i.e., 24 h: Menzies et al. 2013). Quantifying behavioural
variation for captive bats held in a semi-natural context could provide an
opportunity to understand links between personality and social or roosting
behaviours which may otherwise be extremely challenging to quantify for
completely free-ranging animals in the wild.
We used captive members of a colony of adult female little brown bats
(Myotis lucifugus), housed in a semi-natural flight enclosure, to test the hy-
pothesis that behavioural traits, measured in standardized hole-board and Y-
maze tests (hole-board: Martin & Réale, 2008; Y-maze: Kilgour et al., 2013;
see methods for descriptions) reflect personality and form behavioural syn-
dromes that mediate roosting and social behaviours. We predicted: (1) that
putative personality traits quantified in standardized tests, and roosting be-
haviours quantified in the flight enclosure, would be repeatable over time and
contexts; (2) that putative personality traits would correlate with each other
as well as with social and roosting behaviours of bats held in the flight en-
closure, thus forming behavioural syndromes; and (3) that individuals with
Downloaded from Brill.com04/17/2020 07:53:18AM
via free accessQ.M.R. Webber, C.K.R. Willis / Behaviour 157 (2020) 143–183 147
similar personality scores for a given trait would have stronger social associ-
ations than individuals with dissimilar personality scores (Croft et al., 2009),
thus displaying social assortment based on personality.
2. Methods
2.1. Study site
Although our study site was negative for Pseudogymnoascus destructans, the
fungal pathogen that causes WNS, we followed U.S. Fish and Wildlife Ser-
vice (USFWS) and Canadian Wildlife Health Cooperative (CWHC) guide-
lines for decontamination by researchers (Canadian Wildlife Health Cooper-
ative, 2015; United States Fish and Wildlife Service, 2016).
We caught little brown bats (Myotis lucifugus) on 5 June 2014 from two
multi-chambered bat boxes that were mounted back-to-back on a post on
private property near Nutimik Lake, Manitoba, Canada (50.14°N, 95.69°W).
Based on exit counts, these boxes housed approximately 250 bats during
spring and early summer. We captured 43 bats at dusk using bucket traps at-
tached to the bottom of each bat box (i.e., a tube with approximately 75 cm
diameter consisting of 50 cm of plastic sheeting attached to an additional
50 cm of mesh screening with a blind bottom). Bats slid or flew down
the plastic sheeting and remained in the blind mesh bottom for approxi-
mately 30 min. Immediately after capture, we identified non-reproductive
adult females by gently palpating the abdomen and we released two de-
tectably pregnant bats immediately upon capture. We implanted a uniquely
coded passive transponder (PIT tag, ID 100-01, Trovan Douglas, UK) sub-
cutaneously between the scapulae for permanent identification for each bat.
PIT tags allowed us to record roost preferences and social contacts with other
bats during captivity and reduced the need to handle individuals. The night
of capture was therefore the first night of captivity (for detailed timeline see
Figure A1 in the Appendix).
2.2. Transport and housing
We retained 40 non-pregnant bats for our behavioural experiments. All bats
were transported from the capture site approximately 80 km to the Sandi-
lands Forest Discovery Centre (49.40°N, 95.54°W). During transport, bats
were suspended in cloth bags in groups of three or four inside a ventilated
picnic cooler to dampen noise during transport. During captivity, bats were
Downloaded from Brill.com04/17/2020 07:53:18AM
via free access148 Correlations between personality and roosting behaviour
housed in a nylon mesh flight tent (2.75 × 2.75 × 2.75 m), previously de-
scribed by Webber & Willis (2018) that had a shaded roof but was otherwise
open to ambient conditions. We allowed bats to acclimate to the flight tent for
the first five days and nights of captivity, a timescale similar to behavioural
studies of other vertebrates (Jacoby et al., 2014; von Merten et al., 2017). An
average of 10% (range 2–20%) of bats per night roosted on the mesh wall
of the tent outside one of the four roost boxes in the flight tent during this
5-day period. However, after the acclimation period only 3% (range 0–15%)
of bats per night roosted outside one of the four roost boxes, and no bats did
this more than once, suggesting that 5 nights was long enough for bats to
discover, investigate and reliably use the roost boxes.
On the second night of captivity we began training bats to eat mealworms
independently. Mealworms were gut-loaded with beta-carotene multivita-
mins (Herptivite, Rep-Cal, Campbell, CA, USA) and nutrient supplement
(Repashy Superfoods, Oceanside, CA, USA). Throughout captivity bats
were provided water and mealworms (larval Tenebrio molitor) ad libitum.
Bats that failed to learn to eat mealworms independently during the next
three nights were released at the capture site (N = 6) leaving 34 individuals
for the main experiment and one individual as the stimulus bat for Y-maze
tests (see below, and Figure A1 in the Appendix). During the third to fifth
nights of the acclimation period, we conducted hole-board tests on 39 indi-
viduals (mean ± SD = 13 ± 3.8/night, range = 10–17/night, Figure A1 in
the Appendix). On the final night of acclimation, we conducted Y-maze tests
on 34 of these individuals (Figure A1 in the Appendix). For the next eight
nights we allowed bats to associate freely in the flight tent while we quanti-
fied social and roosting preferences (see below). Finally, during the last three
nights of captivity we, again, conducted hole-board tests on 17 individuals
per night over two nights and Y-maze tests on 34 individuals on the final
night of the experiment (Figure A1 in the Appendix).
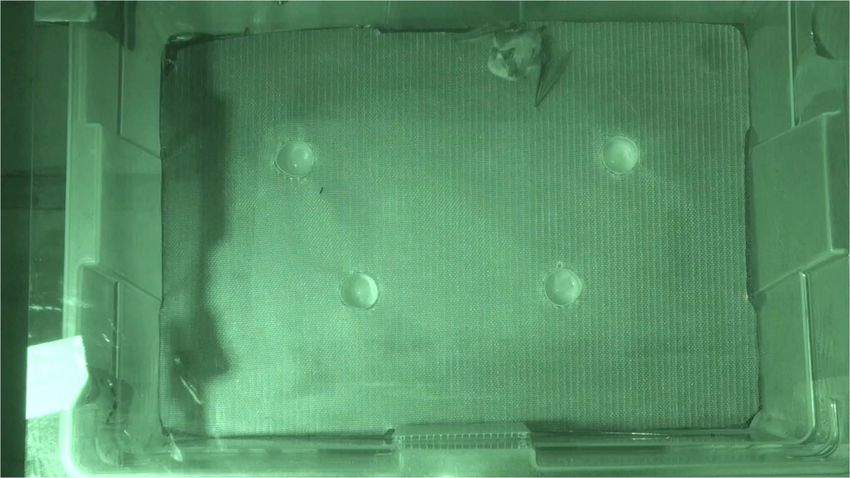
The flight tent was outfitted with four roost boxes constructed from clean-
able ‘vinyl plywood’ each with a volume of 3000 cm3 . Each bat box was
outfitted with a reptile heating mat (160 cm2 , HMA-4, All Living Things™,
Living Things, Orefield, PA, USA), which we used in a concurrent study
(Webber & Willis, 2018) to manipulate roost temperature. In that study, we
found that group size varied as a function of roost temperature and that larger
groups tended to occupy heated roosts. However, all individuals were ex-
posed to the same variation in available roost temperatures and we accounted
Downloaded from Brill.com04/17/2020 07:53:18AM
via free accessQ.M.R. Webber, C.K.R. Willis / Behaviour 157 (2020) 143–183 149
for potential effects of roost temperature on individually-based behaviours in
our analyses (see below).
Each roost box was mounted on a 1.5 m stand and was outfitted with
a rectangular PIT-tag antenna connected to a decoder/data-logger (10 ×
30 cm: LID650N, v727, Dorset Identification, Aalten, The Netherlands).
Each antenna surrounded the roost entrance so that, whenever an individ-
ual entered or exited a roost box, its unique PIT-tag code was recorded and
time-stamped by the data logger. Decoder/data-loggers were powered via an
AC outlet from a nearby building and the system operated continuously for
the duration of the study. This captive experimental set-up was artificial in
the sense that potential for night-time movements of bats was significantly
curtailed relative to normal home-range size for free-ranging little brown
bats. Nevertheless, Webber & Willis (2018) found that bats acclimated to
this roosting system within only a few days after capture from the wild and
exhibited predictable roosting behaviour similar to that of free-ranging bats
(Table 1). We argue that this roosting enclosure study system can provide
a useful perspective on roosting and social behaviours of bats that would
be extremely difficult to collect for entirely free-ranging individuals. The
study system provides a range of roost options, and a range of roosting part-
ners, that would have allowed bats to switch among roosts and roost-mates
normally, reflecting typical patterns of fission-fusion behaviour observed for
free-ranging individuals. Despite the artificial nature of the flight tent, bats
behaved similarly to free-ranging individuals for a range of behaviours (see
Table 1) such as group size (Willis & Brigham, 2007) roost switching fre-
quency (Willis & Brigham, 2004), social network centrality (Silvis et al.,
2014) and within-night movement and activity (Anthony et al., 1981; Bar-
clay, 1982).
2.3. Measuring personality: hole-board test
We quantified activity (i.e., an individual’s general activity patterns) and
exploration (i.e., an individual’s reaction to a novel object or situation) using
a hole-board test (Figure A2 in the Appendix). The hole-board test consisted
of a test arena (57 cm wide by 42 cm tall by 14 cm deep), with a transparent
plexiglass cover, and window screening on the back surface to facilitate
climbing by the bats (Figure A2 in the Appendix). Four-blind holes (2 cm
wide by 1 cm deep) were positioned in the backboard material and vertical
and horizontal lines intersected the hole-board to delineate four sections of
Downloaded from Brill.com04/17/2020 07:53:18AM
via free access150 Correlations between personality and roosting behaviour
Table 1.
Comparison of social and roosting behaviours quantified for a captive colony of Myotis lucifu-
gus with the same, or similar, behaviour quantified for free-ranging bats in North America.
Behaviour Mean (this study) Mean (other studies)
Roost Fidelity 0.62 ± 0.52 (range −0.08 Artibeus watsoni: 0.99 ± 0.82 (range −1
Index to 1.28) to 2): Chaverri et al. (2007)
Within-night 12.3 ± 6.2 roost detections Myotis lucifugus: average 63 min
movement per night (range 1–62) between night-time roost visits: Barclay
(1982)
Myotis lucifugus: extensive return visits
to the roost, especially post-parturition:
Anthony et al. (1981)
Roost Immer- 11 ± 73 min before Myotis velifer: Foraging activity shortly
gence sunrise (range 147 before before sunrise: Kunz (1974)
to 715 after sunrise) Antrozous pallidus: increase in number of
bats returning to the roost within an hour
of sunrise: (Shea & Vaughan, 1977)
Centrality 0.72 ± 0.07 Myotis sodalis: 0.47 (2009), 0.81 (2010):
Silvis et al. (2014)
Group size 11.7 ± 2.6 (range 2–29) Eptesicus fuscus: 19 bats (range ≈ 1–35):
Willis & Brigham (2007)
Myotis lucifugus: median 92 (poplar
roosts), median 16 (aspen roosts): Olson
& Barclay (2013)
Note: the only non-vespertilionid bat species listed here is Artibeus watsoni because there
were no previous studies quantifying roost fidelity index (see methods for calculation) for
free-ranging vespertilionids.
the test arena (Figure A2 in the Appendix). A start chamber (16 cm long
by 8 cm diameter tube) was fastened to the base of the test, with a sliding
door to separate the animal from the main arena. The test apparatus was
hung vertically so bats could crawl on the backboard material and explore
the blind holes.
Hole-board tests were ten minutes long and occurred at night during the
active phase and were video-recorded under infrared illumination (AVCHD
NightShot handycam HDR-XR550, Sony, Tokyo, Japan). At the start of each
trial, a bat was placed in the start chamber and the sliding door was opened.
Each bat was given 60 s to voluntarily enter the test chamber before being
gently pushed in using a plastic plunger. For the 16% (n = 12/73) of bats
that did not enter the test chamber within 60 s, latency to enter was scored
as 60 s, and videos were still recorded for 10 min. For hole-board tests we
Downloaded from Brill.com04/17/2020 07:53:18AM
via free accessQ.M.R. Webber, C.K.R. Willis / Behaviour 157 (2020) 143–183 151
Table 2.
Ethogram of twelve behaviours quantified in video recordings of hole-board and Y-maze tests
conducted on 34 little brown bats.
Behaviour Description Test
Locomotion Total duration of time a bat spent moving; either Hole-board
crawling or climbing. and Y-maze
Echolocation Total duration of time spent stationary, presumably Hole-board
echolocating. and Y-maze
Grooming Total duration of time a bat spent grooming; either Hole-board
chewing or scratching. and Y-maze
Line Crossing Intersecting vertical and horizontal grid lines Hole-board
separate the hole-board test into four quadrants;
number of times a bat crossed a grid line.
Flight attempts Number of flight attempts. Hole-board
Frequency of head Total number of times an individual investigated Hole-board
dips blind holes on the backboard.
Latency to head dip Time from beginning of trial a bat first investigated Hole-board
one of the blind holes on the backboard.
Latency to enter Time from entry into the start chamber a bat entered Hole-board
the test arena.
Line crossing Number of times a bat exited an arm and Y-maze
subsequently entered a different arm of the Y-maze
test.
Relative time spent Total duration of time the focal bat spent inside Y-maze
within 10 cm of 10 cm of the end of the stimulus arm divided by the
the stimulus bat total duration of each test (300 s)
Latency to social Time from beginning of trial until the focal bat first Y-maze
entered within 10 cm of the stimulus bat.
Behaviours reflect personality dimensions quantified in bats by Menzies et al. (2013),
Kilgour et al., (2013) and Webber et al. (2015).
scored duration of locomotion, frequency of flight attempts, frequency of line
crosses, duration of echolocation, duration of grooming, frequency of head
dips, latency to head dip, latency to enter the arena and number of faecal
pellets (for descriptions of all behaviours see Table 2).
Hole-board tests have commonly been used to assay personality traits for
rodents (e.g., Martin & Réale, 2008) and, more recently, bats (Menzies et
al., 2013; Webber et al., 2015). Behavioural responses of bats from the hole-
board test appear to meet the criteria for personality because responses of
individuals are repeatable, at least over the short-term (Menzies et al., 2013).
However, because Menzies et al. (2013) were only able to assess short-term
repeatability of traits assessed in the hole-board test, we measured each
Downloaded from Brill.com04/17/2020 07:53:18AM
via free access152 Correlations between personality and roosting behaviour
personality trait twice, with 11–14 days between measurements to assess
repeatability over a slightly longer term.
2.4. Measuring personality: Y-maze test
We used a Y-maze test, modified from Kilgour et al. (2013), to assess socia-
bility (i.e., an individual’s reaction to the presence or absence of a conspe-
cific). The Y-maze test consisted of a Y-shaped plexiglass maze (long end:
37 cm long; forked ends: 20 cm long; 6 cm wide by 10 cm tall) (see Figure 1
from Kilgour et al., 2013). We randomly selected one bat from the capture
site as the designated ‘stimulus’ bat for all Y-maze trials. We chose to use
the same stimulus bat for all Y-maze trials for two reasons. First, it would
have been impossible to capture enough of this endangered species to hold
a different stimulus individual for each Y-maze test. Second, using the same
stimulus bat for each test controlled for potential differences in the stimu-
lus individual (e.g., acoustic, olfactory or behavioural cues produced by the
stimulus bat) to other individuals from the colony. To account for potential
bias resulting from contact between the focal bat (i.e., the individuals being
tested) and the stimulus bat prior to the trial, we followed standard methods
from social memory studies (Ferguson et al., 2000) and housed the stimulus
bat separately from the main colony during captivity. Focal bats did not in-
teract with the stimulus bat except during Y-maze tests. For the first round
of trials the stimulus bat was at the end of the left arm of the Y-maze and for
the second round it was on the right side. Each trial began when we placed
the focal bat at the long end of the Y-maze and the trial concluded after 5
min. The stimulus bat was held in a small stainless-steel mesh cage (20 ×
20 × 20 cm) located at the end of one of the arms of the Y, while an identical
empty cage was placed at the end of the other arm. The stimulus bat was
held in this cage for up to 4 h before being returned to its housing enclosure.
For Y-maze tests we scored duration of locomotion, duration of grooming,
number of faecal pellets, duration of echolocation, time spent within 10 cm
of the stimulus bat divided by total trial time, and latency to approach within
10 cm of stimulus bat (see Table 2 for descriptions of all behaviours). To
date repeatability of behavioural traits measured in the Y-maze test has not
been assessed for bats. Y-maze tests were five minutes long and, as for hole-
board, occurred at night and were video-recorded under infrared illumination
(AVCHD NightShot handycam HDR-XR550, Sony).
After completion of hole-board and Y-maze tests we returned bats to
the flight tent and cleaned the testing apparatus with unscented disinfecting
Downloaded from Brill.com04/17/2020 07:53:18AM
via free accessQ.M.R. Webber, C.K.R. Willis / Behaviour 157 (2020) 143–183 153
wipes (Lysol, Reckitt Benckiser, Mississauga, ON, Canada) to comply with
North American decontamination guidelines for P. destructans (Canadian
Wildlife Health Cooperative, 2015; United States Fish and Wildlife Service,
2016) and to prevent residual scent from influencing the behaviour of subse-
quent bats. To improve efficiency, we used two identical test chambers (both
hole-board and Y-maze tests) so that one could be used while the other was
being cleaned. The order that individuals were tested in the hole-board and
Y-maze tests were randomized within nights, therefore altering the order an
individual was tested from the first to second trial to ensure behavioural re-
sponses we observed were not a function of the time of day. We accounted for
the time of each trial in our repeatability analyses (see below). Videos were
scored by QMRW for a range of behavioural traits that have been used to
quantify personality in rodents (e.g., Martin & Réale, 2008) and bats (Men-
zies et al., 2013; Webber et al., 2015) and QMRW was blind to the identity
of bats in the videos while scoring.
2.5. Quantifying personalit y
All statistical analyses were conducted using R (R Core Team, 2019). We
used principal component analysis (PCA) to reduce the large number of
behavioural variables into a smaller number of components reflective of
personality traits. Prior to conducting PCA, we confirmed that correlations
existed among behavioural variables using Bartlett’s test and confirmed sam-
pling adequacy using the Kaiser–Meyer–Olkin (KMO) test (see Tables A1–
S4 in the Appendix for results, Budaev, 2010). Budaev (2010) highlighted
that including multiple measures from the same individuals in a single PCA
represents pseudo-replication, so we conducted four separate PCAs, one for
each behavioural test (hole-board or Y-maze) and trial (one or two). We
scaled and centred raw data by subtracting variable mean values from each
individual value and dividing by the variable standard deviation using the
‘prcomp’ function in R. This generates a dataset with mean values of zero,
which ensures that the first component describes the most variance. We re-
tained components based on the Kaiser-Guttman criterion (eigenvalues > 1,
Kaiser, 1991) and the parallel analysis method (Morton & Altschul, 2019).
Given recent criticism of the Kaiser criterion (Morton & Altschul, 2019),
in cases where the Kaiser criterion and parallel analysis disagreed, we vi-
sually inspected PCA results using a scree plot and chose the number of
components based on the most conservative result. For the hole-board PCAs
Downloaded from Brill.com04/17/2020 07:53:18AM
via free access154 Correlations between personality and roosting behaviour
we condensed behavioural variables to determine activity and exploration
scores for each individual (Menzies et al., 2013). For the Y-maze PCAs we
condensed behavioural variables to quantify sociability (Kilgour et al., 2013)
and activity for each individual. PC scores were then used to assess repeata-
bility within tests (see below).
2.6. Measuring roosting behaviours
We quantified five roosting behaviours of individuals in the flight tent based
on detection of PIT-tagged bats entering or exiting roost boxes. We se-
lected behaviours that could be readily quantified using the PIT-tag systems
and which we assumed would likely contribute to fission-fusion dynamics
for free-ranging bats: day-roosting group size, day-roost fidelity (hereafter,
roost fidelity), within-night movement/activity, roost-immergence timing,
and communal night-roosting behaviour (measured as social network cen-
trality, which we define as an individual’s connectivity to the rest of the
network with each individual’s centrality value proportional to the sum of
centralities of connected individuals as well as all of that individual’s con-
nections; see below).
Day-roosting group size can vary from day-to-day for bats living in fission
fusion societies and variation in group size can influence social thermoreg-
ulation (Willis & Brigham, 2007; Kuepper et al., 2016). For individuals
roosting in larger groups, predicted energy expenditure is significantly lower
than for bats roosting alone or in small groups (Willis & Brigham, 2007).
We quantified day-roosting group size for each individual on each day by
summing the total number of unique bats it roosted with each day.
Roost-switching is an important aspect of fission-fusion behaviour in bats
and frequent roost switching results in lower roost fidelity (Chaverri et al.,
2007). Understanding correlates of roost fidelity is important because roost-
switching is thought to help reduce parasite loads inside roosts (Reckardt &
Kerth, 2006; Webber et al., 2016) and prevent roost detection by predators
(Fenton et al., 1994). We quantified a roost fidelity index (RFI) that has been
used to quantify patterns of movement by bats in the wild (e.g., Chaverri &
Kunz, 2006; Chaverri et al., 2007). Throughout captivity we assigned each
bat to one of three roosting categories on each day depending on whether it
stayed in the same roost box as the previous day (STAY), moved to a roost
box it had not previously occupied (MOVE), or returned to a roost it had
used previously but not on the preceding night (RETURN; Chaverri & Kunz,
Downloaded from Brill.com04/17/2020 07:53:18AM
via free accessQ.M.R. Webber, C.K.R. Willis / Behaviour 157 (2020) 143–183 155
2006). Occasionally bats left a roost box on a given night and then hung on
the mesh lining of the flight tent the following day although no individuals
did this for more than one day. We scored these events as MOVE because
the bat did not remain in the same roost box (Chaverri & Kunz, 2006). We
quantified the RFI for each individual as:
2(STAY) + (RETURN) − (MOVE)
RFI = (1)
STAY + RETURN + MOVE
RFI can range from −1 (complete infidelity), if the bat switched roosts
every day, to 2 (complete fidelity), if the bat never moved (Chaverri & Kunz,
2006). For our closed system, RFI could over-estimate roost fidelity because
bats only had four options for roosting sites, limiting the chance they might
show complete infidelity (i.e., RFI = −1). While the minimum score in a
system with an infinite number of roosts is −1, our study was limited to four
roosts and the mesh lining of the tent (which no bat used more than once),
so the minimum possible RFI value was approximately zero. However, little
brown bats in the wild switch roosts approximately every two days (Olson &
Barclay, 2013). The duration of our experiment (i.e., eight days), combined
with the number of roost boxes we used, allowed bats to switch roosts at a
normal frequency of approximately every two days.
General activity and movement patterns of free-ranging bats at night could
influence foraging success as well as predation, with more active individuals
facing higher risk of predation (Rydell et al., 1996). We quantified overall ac-
tivity as the total number of times each individual was detected entering any
roost box each night. We summed this total number of detections and used
this variable as an index of movement patterns during the night (hereafter,
within-night movement).
Emergence timing at dusk can also influence foraging success for insectiv-
orous bats (Rydell et al., 1996), but less is known about immergence timing
in the morning. Variation in immergence timing, especially for individuals
that immerge during the dawn twilight or after sunrise, could reflect varia-
tion in foraging success and/or energetic status, while also influencing risk
of predation by crepuscular or diurnal birds. We quantified timing of roost
immergence based on the last detection of each individual each morning. We
then calculated the difference between immergence time and sunrise time to
assess each individual’s propensity to remain active in the morning. Sunrise
occurred between 04:19 and 04:20 during the captivity period.
Downloaded from Brill.com04/17/2020 07:53:18AM
via free access156 Correlations between personality and roosting behaviour
2.7. Social network analysis
Night-roosting behaviour is common in wild bats and females at mater-
nity colonies often night roost at sites other than the day roost (Anthony et
al., 1981). Communal night-roosting is particularly important for reproduc-
tive females to decrease energetic costs of thermoregulation (Barclay, 1982;
Kuepper et al., 2016). We generated social networks based on night-roosting
associations of bats (assessed using PIT-tag detections), where nodes were
represented by individuals and edges were represented by co-occurrence be-
tween individuals in the same roost at the same time. Throughout the night
bats foraged at the food and water dishes, flew around the flight tent, and
entered roost boxes for variable periods of time. We constructed social net-
works each night based on samples of all associations that occurred during
the first 5 min of each hour between midnight and sunrise. We sampled for
5 min/h to capture persistent associations between pairs of individuals while
also allowing for reorganization of individuals between sampling periods to
increase the independence of samples between observations (Jacoby et al.,
2014). We used the simple ratio index (SRI: Cairns & Schwager, 1987) to
quantify pairwise associations calculated as:
X
SRI = , (2)
X + Yab + Ya + Yb
where X is the number of times a pair of individuals (a and b) were observed
in the same roosting group at the same time, Y a is the number of times
a was observed in a roost but b was not observed in any roost, Y b is the
number of times b was observed in a roost, but a was not observed, and Yab
is the number of times both individuals were observed but in different roosts
(Whitehead, 2008). Networks were constructed using the SRI in the asnipe
package (Farine, 2013) in R. The SRI scales from 0 to 1 with a value of
1 indicating a dyad was always observed together and 0 indicating a dyad
was never observed together. We used the SRI to construct eight, undirected,
weighted social networks for bats on each night of the experiment.
After generating a network based on the SRI, we quantified ‘eigenvector
centrality’ (hereafter, centrality), which refers to an individual’s social con-
nectivity and each individual’s centrality value is proportional to the sum of
the centralities of connected individuals as well as all of that individual’s
connections (Csárdi & Nepusz, 2006). Thus, individuals with high centrality
are connected to many individuals that are, in turn, connected to many other
Downloaded from Brill.com04/17/2020 07:53:18AM
via free accessQ.M.R. Webber, C.K.R. Willis / Behaviour 157 (2020) 143–183 157
individuals. Social centrality reflects connectivity among individuals and has
been linked to social rank-order (Sueur et al., 2011), transmission of infor-
mation about food patches (Aplin et al., 2012) and fitness (Vander Wal et al.,
2015).
2.8. Statistical analyses
To estimate repeatability of personality traits and roosting behaviours (i.e.,
day-roosting group size, roost immergence, within-night movement, roost
fidelity and centrality) over time, we used the Bayesian modeling package
‘MCMCglmm’ in R (Hadfield, 2010). Bayesian analysis requires the specifi-
cation of prior distributions for unknown parameters (Wilson et al., 2010), so
we coded variance (s 2 ) in our priors as s 2 /2 and degree of belief (nu) as one.
All models were fit with Gaussian error structure and we assessed normal-
ity prior to analyses. We assessed autocorrelation for Markov Chain Monte
Carlo (MCMC) chains using the ‘autocorr’ function to ensure autocorrela-
tion was 0.4 as strong. We fit nine repeata-
bility models, one for each personality trait and each roosting behaviour,
except roost fidelity because Equation (1) provides a single value for each
individual throughout captivity as opposed to daily values. For models of
personality traits measured using the hole-board, we included trial (1 or 2),
time of trial, and number of days between the first and second trial (range
11–14 days) as fixed effects. For models using the Y-maze test, we included
trial (1 or 2) and time of trial as fixed effects. For roosting behaviour models,
we included sampling night (1–8) and daily roost box identification as fixed
Downloaded from Brill.com04/17/2020 07:53:18AM
via free access158 Correlations between personality and roosting behaviour
effects. In addition, we also included a single model that assessed repeata-
bility of activity across tests. For this model, we included time of trial, trial
(1 or 2) in an interaction with test (hole-board or Y-maze) as fixed effects.
For all models, we included individual identity as a random factor. We ex-
tracted individual best linear unbiased predictors (BLUPs) for each model
and considered BLUPs as reflective of personality scores for all subsequent
analyses.
2.9. Quantifying behavioural syndromes
We tested for behavioural syndromes by constructing a correlation matrix
among the BLUPs we extracted for all personality traits and roosting be-
haviours. We used Spearman’s rank correlation coefficient for matrices to
assess the direction and magnitude of correlations between variables. We ac-
counted for multiple comparisons using Holm’s correction. All results are
presented as the mean ± standard deviation.
Due to the inherent non-independence of social networks, we generated
1000 random social networks and calculated eigenvector centrality for each
network. To test whether correlations that included eigenvector centrality
were non-random, we re-generated corrected correlation matrices for all
pairwise correlations and extracted correlation coefficients between eigen-
vector centrality and each of the other eight behaviours in our analysis.
We considered observed correlation coefficients non-random if the observed
coefficient fell outside the 95% confidence interval of the random distribu-
tion (Figure A3 in the Appendix). These comparisons allowed us to assess
whether correlations between eigenvector centrality and other behaviours
represented biologically meaningful relationships or, alternatively, whether
they were the outcome of random combinations of individual connections.
2.10. Quantifying behavioural assortment
To assess whether individuals with similar personality scores had stronger
social associations we used multiple regression quadratic assignment pro-
cedures (MRQAP, Dekker et al., 2007) in asnipe (Farine, 2013). MRQAPs
are similar to Mantel tests, but allow permutation of regression coefficients
in a matrix format (Dekker, Krackhardt & Snijders, 2007) with a single de-
pendent matrix being regressed against one or more independent matrices
(Farine & Whitehead, 2015). We ran 10 000 iterations of our MRQAP. Us-
ing the procedure described above (see ‘social network analysis’ section)
Downloaded from Brill.com04/17/2020 07:53:18AM
via free accessQ.M.R. Webber, C.K.R. Willis / Behaviour 157 (2020) 143–183 159
we generated a single social association matrix using the SRI for all bats
throughout captivity as the dependent matrix. We calculated similarity matri-
ces for personality traits using BLUPs as reflective personality scores, where
a dyad with a shared score of 0 had identical personality scores and shared
scores > 0 indicate differences in personality with a larger number indicating
a greater difference in individual personality scores for a dyad. To reduce the
number of independent matrices in our model we a priori selected activity
from the hole-board test, exploration, and sociability as candidate person-
ality matrices and ran a single MRQAP model testing the effects of these
personality matrices as predictors of social association.
3. Results
3.1. Personality traits
Based on parallel analysis, we retained the first two principal components
for the first trial of hole-board tests and the first three principal components
of the second trial of hole-board tests. The first two components explained
57.4% of the variance in results for the first test (Table A1 in the Appendix)
and the first three components explained 71.3% of the variance for the second
test (Table A2 in the Appendix). The first component (PC1H ) for both PCAs
was associated with activity-based behaviours such as locomotion, so we in-
terpreted PC1H as an index of activity. The second component (PC2H ) for
the first hole-board PCA was associated with exploration-based behaviours
such as number of head dips so we interpreted PC2H1 as an index of explo-
ration. For the second hole-board PCA, the third component was associated
with exploration-based behaviours, so we interpreted PC3H2 as an index of
exploration.
Based on agreement between parallel analysis and the Kaiser criterion,
we retained the first two components for the Y-maze PCAs. These explained
77.9% of the variance in results for the first Y-maze test (Table A3 in the
Appendix) and 71.7% of the variance for the second test (Table A4 in the
Appendix). As for the hole-board test, the first component of both PCAs
(PC1Y ) was associated with activity-based behaviours such as locomotion so
we interpreted PC1Y as an index of activity. The second component (PC2Y )
for both PCAs was associated with sociability-based behaviours such as
duration spent within 10 cm of the stimulus bat (divided by trial duration),
so we interpreted PC2Y as an index of sociability.
Downloaded from Brill.com04/17/2020 07:53:18AM
via free access160 Correlations between personality and roosting behaviour
3.2. Roosting and social behaviours
Mean day roosting group size during captivity was 11.7 ± 2.6 (range: 2–29)
bats per roost and roost immergence time was 11 ± 73 min from sunrise
(range: 147 min before to 715 min after sunrise). On average, individual bats
were detected 12.3 ± 6.2 (range 1–62) times per night for the night roosting
social network analysis. Despite the relatively small number of available
roosts, individuals switched roosts every 1.6 ± 0.4 days and showed low
roost fidelity (RFI = 0.62 ± 0.52, range −0.08 to 1.28). Mean night-roosting
social network centrality was 0.72 ± 0.07.
3.3. Repeatability and behavioural syndromes
All personality traits (i.e., activity hole-board: r = 0.17; exploration: r =
0.27; activity Y-maze: r = 0.41; sociability: r = 0.13) were weakly to highly
repeatable over the 11–14 days between trial 1 and trial 2 (Figure 1; Table A5
in the Appendix). Activity was also highly repeatable across contexts from
the hole-board to the Y-maze test (r = 0.29, Table A5 in the Appendix) and
correlated (r 2 = 0.48, p = 0.01; Figure 2). In terms of roosting behaviours
in the flight tent, within-night movement was highly repeatable (r = 0.45),
roost immergence timing was moderately repeatable (r = 0.23), and night
roosting centrality (r = 0.11) and day roosting group size (r = 0.17) were
weakly repeatable from day to day (Figure 1; Table A6 in the Appendix).
We observed variation in the strength of correlations among personal-
ity traits, and between personality traits and roosting behaviours, consis-
tent with the existence of one or more behavioural syndromes (Figure 3).
After accounting for multiple comparisons, the overall correlation matrix
was not significant (F = 1.23, P = 0.20). Specifically, significant pairwise
correlations within this matrix included correlations among social traits,
where bats that roosted in larger groups during the day also had more so-
cial contacts at night (r 2 = 0.43, p = 0.02; Figure 4a, and Figure A3 in
the Appendix), a negative correlation between day roosting group size and
root fidelity (r 2 = −0.59, p < 0.01; Figure 4b, and Figure A3 in the Ap-
pendix), and a positive correlation between sociability (PC2Y ) and roost
immergence (r 2 = 0.57, p < 0.01; Figure 4c). In addition, there were some
correlations between activity-based traits and social traits, including a near
significant negative correlation between night-roosting social centrality and
roost immergence (r 2 = −0.36, p = 0.06; Figure 4d, and Figure A3 in the
Appendix).
Downloaded from Brill.com04/17/2020 07:53:18AM
via free accessQ.M.R. Webber, C.K.R. Willis / Behaviour 157 (2020) 143–183 161
Figure 1. Repeatability estimates and 95% credible intervals for four personality traits
(N = 34 bats) and four roosting behaviours (N = 28) for little brown bats (Myotis lucifu-
gus). See Table A2 in the Appendix for details.
3.4. Behavioural assortment
We observed a positive correlation between activity matrices and social asso-
ciation (r = 0.08, p = 0.005) where individuals with similar activity scores
were more likely to associate in their day roosts than individuals with dis-
similar activity scores (Table 3). In contrast, we observed no relationship
between sociability or exploration matrices and social association (Table 3).
4. Discussion
We found some moderate to strong correlations between clusters of traits
measured in the hole-board and Y-maze tests, as well as social behaviours
Downloaded from Brill.com04/17/2020 07:53:18AM
via free access162 Correlations between personality and roosting behaviour
Figure 2. Positive correlation between activity measured in the hole-board (PC1H ) and activ-
ity measured in the Y-maze (PC1Y ) (r 2 = 0.48, p = 0.01).
relevant to the roosting ecology of bats measured in a semi-natural enclo-
sure. This finding suggests the existence of a behavioural syndrome, mostly
associated with social traits, in little brown bats. We found evidence for
repeatable personality traits in bats, with most traits showing moderate re-
peatability (i.e., r = 0.20 to 0.40) after 11–14 days, including repeatability
of activity across contexts (from the hole-board to the Y-maze test). We
also observed some evidence of social assortment with bats associating most
strongly with other individuals exhibiting similar activity scores. Our results
are consistent with previous work suggesting the existence of personality in
bats (Menzies et al., 2013; Webber et al., 2015) and, although we concede
that our roosting environment was artificial, our results suggest that personal-
ity traits in bats may also be related to roosting behaviours, social structure,
and fission-fusion dynamics with implications for the roosting ecology of
free-ranging bats.
Animal personality traits are thought to be maintained because of tempo-
ral and spatial variation in selection, but selection will only affect population
evolution if phenotypic variation is heritable (Dingemanse et al., 2002; Nico-
laus et al., 2016). Although heritability of personality traits in bats has never
been studied, a recent meta-analysis of personality traits across vertebrates
quantified a heritability to repeatability ratio of 0.52. This suggests that about
52% of population-level variation in personality (range 33–70%) can be
attributed to additive genetic variation and that it is appropriate to infer evo-
lutionary potential of personality based on repeatability (Dochtermann et al.,
Downloaded from Brill.com04/17/2020 07:53:18AM
via free accessQ.M.R. Webber, C.K.R. Willis / Behaviour 157 (2020) 143–183 163
Figure 3. Correlation matrix of four personality traits (N = 34) and five roosting behaviours
(N = 28) for a captive colony of little brown bats corrected for multiple comparisons. Be-
haviours are ordered based on hierarchical clustering analysis, where sociability (PC2Y ),
day-roosting group size, and centrality formed a distinct cluster and roost immergence, activ-
ity (PC1H and PC1Y ), exploration (PC2H ), within-night movement, and roost fidelity formed
another distinct cluster. Numbers on the upper diagonal show Pearson’s correlation coeffi-
cient (r) for pair-wise comparisons; numbers on the lower diagonal show adjusted p-values
for pair-wise comparisons; and shading vertical colour gradient represents the strength of r
ranging from −1 to 1. Note boxes on the lower diagonal with ‘0’ reflect p < 0.01.
2015; but for an opposing example see Bierbach et al., 2017). If personality
is heritable in little brown bats, ecological processes (e.g., predation or food
availability) could impose directional selection against a given personality
trait, or suite of traits. In Siberian chipmunks (Tamias sibiricus), boldness
was selected for in years of low acorn availability, but selected against in
years of high food availability, suggesting that bold individuals are more
Downloaded from Brill.com04/17/2020 07:53:18AM
via free access164 Correlations between personality and roosting behaviour
Figure 4. Visual depiction of correlations between selected personality traits and roosting
behaviours for a captive colony of little brown bats. (A) Positive correlation between night-
roosting eigenvector centrality and day-roosting group size (r 2 = 0.43, p = 0.02); (B) Neg-
ative correlation between roost fidelity and day-roosting group size (r 2 = −0.59, p < 0.01);
(C) Positive correlation between sociability (PC2Y ) and roost immergence (r 2 = 0.57,
p < 0.01); (D) Negative, near-significant, correlation between night-roosting eigenvector
centrality and roost immergence (r 2 = −0.36, p = 0.06). Note: see Figure 2 for Spearman
correlation coefficients and associated p-values for all pairwise correlations.
efficient foragers, which the authors suggest translates into higher reproduc-
tive success (Le Coeur et al., 2015). More work is needed to determine the
heritability of personality in bats but our results, which build on those of
Menzies et al. (2013), demonstrating repeatability suggest potential for her-
itability and evolution of personality in bats. By contrast, traits with low
Downloaded from Brill.com04/17/2020 07:53:18AM
via free accessQ.M.R. Webber, C.K.R. Willis / Behaviour 157 (2020) 143–183 165 Table 3. Matrix regression between activity (PC1H ), exploration (PC2H1 and PC3H2 ), and sociability (PC2Y ) and social association (calculated using the simple ratio index, see Methods) for 34 little brown bats (Myotis lucifugus). Covariate Coefficient p Intercept 0.33
166            Correlations between personality and roosting behaviour

immergence (p < 0.01, Figure 4c). These findings suggest individuals that
typically roosted in smaller groups had higher day-roost fidelity than indi-
viduals that roosted in larger groups and that more sociable individuals tend
to enter the roost later each morning than less sociable individuals. No data
exist linking roost fidelity to group size in bats (although roost fidelity in
Artibeus watsoni varied by sex and roost availability suggesting differences
in roost-switching behaviour between males and females; Chaverri et al.,
2007). Less social individuals may not have strong social preferences for
conspecifics and, therefore, may re-use the same roosts or select roosts based
on thermal properties (Webber & Willis, 2018), regardless of the presence of
other individuals.
    We also found some evidence of social assortment based on personal-
ity traits but, in contrast to our prediction, individuals with similar activity
scores had stronger social associations. Based on the concept of social niche
specialization (Montiglio et al., 2013) we expected that relatively active in-
dividuals would tend to roost most often with inactive conspecifics. Similar
to our results, in guppies (Poecilia reticulata), individuals tended to asso-
ciate with other individuals having similar patterns of predator vigilance be-
haviour, which has an activity component (Croft et al., 2009). This tendency
could also help explain the pattern we observed. An alternative explanation
could be that individual bats assorted based on patterns of activity because
individuals with similar personality traits select roosts for the day at approx-
imately the same time or have similar preferences for specific roosts or roost
characteristics. This is consistent with the trend we observed suggesting that
bats with high activity scores also showed high roost fidelity (Figure 3). Al-
ternatively, it is possible that the overall colony size in our experiment was
too small to reveal social niche specialization and studies with larger colonies
of free-ranging bats may be needed.
    One potential limitation of our study is that all behaviours measured were
quantified in either completely artificial (i.e., hole-board and Y-maze) or
semi-artificial environments (i.e., flight tent). Measuring behaviour in an ar-
tificial environment in which movement or activity patterns of individuals
are constrained could be problematic. For instance, we likely only detected
a small portion of the overall range in activity or movement patterns ex-
hibited by little brown bats. Although studying behavioural syndromes in
free-ranging animals is ideal, logistical constraints can prevent collection of
detailed behavioural data. Thus, using captive populations in a semi-natural

                                                          Downloaded from Brill.com04/17/2020 07:53:18AM
                                                                                           via free access
Q.M.R. Webber, C.K.R. Willis / Behaviour 157 (2020) 143–183 167
setting provides a good alternative for taxa in which free-ranging populations
are cryptic and/or difficult to track and recapture. In the case of our study, al-
though we concede that our flight enclosure was an artificial environment,
roosting and social behaviours we observed were similar to those observed
for free-ranging bats in the wild (Table 1). For example, bats switched roosts
at nearly the same frequency (every 1.6 days, see results) as typical free-
ranging bats (e.g., every 1.7 days; Willis & Brigham, 2004). In addition, even
though maximum group size was constrained in our study, average group
sizes were similar to those observed for free-ranging bats of the same and
similar species (Willis & Brigham, 2007; Olson & Barclay, 2013). Finally,
although we used different metrics, we found similar levels of within-night
movement and activity as reported in past studies of free-ranging little brown
bats (Anthony et al., 1981; Barclay, 1982). In addition, natural variation in re-
source distribution, such as foraging opportunities or roost availability, could
influence some of the behaviours we measured. We there cautiously interpret
our findings and encourage future studies to examine the role of animal per-
sonality on the same behaviours for free-ranging bats.
Another potential limitation of our study is the use of a single individual
bat as the stimulus for all Y-maze tests. The primary reason we chose to use
a single individual was logistical; it would have been difficult, if not impos-
sible, for us to house many additional bats separate from the main colony to
use as stimulus bats in the Y-maze test. There are, however, potential conse-
quences of only using a single stimulus bat. The behaviour of the stimulus
individual may have influenced focal bats in different ways. While there is
no way to test for this without the use of different stimulus bats, we recom-
mend future studies address this concern by conducting trials using different
stimulus bats, perhaps using a non-endangered species for which more in-
dividuals can be captured and potentially housed. Although use of a single
stimulus bat may have led to variation in responses of some focal individu-
als, in many ways use of a single individual is preferable because it should
control for variation in traits of the stimulus bat that might be important to
focal individuals. Thus, we argue that using a single stimulus bat was a rea-
sonable way to quantify the sociability axis of personality for this study in
the face of the logistic constraints of working with an endangered species.
Our flight tent system allowed us to obtain the first evidence of be-
havioural syndromes for any of the more than 1400 species of bats but also
Downloaded from Brill.com04/17/2020 07:53:18AM
via free accessYou can also read