COVID Model Projections - BC COVID-19 Modelling Group January 19, 2022 @bcCOVID19group
←
→
Page content transcription
If your browser does not render page correctly, please read the page content below
January 19 2022
                                     BC COVID-19 Modelling Group

COVID Model Projections
            January 19, 2022

    BC COVID-19 Modelling Group

                               @bcCOVID19group
January 19 2022
                                                                    BC COVID-19 Modelling Group

About BC COVID-19 Modelling Group
                                                  Contributors to report
                                                  Sarah Otto (UBC, co-editor)
                                                  Eric Cytrynbaum (UBC, co-editor)
                                                  Dean Karlen (UVic and TRIUMF)
                                                  Jens von Bergmann (MountainMath)
                                                  Caroline Colijn (SFU)
                                                  Rob James (evidently.ca)
                                                  Ailene MacPherson (SFU)
                                                  James Colliander (UBC and PIMS)
                                                  Daniel McDonald (UBC)
                                                  Paul Tupper (SFU)
                                                  Daniel Coombs (UBC)
                                                  Elisha Are (SFU)
                     https://bccovid-19group.ca   Bryn Wiley (UBC)

        Independent and freely offered advice,
       using a diversity of modelling approaches.                                           2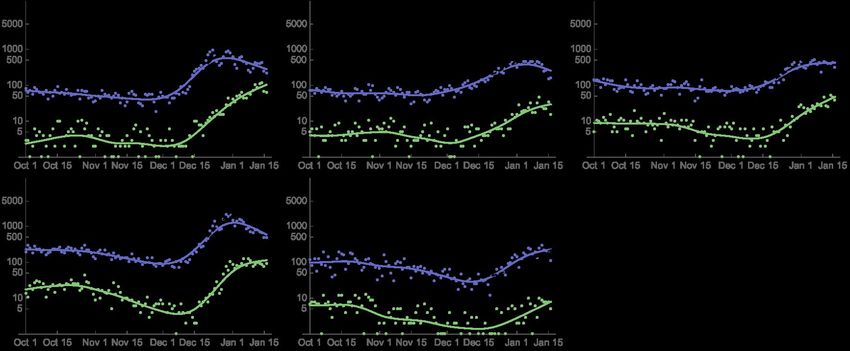
January 19 2022
                                                                               BC COVID-19 Modelling Group

Overview
Omicron is causing rapid growth in health care demands in BC
●   General BC case data are no longer useful to track the growth, due to testing capacity
    limits and changes in testing policy for BC.
●   Case data for those over 70 and hospital data suggest the growth rate declined from
    about 20% per day to about 10% per day.
●   In the absence of reliable case data, hospital admissions can provide a good measure to
    track the pandemic and its impact, as it has less lag than hospital occupancy data.
    Currently, hospital admission data is updated at irregular intervals.
     ○   Access to accurate, timely, and consistent daily hospital admission data would allow
         for better projections of health care demands. We ask BC to make such data public.
●   With the reduced growth rate, the projected peak in hospital demands is lower and
    delayed until February, if we continue with current restrictions.
●   BC projected hospital demands similar to those experienced recently in US.
                                                                                                       3
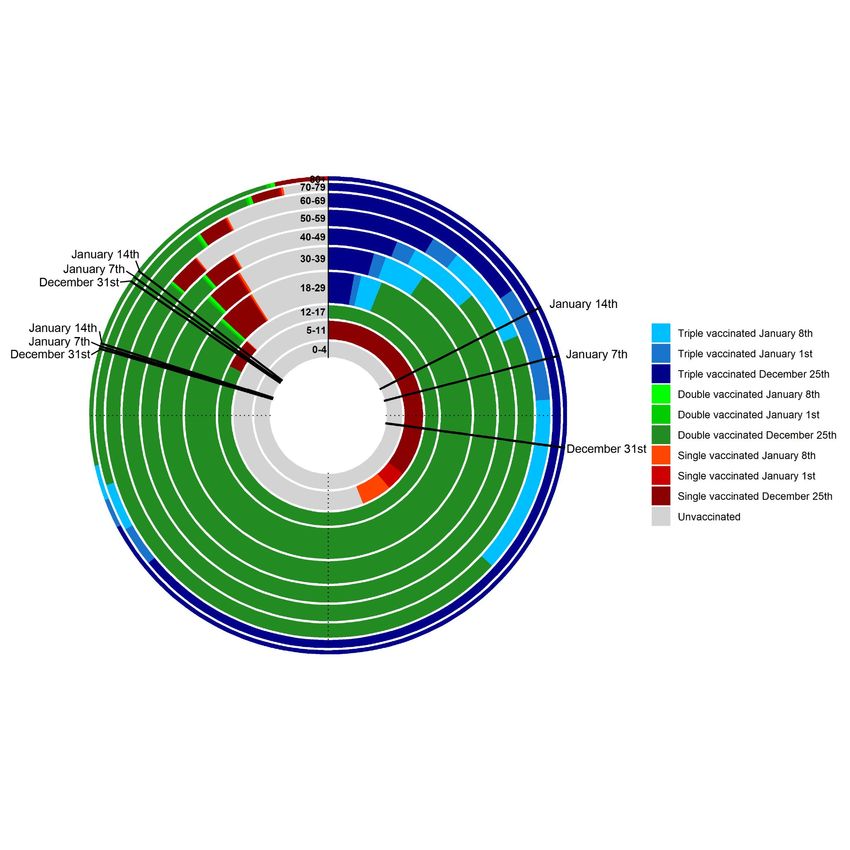
January 19 2022

Age-corrected case counts: British Columbia                                                                                     BC COVID-19 Modelling Group

As testing reached its limits, people                                                                                                  Corrected total
under 65 without health issues were
discouraged from testing in BC.                                                                                                        70 has remained the same as
its Dec 21 value (see Appendix).
→ Using this age correction, the estimated number of cases that would have been detected on
January 16 is ~12000 had testing limits not been exceeded, compared to the 1509** reported.
Source (S. Otto; BC COVID-19 Modelling Group) *New cases per day in 10-year age groups were downloaded from the BCCDC COVID-19 data portal.
Cubic spline fits to log-case data were obtained (curve) and estimates for those

January 19 2022

 Age-corrected case counts: Health Authority                                                                                                       BC COVID-19 Modelling Group

                                                                                                                                                             Corrected total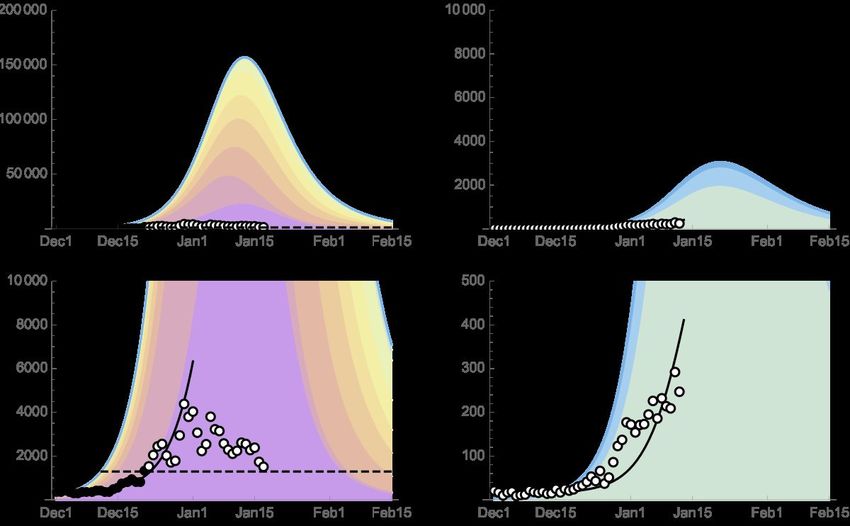
January 19 2022
                                                                                 BC COVID-19 Modelling Group

     January 6 projection for BC (with updated data)

     → Daily hospital admissions have grown more slowly than projected. This suggests that the
     Omicron transmission rate declined sometime in December.

Source (D. Karlen). See www.pypm.ca. The larger dots show weekly averages.                               6
January 19 2022
                                                                                                              BC COVID-19 Modelling Group

     Updated projection for BC

          ● Dashed vertical line shows the date where a transition to a lower Omicron transmission rate is included to
            match daily hospital admission data. → Reduced growth rate from about 20%/day to about 10%/day.
          ● Duration of hospital stays for Omicron admissions increased (in accord with our study of US states)
                   ○    ICU rates and duration for Omicron infections not well estimated: large uncertainty
          ● Hospital data back in agreement with projection

Source (D. Karlen). See www.pypm.ca. The larger dots show weekly averages.                                                            7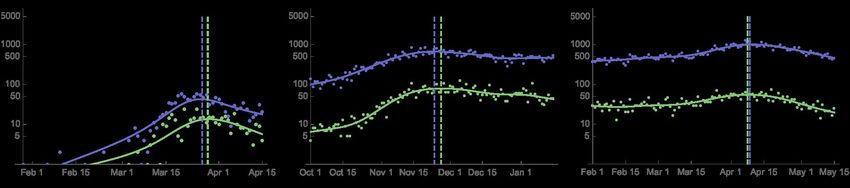
January 19 2022
                                                                                                            BC COVID-19 Modelling Group
 Significant drop in Omicron infection rate? No.

            ● Transition to much lower Omicron transmission rate in December in order to match all case data.
            ● This possibility is ruled out by hospital admission and hospital census data.

     → Using case data (without accounting for testing limits) would imply a significant drop in
     infection rates, but this does not match hospitalization data.
Source (D. Karlen). See www.pypm.ca. The larger dots show weekly averages.                                                          8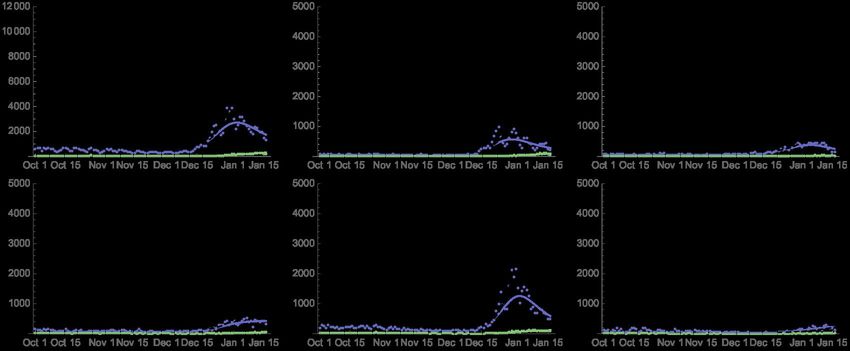
January 19 2022
                                                                                                            BC COVID-19 Modelling Group

     Longer term projection

            ● With reduced transmission rate, peak in demand for daily COVID hospital admissions is delayed until
              mid-February and lowered to about 500.
                      ○   Note: hospital capacity limits not included in projections
                      ○   Note: ICU occupancy projections have large uncertainty
            ● Definition of “COVID hospital admission” recently changed - cannot compare going forward?

Source (D. Karlen). See www.pypm.ca. The larger dots show weekly averages.                                                          9
January 19 2022
                                                                                                          BC COVID-19 Modelling Group

Comparing longer term BC projection with US
                                                                   ● In our study of US states, models are
                                                                     independently fit for each state to data on
                                                                     ○    Omicron and Delta strains
                                                                     ○    Case and hospitalization data

                                                                   ● Daily hospital admissions due to Omicron
                                                                     infections are estimated from model fits
                                                                     and shown in figure as proportion of
                                                                     population
                                                                     ○    States grouped by region

                                                                   ● Data are aligned on the day that the state
                                                                     first exceeded two Omicron admissions per
                                                                     100,000 inhabitants (day 0)
                                                                     ○     Curves end on current date

                                                                   ● BC projection is overlaid in black for
                                                                     comparison
                                                                     ○   Solid curve ends on current date
                                                                     ○   Dashed curve shows projection

Days after exceeding two Omicron hospital admissions per 100,000        Source (D. Karlen). See www.pypm.ca.                    10
January 19 2022
BC COVID-19 Modelling Group
Comparing longer term BC projection with US
● The BC projection,
assuming the current
growth rate is
maintained, is similar
to that experienced by
many US states.
● Relaxing measures in
BC will cause peak
hospital demand to
increase.
Days after exceeding two Omicron hospital admissions per 100,000 11January 19 2022
Age-based model projections with Omicron BC COVID-19 Modelling Group
The following slides show model projections for the daily number of
cases and number in hospital due to Omicron, using BC data for
vaccination status and hospitalization rates by age. Updates:
● Vaccines: Vaccine status of BC population updated to that on January 14, 2022
(allowing time for their immunity to build), including % of boosters by age.
● Severity: Risk of hospitalization per case is lower for Omicron (estimated as
76% as severe among unvaccinated by Ferguson et al. and 33% as severe by SEAPIR Model (Day et al. 2020)
UK Technical Briefing). A range is explored.
Remaining parameters as in previous report: 10 age classes
● VEinfection: Vaccine Effectiveness against infection set to 10% for unboosted {0-9,10-19,...80-89,90+}
individuals and 75% for boosted individuals (UK Technical Briefing 33).
● Psevere (Hazard Ratio): Omicron is 34% as severe among vaccinated relative to 2 immune classes
unvaccinated infected individuals (Ferguson et al.) ● Vaccinated (or recovered)
The growth rate of Omicron was set to 20% per day, matching case ● Susceptible
numbers in December. Length of stay in hospital was halved to 6 days
for Omicron. Slides assume ~1/4 of all infections in BC were detected
(Hamadeh et al.) before testing limits were reached.
Source (S. Otto). Modified from model analyses reported by CoVaRR-Net Pillar 6, modified to focus on predictions for the population of BC and adjusting the initial number of
cases to account for an observed incidence of ~1000 Omicron cases on December 21, alongside 300 cases and 192 hospitalizations for Delta (not modeled explicitly).
Data from Ferguson et al. use their corrected numbers (Psevere =26/76, assuming two doses of Pfizer vs unvaccinated, Table 3).January 19 2022
Projected Omicron infections by age FEW INFECTIONS DETECTED (25%) BC COVID-19 Modelling Group
Only infections with moderate symptoms
Omicron infections
(coloured by age) 70+ individuals only
Cases in 70+ should be less
Zooming
affected by testing limits.
in
Circles show slower growth in
All infections this age group than predicted.
(detected & undetected) Possible explanations:
(1) Older individuals have
restricted contacts more
and/or (2) Omicron growth
slowed following restrictions in
late December.
These alternatives are
Max cases explored in following slides.
detected in previous Cases detected (black)
waves in BC
Detected cases were used to fit model through December 21 (solid circles); empty circles not used for fitting.January 19 2022
Projected Omicron infections by age FEW INFECTIONS DETECTED (25%) BC COVID-19 Modelling Group
(1) Reducing contacts in 70+ Only infections with moderate symptoms
Omicron infections
(coloured by age) 70+ individuals only
Zooming Reducing contacts in 70+
in Here, older individuals have
restricted contacts 3-times
more than younger age
cohorts across this period.
Fit doesn’t capture shape of
slowing growth trajectory.
Max cases
detected in previous Cases detected (black)
waves in BC
Detected cases were used to fit model through December 21 (solid circles); empty circles not used for fitting.January 19 2022
Projected Omicron infections by age FEW INFECTIONS DETECTED (25%) BC COVID-19 Modelling Group
(2) Reducing growth rate of Omicron Only infections with moderate symptoms
Omicron infections
(coloured by age) 70+ individuals only
Zooming
in
Reducing growth rate
Here, growth of Omicron
reduced for everyone from
20% to 12% per day on
December 24.
Max cases
detected in previous Cases detected (black)
waves in BC
Detected cases were used to fit model through December 21 (solid circles); empty circles not used for fitting.January 19 2022
Projected hospitalizations under two scenarios (REVISED) BC COVID-19 Modelling Group
Scenario 2: Reduced growth of Omicron
Scenario 1: Reduced contacts in 70+
Fits the severity data from the UK and predicts a
Fits the hospitalization data only if Omicron
later and shallower peak hospital demand IF
severity is reduced relative to UK
lower Omicron growth rate is maintained
→ Worse fit to 70+ and hospitalization data → Better fit to 70+ and hospitalization data
Omicron
severity
Severity: Varied from 0.1 (light green) to 0.9 (light black) for the risk of hospitalization per case for Omicron relative to
previous variants for unvaccinated individuals. Estimated of 76% from Ferguson et al. is thicker black curve; estimate of
33% from UK Technical Briefing is thicker green curve.January 19 2022
Vaccination status by age BC COVID-19 Modelling Group
January 14th update includes data through January 8th Booster Progress
The fraction of BC’s
entire population with
three doses increased
The fraction of BC’s 6.2% over the past week
entire population with
one or two doses
increased 0.5% and
0.2% respectively over
the past week
Source (B. Wiley). Design by Blake Shaffer (https://blakeshaffer.shinyapps.io/app_vaccines/) BC Vaccination data for first and second doses from
https://health-infobase.canada.ca/covid-19/vaccination-coverage/, with area of each circle segment proportional to BC’s population in that age class. Data for third doses
from http://www.bccdc.ca/health-info/diseases-conditions/covid-19/data. BC 2022 Population projections for vaccination percentages from BC Stats: 17
https://www2.gov.bc.ca/gov/content/data/statistics/people-population-community/population/population-projectionsJanuary 19 2022
BC COVID-19 Modelling Group
Changing immunity with Omicron
The risk of COVID-19 for an unvaccinated person relative to a fully vaccinated person has declined rapidly with the spread of
Omicron in BC. Being unvaccinated increased the relative risk of infection by an average of 8.8-fold before Omicron, but this has
declined to only 1.5-fold with Omicron (left). The risk of hospitalization has fallen less, from 21.1-fold before Omicron to 9.9 (right).
[Relative risks are for an average person (age corrected) and do not reflect patterns in specific ages or given specific types and dates of vaccination.]
Source (S. Otto) Risks for an unvaccinated person relative to a fully vaccinated person (age corrected) were obtained from the daily BC Gov News reports. Because risk of
infection is calculated across the past week, we use data from only one day per week (Wednesday) and fit a (1–pt) + b pt, where pt is the frequency of Omicron (inferred by
D. Karlen in Dec 22 report, slide 7). Risk of hospitalization is calculated over the past two weeks of data, so we fit to a model of Omicron frequency seven days ago 18
a (1–pt-7) + b pt-7 to account for the lag in hospitalizations, using data from every other week (analysing solid and hollow points separately) and averaging the results.January 19 2022
Key messages BC COVID-19 Modelling Group
State of the Omicron wave in BC:
● Cases in individuals >70 in age are continuing to rise across the province. This is important because hospital
demand depends disproportionately on cases in this age class.
● The drop in total cases is restricted to thoseJanuary 19 2022
Appendix: Age-corrected case counts BC COVID-19 Modelling Group
Same data and projections for total case numbers as in main slides but on a linear scale (y-axis)
Corrected totalJanuary 19 2022 Appendix: Age-corrected case counts BC COVID-19 Modelling Group As a check, we compare the peaks of previous waves for people 70+ (green dashed) and for people
January 19 2022

Age-corrected case counts: Ontario                                                                                               BC COVID-19 Modelling Group

                                                                                                                                        Corrected total
   Similar patterns are found in
   other provinces, such as Ontario,
You can also read