COVID Model Projections - BC COVID-19 Modelling Group January 6, 2022 @bcCOVID19group
←
→
Page content transcription
If your browser does not render page correctly, please read the page content below
January 6, 2022
                                     BC COVID-19 Modelling Group

COVID Model Projections
             January 6, 2022

    BC COVID-19 Modelling Group

                               @bcCOVID19group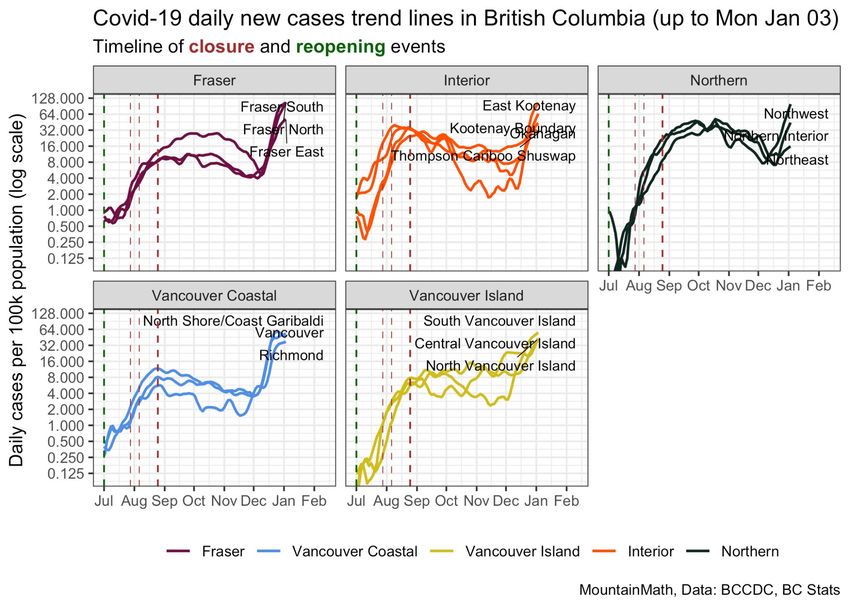
January 6, 2022
                                                                    BC COVID-19 Modelling Group

About BC COVID-19 Modelling Group
                                                  Contributors to report
                                                  Sarah Otto (UBC, co-editor)
                                                  Eric Cytrynbaum (UBC, co-editor)
                                                  Dean Karlen (UVic and TRIUMF)
                                                  Jens von Bergmann (MountainMath)
                                                  Caroline Colijn (SFU)
                                                  Rob James (evidently.ca)
                                                  Ailene MacPherson (SFU)
                                                  James Colliander (UBC and PIMS)
                                                  Daniel McDonald (UBC)
                                                  Paul Tupper (SFU)
                                                  Daniel Coombs (UBC)
                                                  Elisha Are (SFU)
                     https://bccovid-19group.ca   Bryn Wiley (UBC)

        Independent and freely offered advice,
       using a diversity of modelling approaches.                                           2
January 6, 2022
                                                                                 BC COVID-19 Modelling Group

Overview
Omicron is now established and spreading within BC
●   Case rates have risen rapidly to the highest levels seen during the pandemic, with
    spiking case numbers in every health authority.
●   Models estimate that prior to Christmas, Omicron cases in BC were growing 21-26% per
    day, doubling every 3.0-3.6 days. With testing limitations, current growth rate is unknown.
●   Testing capacity limits have now been breached in BC, with the province prioritizing use
    of PCR tests for those “people 65 years and older, as well as those with underlying
    medical conditions”. While rapid antigen testing expands capacity, results are not
    available publicly. We call on BC to share this information.
●   Models continue to predict that demand on hospitals will be extreme in January, reaching
    much higher levels than witnessed to date, even if Omicron is less severe.
●   Rapid spread means we have little time to act, but we can protect ourselves and slow the
    spread of Omicron in BC as we did with previous variants: getting vaccinated, wearing
    tight fitting masks, improving ventilation, avoiding large indoor gatherings, and
    improving rapid testing and isolation
                                                                                                         3
January 6, 2022
                                                                                                                         BC COVID-19 Modelling Group
Omicron: Updates from around the world
Highlighting large studies and studies most relevant to BC                                   Cases
                                                                                             Hospital admissions
                                                                                             Deaths
Severity:
● South Africa summary found that hospitalization rates dropped
  from 16.6% of cases in previous two waves to 4.9% for Omicron;
  patients admitted with Omicron were 73% less likely to have
  severe disease1 and were released in half the time (median of 4
  days vs 7-8 days), reflected a combination of higher immunity in
  the population and/or lower severity of Omicron (Jassat et al.).
                                                                                                                                           Jassat et al.
● UK study controlled for immunity (vaccination or prior exposure), finding 35% fewer admissions to hospital
  per Omicron case than Delta case (Ferguson et al.). Vaccinated cases (Pfizer two-dose) were much less
  likely to visit hospital (74% less for Omicron vs Delta), while unvaccinated cases were only slightly less likely
  (24% less).

● Ontario study found 54% lower risk of hospitalization for Omicron versus Delta cases [95% CI:23-73%]),
  matched by age and onset date and adjusting for vaccine status (Ulloa et al.).
→ Omicron cases less often require hospitalization, especially for vaccinated individuals, and
more often result in shorter and less intensive care in hospital.
                                                                                                                                                     4
                                                    1
                                                        Including cases needing supplemental oxygen or ICU care, exhibiting respiratory distress, or dying.
January 6, 2022
                                                                                                      BC COVID-19 Modelling Group
Omicron: Updates from around the world
Highlighting large studies and studies most relevant to BC
                                                                   Pfizer two-dose regime (UK Technical Briefing)
Vaccine Effectiveness:
● UK study found vaccine protection against
  infection with Omicron plummets to near zero by
  15 weeks but is regained to high levels within a
  week following boosting (UK Technical Briefing).
                                                                                        Boosters significantly
→ Higher antibody levels are needed to                       Vaccines drop rapidly in   restore effectiveness
prevent infection with Omicron, because of                      protection against          with Omicron
its many genetic differences.                                infection with Omicron

Transmissibility:
● Danish study found Omicron to be only slightly more transmissible among unvaccinated households (1.17x
  relative to Delta [95% CI:0.99-1.38]) and attributed Omicron’s rapid spread primarily to its ability to infect
  vaccinated individuals (Lyngse et al.).
● Tissue-based study found that Omicron replicated 70x faster in bronchial tubes and 10x slower in lung tissue
→ Omicron may replicate less well in lungs and more in airways, potentially accounting for lower
severity and slightly higher transmissibility.
                                                                                                                              5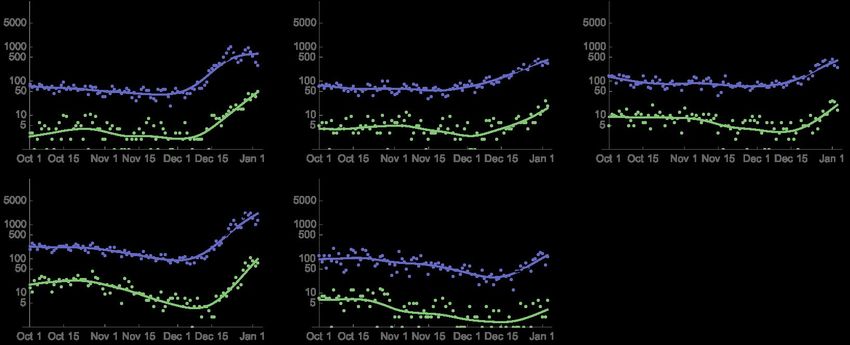
January 6, 2022

State of the COVID-19 Pandemic in BC                                                                                                               BC COVID-19 Modelling Group

                                                                                                             After the long decline in cases seen since
                                                                                                           September, the establishment of Omicron has
                                                                                                           lead to a dramatic rise in cases, reaching the
                                                                                                                    highest levels yet seen in BC.

                                                                                                           As testing is hitting capacity limits and people
                                                                                                            are diverted to self-report rapid test results,
                                                                                                           the PCR test results are understating current
                                                                                                                              case growth.

Source (J. von Bergmann) Case data from BC COVID-19 Database (http://www.bccdc.ca/health-info/diseases-conditions/covid-19/data). Vertical lines give dates of public
health measures (major as thick lines, minor as thin lines). Grey dots are raw case counts, grey lines is cases abused for weekly pattern, black STL trend line and blue fitted
periods of constant exponential growth. *Central Okanagan – July 29: masks, August 6: restrictions on group gatherings; Interior – August 21: masks; August 23: some            6
restrictions on group gatherings. BC – August 25 mask mandate; BC’s Vaccine Card to come into effect on September 13 (first dose) and October 24 (second dose)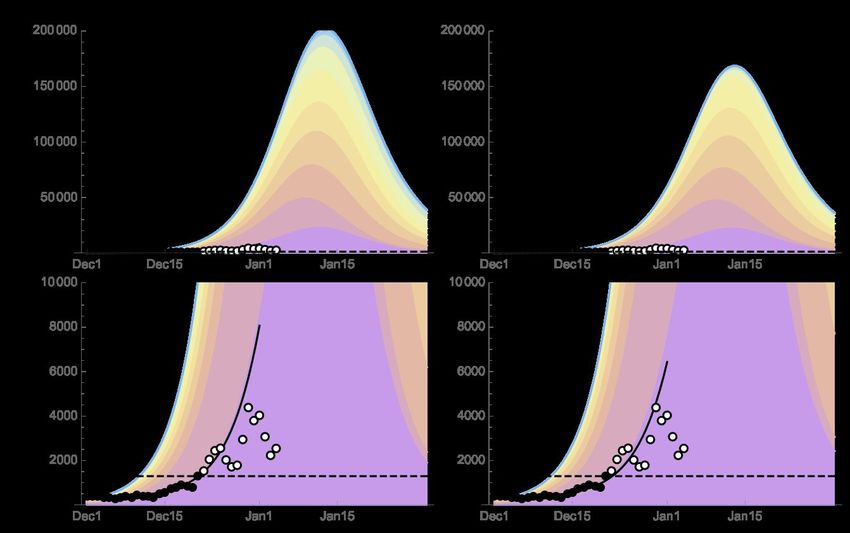
January 6, 2022
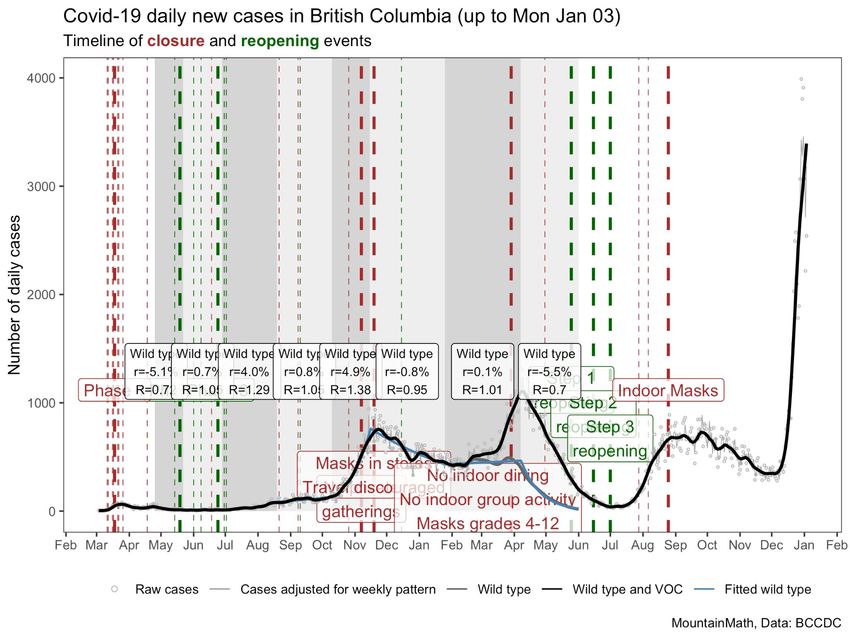
COVID-19 in BC Health Regions BC COVID-19 Modelling Group
We now see steep increases in all
heath regions, indicating that
Omicron has become established
everywhere throughout BC.
With cases so high that testing
limits have been reached in BC,
these graphs don’t show the full
picture of recent case growth.
7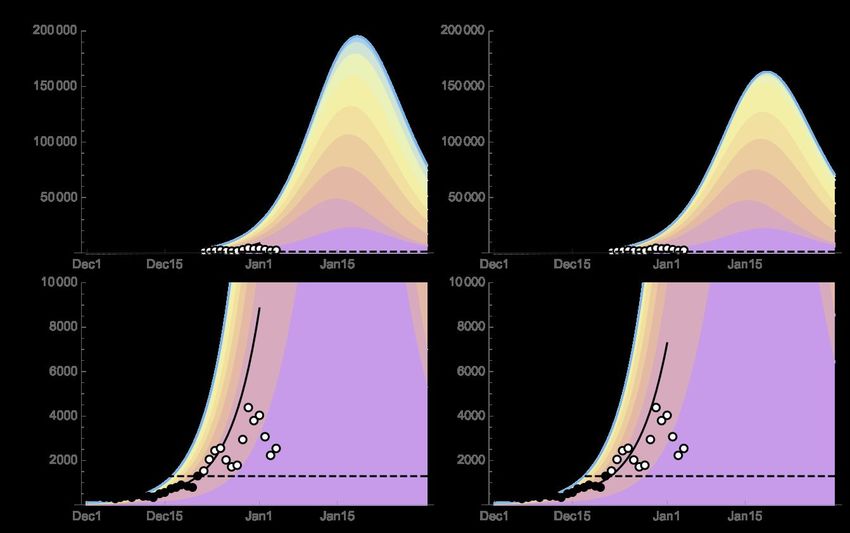
January 6, 2022

Data Gaps   There are significant data gaps that make it difficult
                                                                              BC COVID-19 Modelling Group

              to assess the current status of Omicron in BC.

                                               ●   As expected, testing capacity is unable to keep
                                                   up with the growth of Omicron, leading to an
                                                   unknown level of underreporting.
                                               ●   People are being diverted away from PCR
                                                   toward rapid antigen testing (RATs). While RATs
                                                   increase capacity, the results are not publicly
                                                   shared in BC, worsening the data gap.
                                               ●   Wastewater surveillance data is in principle a
                                                   good tool to estimate underreporting, but the
                                                   Metro Vancouver wastewater surveillance data
                                                   has not been updated since Dec 20.

                                                       Had a positive rapid antigen test?
                                                    Report results here and call on BC to share:
                                                       https://reportcovidresults.bccdc.ca/

             → COVID-19 infection rates are now highly uncertain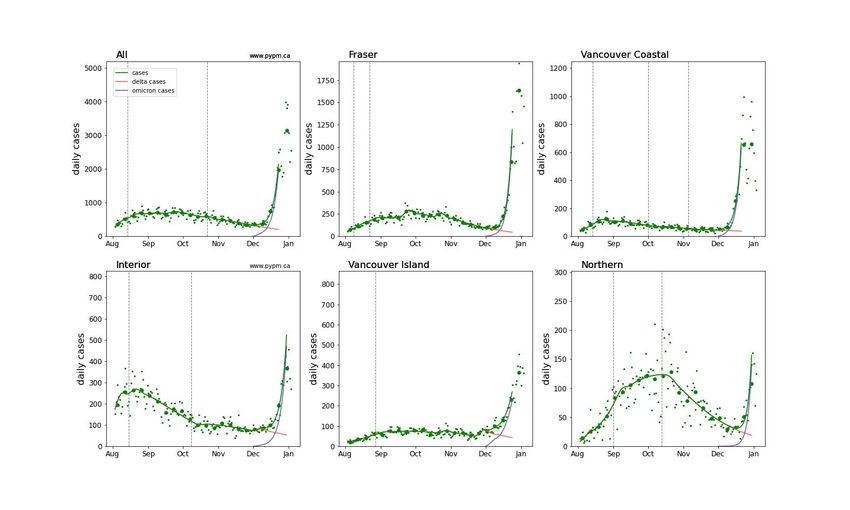
January 6, 2022
                                                                                                                                BC COVID-19 Modelling Group
      Testing rates in BC by Health Authority
                                                                                                                    A consistent testing policy (starting
                                                        Fraser and Coastal had additional testing during 4th wave
                                                                                                                    Jan 2021) yielded a simple relation
                                                                                                                    between number of tests and
                                                                                                                    number of cases each week:

                                                                                                                    tests = a ⨉ cases + b ⨉ population

                                                                                                                    Category A tests: COVID-related
                                                                                                                    (infections and contacts).
                                                                                                                    Cases lead to additional tests being
                                                                                                                    performed (a > 1)

                                                                                                                    Category B tests: background
                                                                                                                    (unrelated to a COVID infection)
                                                                                                                    b: fraction of the population per
                                                                                                                    week who get a test for reasons
                                                                                                                    unrelated to an actual COVID
                                                                                                                    infection

                                                                                                                    The blue curves show the relations
                                                                                                                    using a and b estimated from the 3rd
                                                                                                                    wave (shaded in pink).

                     → Current testing rates fall below expectation, given case numbers.                                                                    9
Source (D. Karlen). Case and testing data from the BCCDC public data dashboard. See the October 7, 2021 report.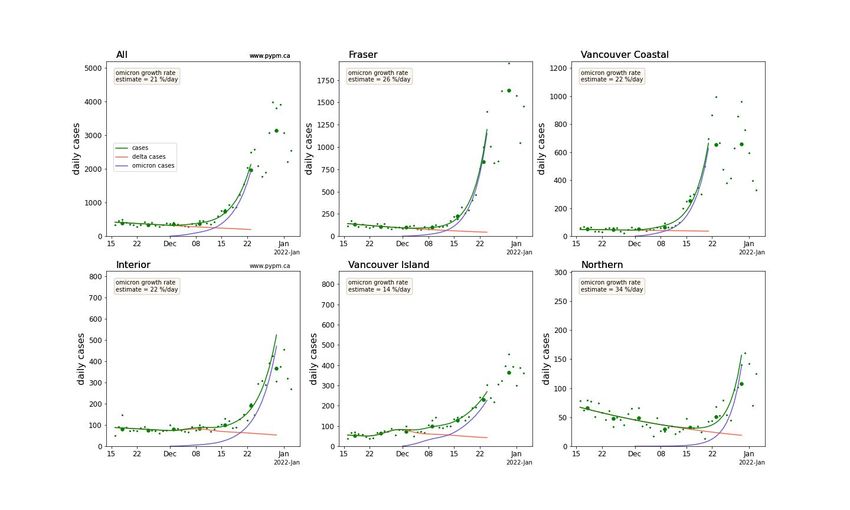
January 6, 2022

How large is this data gap?                                                      BC COVID-19 Modelling Group
January 6, 2022

Data Gaps                                                                                                                        BC COVID-19 Modelling Group

                                 There are significant data gaps that make it difficult
                                   to assess the current status of Omicron in BC.

 → These data gaps matter!
 The lack of accurate estimates of Omicron infections means:
  ● Individuals cannot assess the risks they face (see table)
  ● The effect of recent public health measures cannot be determined
  ● Projections of the height and timing of peak cases and hospital demand become more
      uncertain, making it hard to develop the right contingency plans

                                         Chance of at least            Chance of at least one         Chance that at least 2
                                         one infected person in        infected person in a           employees are sick out of 10
          Active cases                   a group of 10                 group of 50                    workers

          0.5% of people in BC                      5%                            22%                               0.1%
          (reported number*)

          5% of people in BC                        40%                           92%                               8.6%
          (10x higher**)
*27,106 active cases in BC reported on January 4, 2022; **Potential level of underreporting because of testing limits, asymptomatic & mild infections, etc.
January 6, 2022
BC COVID-19 Modelling Group
Omicron model fits to BC data
Maximum in each panel
corresponds to 1 case per day
per 1000 people in the region.
Model fits use case data
until the date where it
becomes apparent that
holiday or testing
policy/capacity cause a
unusual drop in cases.
All HA clearly show growth in
cases arising from Omicron
Source (D. Karlen). See www.pypm.ca. These models include vaccination but have no age structure. Vertical lines show fitted dates for transmission rate changes. The 12
larger dots show weekly averages.January 6, 2022
BC COVID-19 Modelling Group
Omicron model fits to BC data (zoomed in)
Maximum in each panel
corresponds to 1 case per day
per 2000 people in the region.
Reliable Omicron
growth rates estimates
are 21 - 26% per day.
(doubling times:
3.0 - 3.6 days)
Source (D. Karlen). See www.pypm.ca. These models include vaccination but have no age structure. The larger dots show weekly averages. 13January 6, 2022
BC COVID-19 Modelling Group
Longer term projections for BC
The following slides show 6-week projections for a set of nominal assumptions and for adjustments to
those assumptions, to indicate sensitivity to the assumptions:
Model Parameter Nominal Altered
transmission rate constant 50% reduction in December or January
2-dose vaccine effectiveness 20% 50%
against Omicron
fraction of Omicron infections same as earlier variants 0.3 times the reporting fraction for earlier
reported variants
fraction of Omicron infections 0.3 times the 0.1 or 0.5 times the hospitalization
requiring hospitalization hospitalization fraction of fraction of earlier variants
earlier variants
● Projections show infections instead of cases, since the reporting fraction is unknown and likely to change
in the future, due to capacity limitations.
● Projections do not include hospitalization capacity limits or changes to admission policies.
● Heterogeneity (not present in these homogeneous models) may result in earlier onset of herd immunity. 14January 6, 2022
BC COVID-19 Modelling Group
Reduction in transmission rate (December 21)
● Solid yellow curve: Omicron daily infections that led to the observed cases (after a delay). With a constant
transmission rate, infections begin to decline in mid-January due to the herd effect.
● Dashed yellow curve: Had transmission reduced on December 21, reducing growth rate from 20% to 10%
per day, infection and hospitalization peaks reduced by about 50%, but capacity limits are still exceeded.
→ Peak hospital demand would be lower and later, but peak remains very high.
15
Source (D. Karlen). See www.pypm.ca. These models include vaccination (including boosters) but have no age structure.January 6, 2022
BC COVID-19 Modelling Group
Reduction in transmission rate (January 5)
● Dashed yellow curve: The same reduction in transmission rate, but on January 5, has a smaller effect.
→ Peak hospital demand would be lowered by 30%, but peak remains very high.
16
Source (D. Karlen). See www.pypm.ca. These models include vaccination (including boosters) but have no age structure.January 6, 2022
BC COVID-19 Modelling Group
Reduction in transmission rate (January 20)
● Dashed yellow curve: The same reduction in transmission rate, but delayed until January 20, midway through
the rise in hospital demand. The reduced transmission rate comes too late to have any substantial effect.
→ Transition would be too late to affect peak hospital demand
17
Source (D. Karlen). See www.pypm.ca. These models include vaccination (including boosters) but have no age structure.January 6, 2022
BC COVID-19 Modelling Group
Increased vaccine effectiveness against omicron
● Solid yellow curve: The effectiveness of 2-dose vaccination against Omicron is assumed to be 20%.
● Dashed yellow curve: The effectiveness is adjusted to be 50% and the transmission rate is adjusted to fit
case data. Since a larger fraction of the population is immunized against Omicron, herd immunity is
reached earlier and peak hospital demands are reduced, but still exceed capacity.
→ Peak hospital demand would be lowered by 30%, but peak remains very high.
18
Source (D. Karlen). See www.pypm.ca. These models include vaccination (including boosters) but have no age structure.January 6, 2022
BC COVID-19 Modelling Group
Reduced fraction of Omicron infections reported
● Solid yellow curve: The fraction of Omicron infections reported is the same as for other variants.
● Dashed yellow curve: The fraction of Omicron infections reported is 0.3 times the reporting fraction for
other variants. In this scenario, we are further along the infection trajectory than we realized. As a result,
herd immunity comes earlier than expected and Omicron severity is lower than estimated from data.
→ If many more cases are mild and went undetected, peak could be 3 fold lower.
19
Source (D. Karlen). See www.pypm.ca. These models include vaccination (including boosters) but have no age structure.January 6, 2022
BC COVID-19 Modelling Group
Omicron severity
● Solid hospital curves: The fraction of Omicron infections requiring hospitalization is 0.3 times the
hospitalization fraction for other variants. The duration for hospital stay is 0.4 times that for other variants.
These values are estimated from a study of US states where Omicron has been dominant for weeks.
● Alternative Omicron hospitalization scale factors: low (0.1) high (0.5). Duration scale factor is kept at 0.4.
→ If cases are much less severe than already assumed, peak could be significantly lower. 20
Source (D. Karlen). See www.pypm.ca. These models include vaccination (including boosters) but have no age structure.January 6, 2022
BC COVID-19 Modelling Group
Comparison with Quebec
● Because Omicron has been dominant for a longer period of time, hospital demand is now growing rapidly.
● Case data follows exponential growth. Case rates appear to be less affected by holiday and testing capacity.
● Growth rate substantially lower: 11%/day. Hospital growth consistent with case growth.
● Omicron hospitalization scale factor higher than other jurisdictions: 0.85. ICU scale factor 0.4.
Source (D. Karlen). See www.pypm.ca. These models include vaccination (including boosters) but have no age structure. 21January 6, 2022
BC COVID-19 Modelling Group
Comparison with Quebec (linear scale)
● Same data as on previous slide, but using a linear scale. Rapid growth in hospitalization demand is apparent.
● Projections shown in this report indicate that similar rapid growth in hospitalization in BC will begin soon.
Source (D. Karlen). See www.pypm.ca. These models include vaccination (including boosters) but have no age structure. 22January 6, 2022
Age-based model projections with Omicron BC COVID-19 Modelling Group
The following slides show model projections for the daily number of
cases and number in hospital due to Omicron, using BC data for
vaccination status and hospitalization rates by age.
Here we use the best current estimates for data for Omicron:
● VEinfection: Vaccine Effectiveness against infection set to 10% for unboosted
individuals and 75% for boosted individuals (UK Technical Briefing 33). SEAPIR Model (Day et al. 2020)
● Severity: Omicron is 76% as severe among unvaccinated (Ferguson et al.).
10 age classes
● Psevere (Hazard Ratio): Omicron is 34% as severe among vaccinated relative to
unvaccinated infected individuals (Ferguson et al.)
{0-9,10-19,...80-89,90+}
(See previous report for projections that account for uncertainty in these values.) 2 immune classes
The growth rate of Omicron was set to 20% per day, matching case ● Vaccinated (or recovered)
numbers in December. Length of stay in hospital was set to 12 days ● Susceptible
(typical for COVID in Canada) or halved to 6 days for Omicron.
Slides assume ~1/4 of all infections in BC were detected (Hamadeh et al.) up until December 21 (see Appendix
if 3/4 were detected). After this date, cases will represent a smaller fraction of infections due to testing limits.
Source (S. Otto). Modified from model analyses reported by CoVaRR-Net Pillar 6, modified to focus on predictions for the population of BC and adjusting the initial number of
cases to account for an observed incidence of ~1000 Omicron cases on December 21, alongside 300 cases and 192 hospitalizations for Delta (not modeled explicitly).
Data from Ferguson et al. use their corrected numbers (Psevere =26/76, assuming two doses of Pfizer vs unvaccinated, Table 3).January 6, 2022
Projected Omicron infections by age FEW INFECTIONS DETECTED (25%) BC COVID-19 Modelling Group
Doubling every 3.5 days (reduced by boosting) Only infections with moderate symptoms
INTERVENTION:
Boosting everybody
over age 60 before
Omicron
infections they are exposed to
(coloured by age) Omicron reduces
peak infections.
Zooming
in
Maximum cases
detected in previous
Cases detected (black)
waves in BC Detected cases were used to fit model only through December 21 (solid circles)January 6, 2022
Projected infections by age FEW INFECTIONS DETECTED (25%) BC COVID-19 Modelling Group
Doubling every 3.5 days (reduced by boosting) Only infections with moderate symptoms
Omicron
infections
Recent case numbers fall below the projection:
(coloured by age)
Numbers hovering around a constant level is
expected if testing capacity is at its limit.
Age-corrected prediction of 8115 cases on January 3 (slide 10)
matches projected case numbers well (*), suggesting that Zooming
recent growth rates have remained high (~3.5 day doublings). in
* *
Maximum cases
detected in previous
Cases detected (black)
waves in BC Detected cases were used to fit model only through December 21 (solid circles), assumes ~300 Delta cases (constant)January 6, 2022
Projected number in hospital by age FEW INFECTIONS DETECTED (25%) BC COVID-19 Modelling Group
Doubling every 3.5 days (reduced by boosting) Only infections with moderate symptoms
Boosting
everybody 60+
before exposure
helps but does not
prevent a hospital
surge, despite
Omicron’s lower
severity.
Halving stays in
hospital
with Omicron
Maximum
from previous
waves in BC Delta in greyJanuary 6, 2022
BC COVID-19 Modelling Group
Uncertainties in these projections
Might these projections about hospital demand be wrong?
There remains substantial uncertainty and the following possibilities would lead to lower surges:
● While data suggest some reduction in severity relative to Delta (incorporated above), the uncertainty in
these estimates is substantial. If Omicron is much less severe than reported, especially among the
unvaccinated who make up a large proportion of those requiring hospitalization, then peak hospital
demand could be reduced.
● We assumed shorter hospital stays (down 50% from an average of 12 days in Canada on slide 26, and
down 60% for the other projections), but if stays are reduced even further, that could help.
● Similarly, if Omicron often leads to such mild symptoms that more people are unaware that they are
infected, the peak hospital demand could be lower. [Slide 19 explores a scenario where only 30% of
infections are reported for Omicron relative to previous variants; slide 26 assumes that 25% of Omicron
infections are reported (when testing capacity is available).]
As more data on Omicron emerges, the plausibility of these more hopeful scenarios can be evaluated,
but with the data available, two independently derived models predict a severe demand on hospitals.
27January 6, 2022
BC COVID-19 Modelling Group
Changing immunity with Omicron
The risk of COVID-19 for an unvaccinated person relative to a fully vaccinated person has declined rapidly with the spread of
Omicron in BC. Being unvaccinated increased the relative risk of infection by an average of 8.8-fold before Omicron, but this is
declining to only 1.5-fold with Omicron (left). The risk of hospitalization has so far remained stable at 20.5-fold (right).
[Relative risks are for an average person (age corrected) and do not reflect patterns in specific ages. Impact of Omicron on risk of hospitalization
is expected to lag by about a week and may require more time to detect.]
Source (S. Otto) Risks for an unvaccinated person relative to a fully vaccinated person (age corrected) were obtained from the daily BC Gov News reports. Because risk of
infection is calculated across the past week, we use data from only one day per week (Wednesday [Tuesday for the week of the report]) and fit a (1–pt) + b pt, where pt is the
frequency of Omicron (inferred by D. Karlen in previous report, slide 7). Risk of hospitalization is calculated over the past two weeks of data, so we fit the data from every 28
other week using a linear model (analysing solid and hollow points separately) and average the results.January 6, 2022
Key messages BC COVID-19 Modelling Group
State of the Omicron wave in BC:
● The Omicron wave is clearly underway in BC, with Omicron infections doubling every 3-3.5 days.
● Different models agree that demand on the health care system will likely become extreme in January.
● Even under optimistic scenarios about Omicron severity, the need for expanded hospital bed space is strongly
indicated by independent model projections; urgent consideration of options for expanding hospital capacity over
the next month are strongly recommended.
● Information from elsewhere does indicate that the Omicron wave is likely to lead to better outcomes for
hospitalized patients (reduced need for ICU and mechanical ventilation) than a Delta wave of similar size.
● Testing capacity has been exceeded, making the daily case count figures almost useless for projections. To fill
this gap, data on rapid antigen results, sick days, and wastewater sampling could be used to improve estimates
of case rates. A representative sampling strategy to estimate prevalence in the community would be useful to
have but would need to be established extremely rapidly to yield results relevant for the Omicron wave.
Uncertainty:
● There is a great deal of uncertainty in current infection rates in BC. Estimates of severity and immune
protection vary, making it challenging to forecast the impact of the Omicron wave. Most projections have
infections peaking in January, unless growth rates are substantially slowed. The height of the ensuing
hospitalization wave is hard to estimate at present. We will carefully follow severity estimates from the
UK and elsewhere, as they come out, and update our projections.
● Based on the information we have, two different models currently project a hospitalization peak that
exceeds previous peak levels by a factor of between 4 and 10. 29January 6, 2022
APPENDIX: Adjusting fraction of cases detected BC COVID-19 Modelling Group
In the age-based model, two cases were explored:
● Main slides: Cases detected in BC were assumed to exclude
most infections that were asymptomatic or mild (70% of
infections in adults, 90% of infections in youth). These SEAPIR Model (Day et al. 2020)
undetected cases were, on average, half as transmissible.
10 age classes
● Appendix slides: Cases detected in BC were assumed to {0-9,10-19,...80-89,90+}
exclude only asymptomatic infections (20% of infections in
adults, 40% of infections in youth). These undetected cases 2 immune classes
were, on average, half as transmissible. ● Vaccinated (or recovered)
● Susceptible
Source (S. Otto). Modified from model analyses reported by CoVaRR-Net Pillar 6, modified to focus on predictions for the population of BC and adjusting the initial number of
cases to account for an observed incidence of ~1000 Omicron cases on December 21, alongside 300 cases and 192 hospitalizations for Delta growing at ~0% daily (gray).
Data from Ferguson et al. use their corrected numbers (Psevere =26/76, assuming two doses of Pfizer vs unvaccinated, Table 3).January 6, 2022
APPENDIX: Projected infections by age MOST INFECTIONS DETECTED (75%)
BC COVID-19 Modelling Group
Doubling every 3.5 days (reduced by boosting) Cases are all infections with any symptoms
INTERVENTION:
Boosting everybody
over age 60 before
they are exposed to
Omicron infections
Omicron reduces
(coloured by age)
peak infections.
Zooming
in
Maximum cases
detected in previous
Cases detected (black)
waves in BC Detected cases were used to fit model only through December 21 (solid circles), assumes ~300 Delta cases (constant)January 6, 2022
Projected number in hospital by age MOST INFECTIONS DETECTED (75%) BC COVID-19 Modelling Group
Doubling every 3.5 days (reduced by boosting) Cases are all infections with any symptoms
Boosting
everybody 60+
before exposure
helps but does not
prevent a hospital
surge, despite
Omicron’s lower
severity.
Halving stays in
hospital
with Omicron
Maximum
from previous Delta in grey
waves in BC (not modeled)January 6, 2022
Projected number in hospital by age MOST INFECTIONS DETECTED (75%) BC COVID-19 Modelling Group
Doubling every 3.5 days (reduced by boosting) Cases are all infections with any symptoms
Boosting
everybody 60+
before exposure
helps but does not
prevent a hospital
surge, despite
Omicron’s lower
Peaks in case and hospital demand are higher and later in these Appendix slides severity.
where most infections (75%) are assumed to be more symptomatic and detected.
Without a large proportion of undetected infections, it takes longer to accumulate Halving stays in
substantial numbers of people who are immune against Omicron. hospital
with Omicron
Nevertheless, the results are similar in predicting peak Omicron cases in January
with extreme pressure on hospital care for the most severe of these cases.
Maximum
from previous
waves in BC Delta in greyYou can also read