Creating Sustainable Value - January 2022 - Tamarack Valley Energy
←
→
Page content transcription
If your browser does not render page correctly, please read the page content below

TVE : TSX

                                                          Creating Sustainable Value

January 2022
See Disclaimers and Forward-Looking Statements attached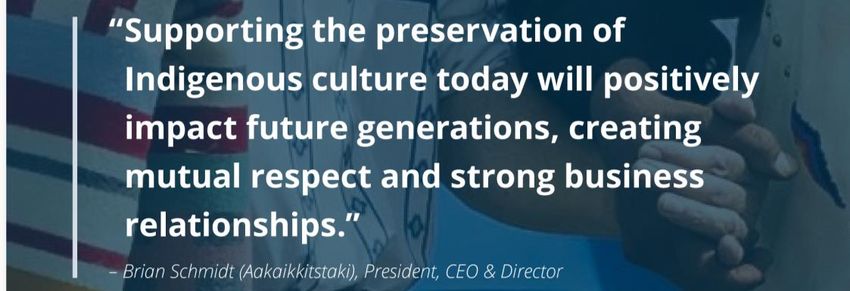
Disclaimers
    Forward Looking Statements: Certain information included in this presentation constitutes forward-looking information under applicable securities legislation. Forward-looking information typically contains statements with words such as “anticipate”,
    “believe”, “expect”, “plan”, “intend”, “estimate”, “propose”, “project” or similar words suggesting future outcomes or statements regarding an outlook. Forward-looking information in this presentation may include, but is not limited to, statements about: our
    corporate strategy, objectives, strength, focus and updated five year plan and the anticipated benefits thereof; the proposed acquisition of all of the issued and outstanding common shares of Crestwynd Exploration Ltd. (“Crestwynd”) pursuant to which
    the Company will further establish its position as a leading operator in the Clearwater area (the “Acquisition”), including the terms, timing and anticipated benefits and strategic rationale of such Acquisition; the increased capacity under the Company’s
    credit facilities, the extension of the revolving facility and the transition to a sustainability linked lending facility and the terms thereof, including sustainability performance targets; future intentions with respect to return of capital including dividends and
    share buybacks, including annual shareholder return potential; net debt reduction and debt targets; Tamarack's intention to return free funds flow to shareholders; the dividend policy; the granting of any special dividends or any share buybacks or other
    supplements to the base dividend; statements regarding plans or expectations for the declaration of future dividends and the amount thereof; Tamarack’s commitment to ESG principles and Indigenous relationships, including as disclosed in the
    Company’s 2021 Sustainability Report; Tamarack’s liquidity and financial position, the factors contributing thereto, the impact thereof and plans relating thereto; and Tamarack’s 2022 capital budget and guidance and capital program, including the timing
    and level capital expenditures; future production levels, including annual average production; oil and liquids weighting and changes thereto; development opportunities; drilling locations; economics and payouts of our wells; corporate decline rate and
    improvements thereto with greater exposure to assets under waterflood; application of EOR; hedging positions and targets; future waterflood potential, plans, outlook, estimates and forecasts; future land and seismic investments; additional consolidation
    opportunities; and future commodity prices including sustaining breakeven prices and exchange rates. Statements relating to “reserves” are also deemed to be forward looking statements, as they involve the implied assessment, based on certain
    estimates and assumptions, that the reserves described exist in the quantities predicted or estimated and that the reserves can be profitably produced in the future. Without limitation of the foregoing, future dividend payments, if any, and the level thereof,
    is uncertain, as the Company's dividend policy and the funds available for the payment of dividends from time to time is dependent upon, among other things, commodity prices, free funds flow financial requirements for the Company's operations and the
    execution of its growth strategy, fluctuations in working capital and the timing and amount of capital expenditures, debt service requirements and other factors beyond the Company's control. Further, the ability of Tamarack to pay dividends will be subject
    to applicable laws (including the satisfaction of the solvency test contained in applicable corporate legislation) and contractual restrictions contained in the instruments governing its indebtedness, including its credit facility.

    Forward-looking information is based on a number of factors and assumptions concerning Tamarack, Crestwynd and the assets to be acquired pursuant to the Acquisition which have been used to develop such information, but which may prove to be
    incorrect. In addition to other factors and assumptions which may be identified in this presentation, assumptions have been made regarding and are implicit in, among other things, satisfaction or waiver of the closing conditions to the Acquisition, receipt
    of required regulatory approvals for the completion of the Acquisition (including approval of the Toronto Stock Exchange), the success of future drilling, development and completion activities, the performance of existing wells, the performance of new
    wells, the performance of EOR projects, the availability and performance of facilities and pipelines, the geological characteristics of Tamarack’s properties, including the assets to be acquired pursuant to the Acquisition, the successful application of
    drilling, completion and seismic technology, prevailing weather and break-up conditions and access to our drilling locations, commodity prices, price volatility, price differentials and the actual prices received for the Company’s products, royalty regimes
    and exchange rates, the application of regulatory and licensing requirements, the availability of capital, labour and services, our ability to complete planned capital expenditures within budgeted cost estimates, the ability to market our and gas
    successfully, our ability to integrate assets and employees acquired through acquisitions, the creditworthiness of industry partners and our ability to acquire additional assets. Readers are cautioned that the foregoing list is not exhaustive of all factors and
    assumptions which have been used. Although Tamarack believes that the expectations and assumptions on which the forward-looking statements are based are reasonable, undue reliance should not be placed on the forward-looking statements
    because Tamarack can give no assurance that they will prove to be correct. Since forward-looking statements address future events and conditions, by their very nature they involve inherent risks and uncertainties. Actual results could differ materially
    from those currently anticipated due to a number of factors and risks. These include, but are not limited to, risks associated with the oil and gas industry in general (e.g., operational risks in development, exploration and production; delays or changes in
    plans with respect to exploration or development projects or capital expenditures; the uncertainty of reserve estimates; the uncertainty of estimates and projections relating to production, costs and expenses, and health, safety and environmental risks),
    incorrect assessment of the value of acquisitions, failure to realize the benefits of acquisitions, constraint in the availability of services, commodity price and exchange rate fluctuations, changes in legislation (including but not limited to tax laws, royalty
    regimes and environmental legislation), adverse weather or break-up conditions and uncertainties resulting from potential delays or changes in plans with respect to exploration or development projects or capital expenditures. Production forecasts are
    directly impacted by commodity prices and the actual timing of our capital expenditures. Actual results may vary materially from forecasts due to changes in interest rates, oil differentials, exchange rates and the timing of expenditures and production
    additions. In addition, the Company cautions that current global uncertainty with respect to the spread of the COVID-19 virus and its effect on the broader global economy may have a significant negative effect on the Company. While the precise impact
    of the COVID-19 virus on the Company remains unknown, rapid spread of the COVID-19 virus and variants may continue to have a material adverse effect on global economic activity, and may continue to result in volatility and disruption to global supply
    chains, operations, mobility of people and the financial markets, which could affect interest rates, credit ratings, credit risk, inflation, business, financial conditions, results of operations and other factors relevant to the Company. These and other risks are
    set out in more detail in Tamarack’s annual information form for the year ended December 31, 2020 (the “AIF”) and Tamarack’s management’s discussion and analysis for the period ended September 30, 2021 (the “MD&A”) . The AIF and MD&A can be
    accessed on Tamarack’s website at www.tamarackvalley.ca or under Tamarack’s profile on www.sedar.com. Forward-looking information is based on current expectations, estimates and projections that involve a number of risks and uncertainties which
    could cause actual results to differ materially from those anticipated by the proposed management and described in the forward-looking information. The forward-looking information contained in this presentation is made as of the date hereof and the
    proposed management undertakes no obligation to update publicly or revise any forward-looking information, whether as a result of new information, future events or otherwise, unless required by applicable securities laws. The forward-looking
    information contained in this presentation is expressly qualified by this cautionary statement.

2                                                                                                          w w w . t a m a r a c k v a l l e y. c a                                                                                                                              2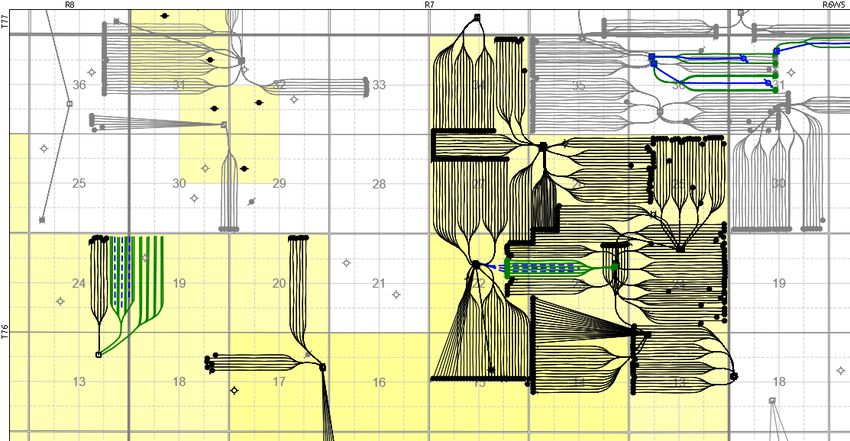
Disclaimers (Oil and Gas Advisories)
    FOFI Disclosure: This presentation contains future-oriented financial information and financial outlook information (collectively, “FOFI”) about Tamarack’s updated five year plan, including generating sustainable long-term growth in free funds flow, dividends
    and share buybacks, prospective results of operations and production, debt, net debt, debt targets, cash flow, adjusted funds flow, free funds flow breakeven, half-cycle returns, long-term free funds flow growth, balance sheet strength, cash costs, ARO,
    netbacks, corporate netbacks, operating netbacks, operating costs, corporate decline rate, tax pools, capital structure and components thereof, including pro forma the Acquisition and the increased capacity under the Company’s credit facilities, all of which
    are subject to the same assumptions, risk factors, limitations and qualifications as set forth in the above paragraphs and the assumptions outlined in the Non-IFRS measures section below. FOFI contained in this presentation was approved by management
    as of the date of this presentation and was provided for the purpose of providing further information about Tamarack’s anticipated future business operations. Tamarack disclaims any intention or obligation to update or revise any FOFI contained in this
    presentation, whether as a result of new information, future events or otherwise, unless required pursuant to applicable law. Readers are cautioned that the FOFI contained in this presentation should not be used for purposes other than for which it is
    disclosed herein.

    Reserves Disclosure: All reserve references in this presentation are to gross reserves as at the effective date of the applicable evaluation. Gross reserves are Tamarack’s total working interest reserves before the deduction of any royalties and including any
    royalty interests of Tamarack. The recovery and reserve estimates of Tamarack’s crude oil, natural gas liquids and natural gas reserves provided herein are estimates only and there is no guarantee that the estimated reserves will be recovered. Actual crude
    oil, natural gas and natural gas liquids reserves may be greater than or less than the estimates provided herein. The reserve estimates contained herein were derived from (i) a reserves assessment and evaluation prepared by GLJ Ltd., a qualified
    independent reserves evaluator, dated February 8 ,2021 with an effective date of December 31, 2020; (ii) in the case of the assets acquired pursuant to the acquisitions completed in March 2021, an internal estimate prepared by the Company’s internal
    Qualified Reserve Evaluators, with an effective date of March 1, 2021; (iii) in the case of the assets acquired pursuant to the acquisition completed on June 1, 2021, an internal estimate prepared on April 7, 2021 by the Company’s internal Qualified Reserve
    Evaluators, with an effective date of June 1, 2021; (iv) in the case of the Clearwater assets acquired on August 31, 2021, an internal estimate prepared by the Company’s internal Qualified Reserve Evaluators, with an effective date of June 1, 2021; and (v) in
    the case of the assets to be acquired pursuant to the Acquisition, an internal estimate prepared on November 30, 2021 by the Company’s internal Qualified Reserve Evaluators, with an effective date of February 1, 2022, in each case prepared in accordance
    with National Instrument 51-101 (“NI 51-101”) and the most recent publication of the Canadian Oil and Gas Evaluations Handbook (the “COGE Handbook”). It should not be assumed that the present worth of estimated future cash flow presented herein
    represents the fair market value of the reserves. There is no assurance that the forecast prices and costs assumptions will be attained and variances could be material. The recovery and reserve estimates of Tamarack’s crude oil, natural gas liquids and
    natural gas reserves provided herein are estimates only and there is no guarantee that the estimated reserves will be recovered. Actual crude oil, natural gas and natural gas liquids reserves may be greater than or less than the estimates provided herein.
    References in this presentation to peak rates, IRR, initial 30 day production rates (IP30), initial 90 day production rates (IP90) and other short-term production rates are useful in confirming the presence of hydrocarbons, however such rates are not
    determinative of the rates at which such wells will commence production and decline thereafter and are not indicative of long term performance or of ultimate recovery. While encouraging, readers are cautioned not to place reliance on such rates in
    calculating the aggregate production of Tamarack. Analogous Information: In this presentation, the Company has provided certain information on the prospectivity and the production rate of wells on properties adjacent to the Company's/Crestwynd's acreage
    which is "analogous information" as defined by applicable securities laws. This analogous information is derived from publicly available information sources which the Company believes are predominantly independent in nature. Some of this data may not
    have been prepared by qualified reserves evaluators or auditors and the preparation of any estimates may not be in strict accordance with the COGE Handbook. Regardless, estimates by engineering and geotechnical practitioners may vary and the
    differences may be significant. The Company believes that the provision of this analogous information is relevant to the Company's activities and forecasting, given its property ownership in the area (including as a result of the Acquisition); however, readers
    are cautioned that there is no certainty that the forecasts provided herein based on analogous information will be accurate. Type Curves: Certain type curves disclosure presented herein represents estimates of the production decline and ultimate volumes
    expected to be recovered from wells over the life of the well. The type curves represent what management thinks an average well will achieve, based on methodology that is analogous to wells with similar geological features. Individual wells may be higher
    or lower but over a larger number of wells, management expects the average to come out to the type curve. Over time type curves can and will change based on achieving more production history on older wells or more recent completion information on
    newer wells. BOE Disclosure: The term barrels of oil equivalent (“BOE”) may be misleading, particularly if used in isolation. A BOE conversion ratio of six thousand cubic feet per barrel of natural gas to barrels of oil equivalence is based on an energy
    equivalency conversion method primarily applicable at the burner tip and does not represent a value equivalency at the wellhead. All BOE conversions in the report are derived from converting gas to oil in the ratio mix of six thousand cubic feet of gas to one
    barrel of oil. OOIP Disclosure: The term original-oil-in-place (“OOIP”) is equivalent to total petroleum initially-in-place (“TPIIP”). TPIIP, as defined in the COGE Handbook, is that quantity of petroleum that is estimated to exist in naturally occurring
    accumulations. It includes that quantity of petroleum that is estimated, as of a given date, to be contained in known accumulations, prior to production, plus those estimated quantities in accumulations yet to be discovered. A portion of the TPIIP is considered
    undiscovered and there is no certainty that any portion of such undiscovered resources will be discovered. If discovered, there is no certainty that it will be commercially viable to produce any portion of such undiscovered resources. With respect to the
    portion of the TPIIP that is considered discovered resources, there is no certainty that it will be commercially viable to produce any portion of such discovered resources. A significant portion of the estimated volumes of TPIIP will never be recovered.
    bbls     barrels                             WTI    West Texas Intermediate, the reference price paid in U.S. dollars at Cushing, Oklahoma for the crude oil standard grade   mmcf/d   million cubic feet per day   P3    proved + probable + possible reserves
                                                                                                                                                                                  BOPD     barrels of oil per day       ERH   extended reach horizontal
    bbls/d   barrels per day                     AECO   the natural gas storage facility located at Suffield, Alberta, connected to TransCanada’s Alberta System
                                                                                                                                                                                  NAV      net asset value              EUR   estimated ultimate recovery
    boe/d    barrels of oil equivalent per day   IFRS   International Financial Reporting Standards as issued by the International Accounting Standards Board                     TTM      trailing twelve months       FX    foreign exchange

    GJ       gigajoule                           ROR    rate of return                                                                                                            EOR      Enhanced Oil Recovery        ESG   Environmental, Social and Governance

3                                                                                                                       w w w . t a m a r a c k v a l l e y. c a                                                                                                            3
Disclaimers (Oil and Gas Advisories)
    Non-IFRS Measures: Certain financial measures referred to in this presentation, such as net debt, adjusted funds flow, free funds flow, free funds flow breakeven, field level free funds flow, year-end net debt to Q4 annualized adjusted funds flow,
    market capitalization, enterprise value and capital efficiency are not prescribed by IFRS. Tamarack uses these measures to help evaluate its financial, operating performance, and liquidity and leverage. These non-IFRS financial measures do not
    have any standardized meaning prescribed by IFRS and therefore may not be comparable to similar measures presented by other issuers. Net debt is calculated as long-term debt plus working capital surplus or deficit adjusted for risk management
    contracts. Adjusted funds flow is calculated by taking net income or loss before taxes and adding back items, including transaction costs, and certain non-cash items including stock-based compensation; accretion expense on decommissioning
    obligations; depletion, depreciation and amortization; impairment; unrealized gain or loss on financial instruments; unrealized gain or loss on foreign exchange; unrealized gain or loss on cross-currency swap; and gain or loss on dispositions. Free
    funds flow (formerly referred to as free adjusted funds flow) is calculated as adjusted funds flow less capital expenditures, excluding acquisitions and dispositions. Free funds flow breakeven (formerly referred to as free adjusted funds flow breakeven)
    is determined by calculating the minimum WTI price in US/bbl required to generate free funds flow equal to zero sustaining current production levels and all other variables held constant. Field level free funds flow is calculated as free funds flow
    before the effect of interest and general & administrative expenses. Debt adjusted free funds flow yield is calculated as free funds flow, adjusted for growth (to add back capital in excess of maintenance and ARO capital and to remove the adjusted
    funds flow associated with growth volumes), plus finance costs, the sum of which is divided by enterprise value. Year-end net debt to Q4 annualized adjusted funds flow is calculated as net debt divided by the annualized adjusted funds flow for the
    most recently completed quarter. Market capitalization is calculated as shares outstanding multiplied by the closing market price of the shares on the day referenced. Enterprise value is calculated as market capitalization less net debt. Capital
    efficiency is calculated as capital expenditures for a project or period divided by the incremental production attributable to the expenditures.

    This presentation contains metrics commonly used in the oil and natural gas industry, such as operating netbacks (calculated on a per unit basis as oil, gas and natural gas liquids revenues less royalties, hedging gains (losses) and operating costs),
    operating field netback or OFN (total petroleum and natural gas sales, less royalties and net production and transportation expenses) NPV-10 (meaning the net present value (net of capex) of net income discounted at 10%), RLI (calculated by
    dividing reserves volumes by estimated production), EUR (meaning estimated ultimate recovery, an approximation of the quantity of oil or gas that is potentially recoverable or has already been recovered from a reserve or well), internal rate of return
    ("IRR") (a rate of return measure used to compare the profitability of an investment and represents the discount rate at which the net present value of costs equals the net present value of the benefits. The higher a project's IRR, the more desirable
    the project), adjusted funds flow (determined as gross oil, natural gas and natural gas liquids revenues including realized gains on commodity risk management contracts, less the following: royalties, operating costs, transportation costs,
    general and administrative costs and interest expense), free funds flow (calculated by subtracting adjusted funds flow in a period by the capital expenditures spent during that same period) and recycle ratio (measured by dividing the operating
    netback for the applicable period by finding and development cost per boe for the year, which is intended to compare netback from existing reserves to the cost of finding new reserves and may not accurately indicate the investment success unless
    the replacement reserves are of equivalent quality as the produced reserves), finding and development costs (calculated as the sum of field capital plus the change in future development capital (“FDC”) for the period divided by the change in reserves
    that are characterized as development for the period) and finding, development and acquisition costs (calculated as the sum of field capital plus acquisition capital plus the change in FDC for the period divided by the change in total reserves, other
    than from production, for the period). These terms have been calculated by management and do not have a standardized meaning and may not be comparable to similar measures presented by other companies, and therefore should not be used to
    make such comparisons. Management uses these oil and gas metrics for its own performance measurements and to provide shareholders with measures to compare Tamarack’s operations over time. Readers are cautioned that the information
    provided by these metrics, or that can be derived from the metrics presented in this presentation, should not be relied upon for investment or other purposes.

    Drilling Locations: This presentation discloses drilling locations two categories: (i) booked locations; and (ii) un-booked locations. Booked locations are proved and probable locations derived from an internal evaluation using standard practices as
    prescribed in the most recent publication of the COGE Handbook and account for drilling locations that have associated proved and/or probable reserves, as applicable. Un-booked locations are internal estimates and an assumption as to the number
    of wells that can be drilled per section based on industry practice and internal review. Un-booked locations do not have attributed reserves or resources. Of the approximately 1,337 (1,245.7 net) drilling locations identified herein, including in respect
    of the Acquisition, 308 (290.2 net) are proved locations, 236 (219.8 net) are probable locations and 793 (735.7 net) are unbooked locations. Unbooked locations have been identified by management as an estimation of our multi-year drilling activities
    based on evaluation of applicable geologic, seismic, engineering, production and reserves information. There is no certainty that the Company will drill all unbooked drilling locations and if drilled there is no certainty that such locations will result in
    additional oil and gas reserves, resources or production. The drilling locations on which the Company actually drills wells will ultimately depend upon the availability of capital, regulatory approvals, seasonal restrictions, oil and natural gas prices,
    costs, actual drilling results, additional reservoir information that is obtained and other factors. While certain of the unbooked drilling locations have been de-risked by drilling existing wells in relative close proximity to such unbooked drilling locations,
    the majority of other unbooked drilling locations are farther away from existing wells where management has less information about the characteristics of the reservoir and therefore there is more uncertainty whether wells will be drilled in such
    locations and if drilled there is more uncertainty that such wells will result in additional oil and gas reserves, resources or production.

    US Registration: This presentation is not an offer of the securities for sale in the United States. The securities have not been registered under the U.S. Securities Act of 1933, as amended, and may not be offered or sold in the United States absent
    registration or an exemption from registration. This presentation shall not constitute an offer to sell or the solicitation of an offer to buy nor shall there be any sale of the securities in any state in which such offer, solicitation or sale would be unlawful.

4                                                                                                            w w w . t a m a r a c k v a l l e y. c a                                                                                                                        4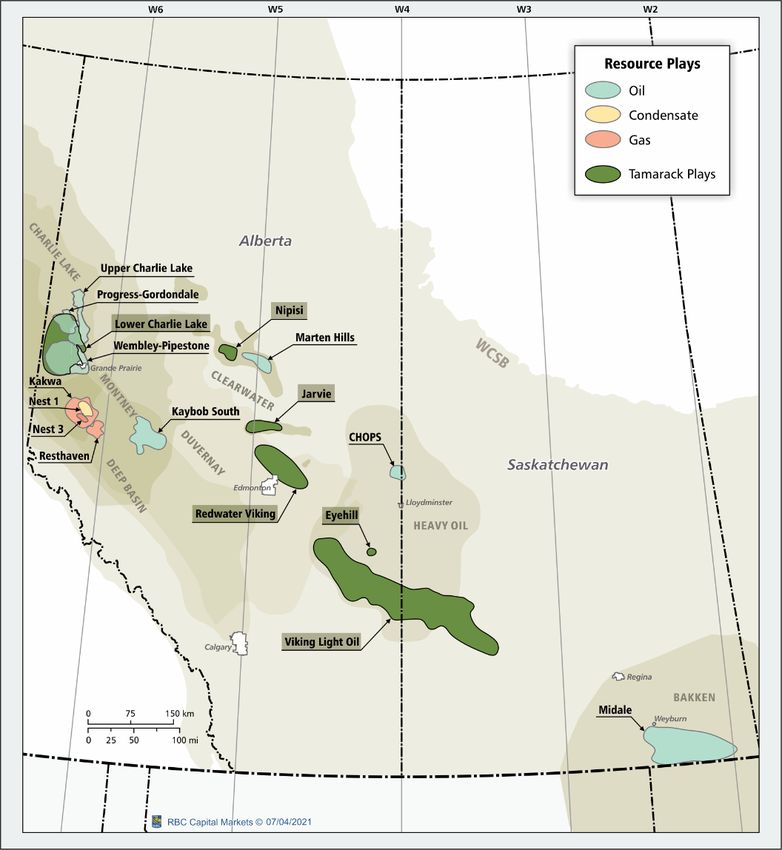
Corporate Snapshot (TSX: TVE)
    Corporate/Market Summary                    Tamarack
    Market Capitalization(1) ($MM)               $2,000
    Net Debt(2) ($MM)                             $565
    Enterprise Value(1) ($MM)                    $2,565                                                      Charlie Lake
                                                                                                               Light Oil
    Bank Line Capacity(2) ($MM)                   $700
    Tax Pools(2) ($MM)                           $975.0
                                                                                                                            Clearwater
                                                                                                                             Heavy Oil
    2022 Capital Budget and Guidance(3)                    2022 Full Year
    Average Production (boe/d)                             45,000 – 46,000
    Capital Expenditures ($MM)                              $250 – $270
    Royalties                                                16% – 17%
                                                                                           Cardium
    Transportation ($/boe)                                  $2.00 – $2.10                  Light Oil
                                                                                          Spirit River
    Operating Costs ($/boe)                                 $8.50 – $8.70
                                                                                             Gas
    G&A ($/boe)                                             $1.30 – $1.35
    Sustaining FFF Breakeven (US$/bbl WTI)(4)                 ~$35.00
                                                                                                                                      Waterflood
                                                                                                                                    Viking & Sparky
                                                                                                                                   Light & Medium Oil

5                                                                 w w w . t a m a r a c k v a l l e y. c a                                              5
2022 Budget Highlights
    Capital Spending ($260MM)                                  Focused              • Investing $250MM to $270MM of annual capital
                                                                Capital             • Drilling 126 (116 net) wells targeting the Clearwater, Charlie Lake &
           $35
                                Clearwater                    Deployment              Waterflood projects
                                Charlie Lake
     $37              $111                                                          • Drilling activity drives volumes of 45,000 – 46,000 boe/d (73-75% liquids)
                                Veteran/ Eyehill              Optimized
                                                                                    • Allocating 25% of capital to low decline EOR initiatives in the Nipsi
                                Corporate/ ESG/ Exploration   Production
                                                                                      Clearwater, Veteran and Eyehill areas
           $78

                                                              Sustainable           • Capital program funded through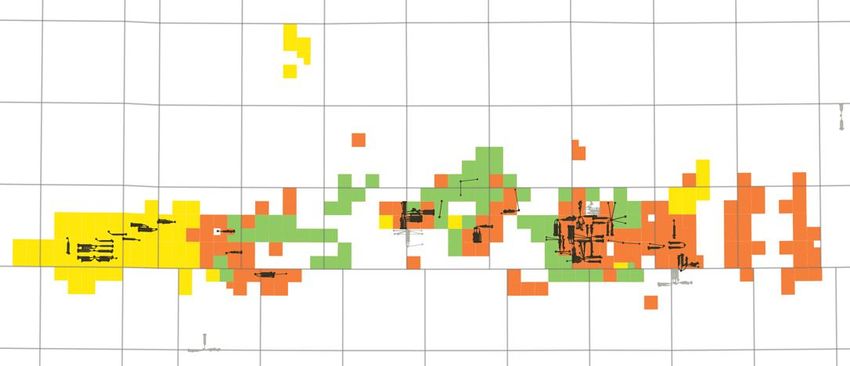
Strategic Consolidation in the Clearwater
     Tamarack is now the largest operator in the Southern Clearwater area with over 166,000 net acres of land

                          Pro Forma Greater Jarvie Assets                                                                     Greater Jarvie Well Results

                                                                                                               Oil Production (bopd)

                                                                                                               250                                       Crestwynd Clearwater
                                                Perryvale 14-21                                                                        Perryvale 14-21
                                                                                                                                       IP30 235 bopd     Perryvale 110 mbbl
                                              IP30 rate: 235 bopd
                                                                                                                                                         Meanook 100 mbbl
                                                                                                               200                                       Newbrook 85 mbbl

                                                                                                               150

                                                                                                               100

                                   Perryvale
       Spur Acquisition
                            peak monthly oil rates: 175-
          Aug ‘21                                                   Meanook                  Waterflood
                                                                                                                50
                                   200 bopd
                                                              core development area            Pilot

                                                                                                                -

7                                                                   w w w . t a m a r a c k v a l l e y. c a                                                                    7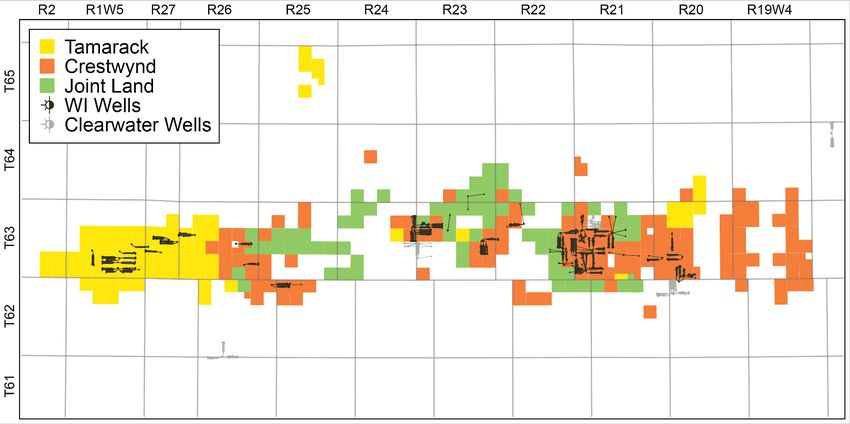
Clearwater Acquisition – Crestwynd Exploration Ltd.
         Further establishing Tamarack as a leading operator in the highly economic Clearwater oil play

    Sustainable,      • Forecast 2022 production of ~4,500 boe/d(1) is expected to deliver $90 million of annualized operating field netback (2),(3)
    High Quality
                      • >150 net future drilling locations(4), across only 50% of the 99,360 net acres acquired supports current production levels for 7 years; exploration upside on remaining lands
    Clearwater
    Assets            • Attractive environmental profile with minimal ARO and limited freshwater requirements

    Increased         • Pro forma the Acquisition, Tamarack will control 445 net sections of Clearwater land
    Clearwater        • Over 650 net future drilling locations(4) and expected 2022 average Clearwater production of ~12,000 boe/d (5)
    Exposure          • Strategically assembled Clearwater asset base focused on properties that provide low-risk production and inventory capable of generating significantt free funds flow(2)

                      • Consolidates Tamarack’s existing WI to 95% and solidifies its dominant position as the largest Southern Clearwater operator
    Strategic
                      • Allows Tamarack to optimally develop the assets from an economic and environmental perspective
    Consolidation
                      • Low annual sustaining capital of $30 to $35 million required to hold production levels flat on the acquired assets (3)

    Accretive to      • $184.7MM purchase price implies a multiple of 2.1x annualized operating field netback (2),(3)
    Tamarack
                      • Increases annual adjusted free funds flow(2) per share by greater than 5% throughout Tamarack’s five-year plan at crude oil prices of US$55
    Shareholders

8                                                                          w w w . t a m a r a c k v a l l e y. c a                                                                                     8
Executing on Core Area Strategic Acquisitions
       Improving sustainability and resiliency, while enhancing free funds flow(1) profile

                                                       Sparky /                  Charlie Lake
                                Clearwater                                                            Clearwater         Clearwater
                                                      Clearwater                   Light Oil
                               December 2020                                                          August 2021       December 2021
                                                      March 2021                  June 2021

     Acquisition Overview
     Purchase Price              $74 million          $135 million                $494 million         $36 million       $185 million
     Production                  2,000 boe/d          2,800 boe/d                 12,500 boe/d          400 boe/d        4,500 boe/d
     Op. Field Netback(1)        $20 million           $35 million                $135 million         $6.7 million       $90 million

     Implied Multiples
     PP/Op. Field Netback(1)        3.8x                  3.9x                        3.7x                 5.4x              2.1x
     PP/Production             $37,000 / boe/d       $48,000 / boe/d             $41,900 / boe/d      $90,000 / boe/d   $40,600 / boe/d

     Asset Summary
     Gross Locations(2)        400+ locations     100+ CW / 50+Sparky            250+ locations       60+ locations     200+ locations
     Undiscounted ARO            $3 million            $11 million                 $18 million         $2.6 million
Sustainability Linked Lending Facility
Strengthening Our Commitment to Positive ESG Progress
Tamarack transitioned the existing credit facility to a sustainability linked lending facility (SLL) in December 2021:
• SLL facility incorporates sustainability linked pricing terms (+/- 5 bps based on meeting or missing targets)
• KPIs and SPTs selected strongly align with Tamarack’s existing priority topics and commitments
• Emissions reduction target exceeds previously set target due to 2021 acquisitions and positive emissions reduction progress to date
Tamarack UN Sustainable Maximum Pricing Adjustment
Key Performance Indicator 2020 Baseline Sustainability Performance Target
Priority Development Goal
Drawn Standby
Scope 1 and 2 37.5 kg
39% reduction by 2025 ± 2.50 bps ± 0.625 bps
emissions intensity CO2e/boe
150% of the regulatory target spend
Decommissioning
5.6% under the voluntary closure program ± 1.50 bps ± 0.375 bps
Management – ARO spend
annually(1)
Indigenous representation Increase to >6.0% by 2025 with a
3.5% ± 1.00 bps ± 0.250 bps
in the workforce minimum 2 FTE additions each year
Maximum Pricing Adjustment ± 5.00 bps ± 1.250 bps
10 w w w . t a m a r a c k v a l l e y. c a 10Tamarack Strategic Principles
Strategic Principles Tactical Execution
BALANCE SHEET STRENGTH AND RISK MANAGEMENT
Low Leverage & Balance Sheet • 1,000 locations through a successful acquisition strategy over the past year
Sustainable Free
LOW FREE FUNDS FLOW BREAKEVEN(1) AND DECLINE RATE DRIVE STABLE FFF(1)
Funds Flow(1) Free Funds • Attractive corporate decline rate supported by waterfloods and highly sustainable oil production
Growth Flow(1) Generation reduce Tamarack’s free funds flow breakeven(1) to ~US$35/bbl WTI
• Economic assets and inventory runway support free funds flow(1) growth
LOW LEVERAGE & STABLE FFF(1) GENERATION SUPPORT RETURN OF CAPITAL
Prudent Approach to Return of • Excess free funds flow(1) and decreased leverage enable return of capital optionality
Capital and Strategic M&A • Disciplined deployment of capital to strategic M&A aligned with free funds flow(1) accretion
FOCUS ON ENVIRONMENT, INDIGENOUS PARTNERSHIPS, AND ETHICAL GOVERNANCE
Strong Commitment • 25% reduction target in Scope 1 and 2 emissions intensity by 2025 (over 2017 baseline)
to ESG • ARO spend exceeds annual voluntary targets set by the Alberta Energy Regulator
11 w w w . t a m a r a c k v a l l e y. c a 11Framework for Returning Capital to Shareholders
Sustaining Capital & Base Dividend Protected Down to US$35/bbl WTI
Free Funds Flow(1) Allocation
Net Debt ≥$375MM Net Debt $325MM-$375MM(2)
Base
Base Dividend +
Debt
Dividend
Delivering Enhanced Returns to Repayment Share
Shareholders Debt
and/or Buybacks
Strategic and/or
Repayment
M&A Special
Dividends
Return of Capital (up to 25%) Balance Sheet (up to 75%) Return of Capital (up to 50%) Balance Sheet (up to 50%)
Continuing to Build for the Future w/ 10+ Years of Drilling Inventory
Sustaining Capital Reinvestment RequiresReturn of Capital Strategy
Sustainable Base Dividend
• Predicated on up to 25% of free funds flow(1) at US$55 WTI and $2.50/GJ AECO
• Sustaining capital + base dividend is fully fundable down to US$35/bbl WTI and would represent only 37% payout on current strip
• Up to 75% for debt repayment, strategic M&A and ESG initiatives
Sustainable Base Dividend Growth
• The base dividend would target small annual growth aligned with earnings and macro economic outlook
+
Enhanced Return to Shareholders
• Long-term debt target of $325MM - $375MM threshold TVE plans to return up to 50% of the PRIOR QUARTER free funds flow(1) INCLUDING BASE DIVIDENDS to
shareholders
• Tactical share buybacks (pending approval of NCIB by the TSX) and/or special dividends
• Evaluating buyback vs. special dividend: consideration of intrinsic value, FFF(1) yield, relative market valuation and macro conditions
• Remaining 50% of free funds flow directed to the balance sheet for future M&A and or other opportunities
• Enhanced returns evaluated in the context of overall market conditions
The long-term net debt(1) target of $325MM - $375MM predicated on 1.0x D/AFF(1) at US$45/bbl WTI
13 w w w . t a m a r a c k v a l l e y. c a 13Illustrating Annual Shareholder Return Potential
Base Dividend Fully Funded at US$35/bbl While Continuing to Reduce Debt
At US$70/bbl Debt
Allocating Free Cash Flow5-Year Plan Anchors Long Term Sustainability
Base Case 46,000 – 49,000 boe/d(2)
$800
Total Annual Funds Flow ($MM)
5-Year Plan Overview $600
(BTAX US$55/bbl WTI & $2.50/GJ AECO) $400
$200
E&D Capital $1.1B - $1.3B 56% 48% 39% 68% 46% 34% 63% 43% 31% 62% 41% 31% 62% 40% 31%
$0
Spending ($220MM - $270MM/yr)
$45/bbl
$55/bbl
$70/bbl
$45/bbl
$55/bbl
$70/bbl
$45/bbl
$55/bbl
$70/bbl
$45/bbl
$55/bbl
$70/bbl
$55/bbl
$45/bbl
$70/bbl
2022 2023 2024 2025 2026
Corporate FFF(1) $1.1B - $1.2B
Sustaining Capex Base Dividend FFF
Generation ($220MM - $20MM/yr)
$80 Cash Available Beyond Sustaining Capital ($/bbl) 1.5x
Trailing 12-Month D/AFF (1) at US$55/bbl
Free Funds Flow ~US$35/bbl WTI $70 1.0x
Breakeven(1) (includes Base Dividends) $60
0.5x
$50
US$/bbl WTI
Sustaining Capital as 0.0x
$40
% of Adjusted Funds
WTI
40% - 45% -0.5x
$30
Flow(1) -1.0x
$20
$10 -1.5x
Target Long-term
0.5x – 1.0x D/AFF(1) $0 -2.0x
Leverage 2022 2023 2024 2025 2026
Sustaining Capital Dividend Surplus up to US$45/bbl Surplus up to US$55/bbl
Surpus up to US$70/bbl D/AFF at US$55/bbl D/AFF at US$70/bbl
15 w w w . t a m a r a c k v a l l e y. c a 15Transformative 2021 Enhances Focused Inventory
Balancing Duration with Free Funds Flow(1) Growth
Inventory of Net Locations(2) HIGHLY ECONOMIC INVENTORY SUPPORTS LONG TERM SUSTAINABILITY
(assumes payout17
0.0
1.0
1.5
2.0
2.5
3.0
3.5
0.5
Years
Clearwater Multi-Laterals
Frobisher Dual Leg
Charlie Lake
SK Mississippian Conventional
Payout Period
Viking Dodsland
Conventional Heavy Oil Hz.
Delaware Wolfcamp A (Top Quartile)
Eagle Ford Oil - East (Top Quartile)
N. Midland Wolfcamp A (Top Quartile)
North Dakota Bakken (Top Quartile)
Half-cycle Breakeven
Viewfield Bakken
Viking Alberta
Cardium Oil
Source: Peters & Co. Limited estimates based on US$60/B WTI, US$3.25/Mcf NYMEX and C$3.25/Mcf AECO prices.
Eagle Ford Oil - West (Top Quartile)
Montney Oil Alberta
DJ Basin Niobrara
Delaware Wolfcamp A
North Dakota Bakken
N. Midland Wolfcamp B
N. Midland Wolfcamp A
STACK Meramec
N. Midland Lower Spraberry
Powder River Basin Turner
North American Payout Period & Half-Cycle Breakeven by Play
Eagle Ford Oil - East
Eagle Ford Oil - West
w w w . t a m a r a c k v a l l e y. c a
US$/bbl
$0
$20
$30
$40
$50
$60
$70
$10
Positioned in the top FFF(1) oil plays in North America
Legend
17Capital Allocation Optionality Delivers Sustainability
Portfolio that can deliver near-term and long-term free funds flow(1)
Sustaining Capital
Waterflood Management Economic Growth
Modest Growth
Highly Economic Inventory that Sustains
Low Decline,
Meaningful Production While Generating Highly Economic Production Growth
Stable Production Base
Significant Free Funds Flow(1)
Veteran Viking Light Oil Charlie Lake Light Oil Wells Nipisi Clearwater Oil Wells
Eyehill Sparky Medium Oil ~25% Viking Primary Oil Wells ~40% Jarvie Clearwater Oil Wells ~35%
Clearwater Medium Oil Cardium / Falher Wells
Slave Point and Penny Light Oil
Capital Allocation Across a Portfolio of High Quality, Long-Life Oil Assets that Delivers
Production and Free Funds Flow(1) per Share Growth
Percent of 2022
Capital Program
18 w w w . t a m a r a c k v a l l e y. c a 18Highly Economic Lower Charlie Lake Light Oil Locations
Production maintained between 12,000 – 13,000 boe/d(2)
Two Mile Lateral Length Normalized Well Performance(1)
200
Cumulative Production (Mbbl)
13-19: ~45% of wells ≥ 2 miles(3)
150
890 bopd
1,060 boe/d(3) Tier10
100 Tier 9
12-19: Tier 8
931 bopd Tier 7
1,100 boe/d(3) 50
0
0 4 8 12 16
12-3: Months
734 bopd
1,220 boe/d(3)
TVE’s First Two Wells: 2.5 Month Payout
10
8
Payout (Months)
6
4-19:
586 bopd 4
720 boe/d(3)
2
0
Tier 7 Tier 8 Tier 9 Tier 10
$45 WTI $55 WTI $70 WTI
19 w w w . t a m a r a c k v a l l e y. c a 19Tamarack Clearwater Asset Overview
Drilling Inventory of >10 years on Primary Recovery
NIPISI/MARTEN
T78
15-29 West
Stepout
14-26 West
Stepout
Type Curve(1) Payout Period
~300 bopd ~240 bopd
14
T77
5-13 Marten
Stepout
~118 bopd
12
Payout (months)
14 API 10
T76
8
13-25 West 6
Stepout 15-17 West
Main Development Area 4
T75
~70 bopd (3 legs) Stepout
19 API Average IP30: ~185 bopd
~250 bopd HWX 11-32 2
Exploration Well
Legend ~135 bopd (11 days) 0
R9 R7 R5 R3W5 6 Leg Tier 1 8 Leg Tier 1
$45 WTI $55 WTI $70 WTI
JARVIE
T65
TVE Inventory
Including the Crestwynd lands Tamarack
will hold over 166,000 net acres in the
southern Clearwater
Current Production:
T64
~5,200 bopd Nipisi and Marten Hills
T63
~480 bopd Jarvie
T62
R1W5 R25 R23 R21 R19W4
20 w w w . t a m a r a c k v a l l e y. c a 20Clearwater Waterflood Potential
Tamarack will develop the play with a long-term view to the application of EOR
Nipisi/Marten Hills EOR Pilots Evolution of Waterflooding Criteria/Applicability
Spur Nipisi
Pilots Marten Hills:
Numerous WF Pilots
(Headwater, Spur,
Deltastream)
TVE Pilot
• Other companies have initiated EOR pilot projects (both waterflood and polymer floods) in the Clearwater formation
• Tamarack’s Clearwater assets have the key attributes required for successful EOR projects and management has extensive experience managing waterfloods
• Tamarack has identified the focus area for its initial waterflood pilot which will commence in Q1 2022
21 w w w . t a m a r a c k v a l l e y. c a 21Clearwater Waterflood Potential
Leveraging promising results from offsetting competitor pilots
Upcoming Tamarack Nipisi EOR Pilots
15-13 Pad Pilot Spur Waterflood Pilots
• 2 x 8-leg producers onstream Q4-2021
• Staggered leg spacing (“two-step”) allows for water
injection corridors while maintaining near-term
productivity
• 3 x single leg injectors drilled Q1-2022 will
maximize appraisal information
11-22 Pad Pilot
• Multi-lateral injector trial in primary development
region in H1-2022 11-22 Pad
• Appraisal of well spacing and interlocking multi-
lateral layout
15-13 Pad
22 w w w . t a m a r a c k v a l l e y. c a 22Tamarack’s Waterflood Assets
Improving corporate declines with increasing exposure to assets under waterflood
Total Est. Est.
Total Area Prod. Under Injection % of P+P
Asset Asset Recovery Ultimate Current Initiatives
Prod. Waterflood Start Reserves
OOIP(1) to Date(2) Recovery(2)
Focus new linedrive pattern development in
Veteran Viking 2,200 bbl/d under 900 to 1,000 North Veteran (including pipeline infrastructure)
3,600 bbl/d 2% 17% 2018 44%
Light Oil active waterflood MMbbl and start injection on first East Consort stepout
injection pattern during 2022
Continue to increase make-up water supply,
Eyehill Sparky 1,425 bbl/d under
1,950 bbl/d 200 MMbbl 2% 15% 2014 54% complete 5 injector conversions and add 9 new
Medium Oil active waterflood
Sparky producers during 2022
Actively managing injection for optimal
Penny Barons 825 bbl/d
825 bbl/d 60 MMbbl 15% 21% 2001 100% area-based recovery factors, additional infill
Light Oil (entire pool)
locations identified
Nipisi Identify injector conversions to improve
475 bbl/d
Slave Point 475 bbl/d 40 MMbbl 8% 20% 2013 100% waterflood performance, evaluate opportunities
(entire pool)
Light Oil for infill producers after injection optimization
Nipisi 15 to 20 MMbbl Two-step producers onstream Q4-2021 in
No active Up to 20% in
Clearwater 5,500 bbl/d per section inTamarack Waterflood Production
Improving corporate declines with increasing exposure to assets under waterflood
Net Waterflooded Oil - Includes 2022 Capital Program
Production (bopd)
Penny Barons Veteran Viking Nipisi Slave Point Eyehill Sparky
7,000
6,000
5,000
4,000
3,000
2,000
1,000
0
Jan-2020 Apr-2020 Jul-2020 Oct-2020 Jan-2021 Apr-2021 Jul-2021 Oct-2021 Jan-2022 Apr-2022 Jul-2022 Oct-2022 Jan-2023
Recent additions in Eyehill and Nipisi will complement stable performance in Penny and exciting growth in Veteran
24 w w w . t a m a r a c k v a l l e y. c a 24Tamarack Sustainability Results
Emissions Intensity Land Management
2020 GHG Scope 1 + 2 Intensity by Company
(kgCO2e/boe) Net ARO Spend/Inactive Liability
14.0 10.50% 12.0%
ARO Spend/Inactive Liability (%)
Net ARO Spend/Grants Awarded
90.00
12.0 10.0%
80.00 1.3
70.00 10.0
8.0%
(CAD$MM)
60.00 8.0 5.36% 5.5 6.0%
50.00
6.0 3.97% 1.1
40.00
1.4 4.0%
30.00 4.0 2.33%
20.00 1.15% 4.7 2.0%
2.0 3.2 3.8
10.00 1.9
0.0 0.9 0.0%
0.00
Peer 1 Peer 2 TVE 21 TVE Peer 3 Peer 4 Peer 5 Peer 6 Peer 7 Peer 8 2017 2018 2019 2020 2021 (est.)
Est. Net ARO spend (TVE funded) Net ARO spend (grant funded)
Peers Include: ARC, Baytex, Cenovus, CNRL, Crescent Point, Enerplus, Suncor, Whitecap Add. grants awarded (carry fwd future yr) ARO spend/inactive liability (1)
TVE is forecasting a Scope 1 +2 emissions intensity of 28.5 kgCO2e/boe for 2021
Understanding and managing risks enables sustainability and ESG to drive profit and enhance future value
25 w w w . t a m a r a c k v a l l e y. c a 25Sustainability Initiatives at Tamarack
Indigenous Engagement Environmental Initiatives
Tamarack is committed to the principles of UNDRIP and participating in
reconciliatory activities. 2021 year-to-date projects include: To ensure achievement of long-term goals and targets,
• Furthered workforce participation goals – team members include
Tamarack undertakes regular initiatives including:
three Indigenous women in head office
• Cultural initiatives (interactive educational tools for teens) Nipisi Gas 60 → 28 kgCO2e/boe
through process modifications and gas
• Economic opportunities and employment for First Nations Conservation conservation in the new Nipisi asset
individuals and businesses
• Indigenous site rehabilitation program support for indigenous Operational ↓~6,000 tCO2e annually
business opportunities and reduction of environmental liabilities through the removal of six booster
Efficiency Reviews
compressors in the Westerose asset
Tamarack is actively engaging with Treaty 8 Nations in the Nipisi area and
(1)
the Kainai Nation in the Lethbridge area. Eyehill Fresh Water 100% utilization
of non-freshwater in Eyehill for EOR and
Reductions
completion on a go forward basis
Area Based 85 gross wells
Abandonment abandoned through efficient area-based
programs designed to maximize efficiency
Increasing Leg Count 6 → 8 legs
in Multileg Wells in multileg horizontals enables more efficient
drainage with less surface land disturbance
26 w w w . t a m a r a c k v a l l e y. c a 26Investment Summary
Track record of meeting and exceeding estimates
Sustainable Returns Focused Strategy to Grow Production and Free Funds Flow(1) per Share
Management team that has demonstrated its ability to execute and capitalize on opportunities
Stable Base Economic Oil Balance Sheet
Leading ESG
Production and Weighted Optionality Strength and Risk
Practices
AFF(1) Inventory Management
40,500 boe/d Highly economic Commodity exposure, Low leverage and Indigenous partners,APPENDIX 28 w w w . t a m a r a c k v a l l e y. c a 28
Repositioning During the Downturn
      Theme: Generate Long-term Sustainable Free Funds Flow(1)

                   Objectives                      2020 Status                           Transformational Action               Outcomes

                                                                               Align compensation with long-       Long-term focus: 5-year DAFFF(1),
           Revamp Incentive Plan       1-year focused goals & TSR(1)
                                                                                     term FFF(1) growth               decline rate, PIR(1) & ESG

            Become Relevant to                20,000 boe/d                                                                  ~40,000 boe/d
                                                                                        M&A and drilling
               Shareholders             ~$200 million market cap(1)                                                     ~$1 billion market cap(1)

                                                                               Organic and M&A in Clearwater,          PIR Inventory 1.9 → 2.7
        Improve Inventory Resiliency    PIR(1) Inventory 1.5 → 1.75
                                                                               Charlie Lake and Waterflood in                Decline 27%
              & Decline Rate                     Decline 37%
                                                                                  Eyehill, and Slave Point            Added 910+ gross locations

                                         FFF breakeven price(1) of                 Quick payout high PIR(1)        FFF Breakeven price(1) of $35/bbl
       Enhance Debt Adjusted FFF(1)
                                              ~$45/bbl WTI                     investment and debt repayment         WTI moving to $33/bbl WTI

                                                                                                                     Top 25% in peer group for low
                                       Limited public disclosure and                     Issue report
               Improve ESG                                                                                                  emission intensity
                                           formal ESG tracking                   Accretive ESG transactions
                                                                                                                   Inactive ARO relative to size drops
29                                                      w w w . t a m a r a c k v a l l e y. c a                                                         29
Risk Management – Tamarack’s Current Hedges(1),(2)
Enhancing certainty with flexibility to capture upside value
50%
Q1 2022 Q2 2022 Q3 2022 Q4 2022
WTI Put
Oil price protection in 2022(2) Volume (bbls/d)
Average Put/Premium (USD/bbl) $68.76
19,750
$3.97 $52.71
7,750
$2.70 $53.10 $3.10
750
$53.10 $3.10
750
WTI 2-way collar
Oil Hedge Coverage Volume (bbls/d) 1,250 4,250 9,250 3,500
100% Average Put/Call/Premium (USD/bbl) $52.60 $87.17 $2.00 $54.76 $90.46 $2.01 $58.57 $93.51 $2.00 $58.50 $92.13 $2.00
80%
WTI 3-way collar (reverse)
Volume (bbls/d) 1,250 2,500 1,250 750
60% Average Put/Call/Sold Put/Premium (USD/bbl) $55 $70 $73 $2 $54 $70 $73 $2 $55 $70 $73 $2 $55 $70 $74 $2
Edm Par Diff
40% 7,000 10,500 1,500 1,500
Volume (bbls/d)
20% Average Fixed Price (USD/bbl) ($3.86) ($3.66) ($3.87) ($3.87)
WCS Diff
0% Volume (bbls/d) 3,000 4,000 500 500
Q1 2022 Q2 2022 Q3 2022 Q4 2022 Average Fixed Price (USD/bbl) ($12.58) ($11.79) ($12.00) ($12.00)
WTI Total (%) MSW Diff (%) WCS Diff (%)
Crestwynd Q1 2022 Q2 2022 Winter 21-22 Summer 22
Gas Hedge Coverage WTI fixed price AECO 5A fixed price
50%
Volume (bbls/d) 500 Volume (GJ/d) 40,000 30,000
40%
Average Fixed Price (CAD/bbl) $83.44 Average Fixed Price (CAD/GJ) $3.10 $2.44
30%
WTI 2-way collar
20%
Volume (bbls/d) 250 500
10%
Average Put/Call (CAD/bbl) $75.00 $99.66 $75.00 $96.01
0%
Winter 21-22 Summer 22 WCS Diff
Volume (bbls/d) 1,000 500
AECO (% of Total) US Markets (% of Total)
Average Fixed Price (USD/bbl) ($16.23) ($14.85)
30 w w w . t a m a r a c k v a l l e y. c a 30Corporate Information
Executive Independent Reserve Evaluator
Brian Schmidt (Aakaikkitstaki) President & Chief Executive Officer GLJ Petroleum Consultants
Steve Buytels VP Finance & Chief Financial Officer
Kevin Screen Chief Operating Officer Auditors
Scott Reimond VP Exploration KPMG LLP
Martin Malek VP Engineering
Christine Ezinga VP Corporate Planning & Business Development Legal Counsel
Scott Shimek VP Production & Operations Stikeman Elliott LLP
Banking Syndicate Lead
Board of Directors National Bank of Canada
John Rooney (1,3,4) Chairman
Brian Schmidt (Aakaikkitstaki) President & Chief Executive Officer Head Office
Jeff Boyce (1,2) Independent Director Jamieson Place
Ian Currie (2,4) Independent Director Suite 3300, 308 - 4th Ave S.W.
John Leach (1,2) Independent Director Calgary, AB T2P 0H7
Marnie Smith (1,3) Independent Director
Robert Spitzer (2,3) Independent Director Phone: 403.263.4440
www.tamarackvalley.ca
1. Member of Audit Committee of the Board of Directors
2. Member of the Reserves Committee of the Board of Directors Investor Contact Information
3. Member of the Compensation & Governance Committee of the Board of Directors Brian Schmidt Steve Buytels
or
4. Member of the Environment, Safety & Sustainability Committee President & Chief Executive Officer VP Finance & Chief Financial Officer
31 w w w . t a m a r a c k v a l l e y. c a 31Notes
Page 5
1. Includes shares to be issued as part of the Crestwynd acquisition; share pricing updated to reflect closing price on January 12, 2022
2. Forecasted as at closing of the Crestwynd acquisition
3. 2022 pricing assumptions: WTI US$70/bbl, MSW/WTI differential of US$4.00/bbl, WCS/WTI differential of US$14.00/bbl, AECO at $3/GJ and exchange rate of 1.28
4. See Disclaimers – “Non-IFRS Measures”; free funds flow and free funds breakeven were formerly referred to as free adjusted funds flow and free adjusted funds flow breakeven respectively
Page 6
1. See Disclaimers – “Non-IFRS Measures”; free funds flow and free funds breakeven were formerly referred to as free adjusted funds flow and free adjusted funds flow breakeven respectively
Page 8
1. Comprised of 4,500 bbl/d heavy oil
2. See Disclaimers – “Non-IFRS Measures”; FFF – Free Funds Flow; AFF – Adjusted Funds Flow; D/AFF – Net debt to annual adjusted funds flow; free funds flow and free funds breakeven were formerly referred to as
free adjusted funds flow and free adjusted funds flow breakeven respectively
3. December 8, 2021 strip pricing
2022 2023 2024 2025 2026
WTI (US$/bbl) $70.83 $66.98 $64.41 $62.83 $62.83
AECO ($/GJ) $3.23 $3.02 $2.91 $2.89 $2.89
Tamarack Forecast Pricing Inputs
FX 1.28 1.28 1.28 1.28 1.28
WCS Diff (US$/bbl) -$12.50 -$12.50 -$12.50 -$12.50 -$12.50
MSW Diff (US$/bbl) -$4.00 -$4.00 -$4.00 -$4.00 -$4.00
4. See “Oil and Gas Advisories – Drilling Locations”
5. Comprised of 12,000 bbl/d heavy oil
Page 9
1. See Disclaimers – “Non-IFRS Measures”; free funds flow and free funds breakeven were formerly referred to as free adjusted funds flow and free adjusted funds flow breakeven respectively
Page 11
1. See Disclaimers – “Non-IFRS Measures”; FFF – Free Funds Flow; free funds flow and free funds breakeven were formerly referred to as free adjusted funds flow and free adjusted funds flow breakeven respectively
Page 12
1. See Disclaimers – “Non-IFRS Measures”; free funds flow and free funds breakeven were formerly referred to as free adjusted funds flow and free adjusted funds flow breakeven respectively
32 w w w . t a m a r a c k v a l l e y. c a 32Notes
Page 13
1. See Disclaimers – “Non-IFRS Measures”; FFF – Free Funds Flow; AFF – Adjusted Funds Flow; D/AFF – Net debt to annual adjusted funds flow; free funds flow and free funds breakeven were formerly referred to as
free adjusted funds flow and free adjusted funds flow breakeven respectively
Page 14
1. At US$55/bbl WTI & $2.50/GJ AECO
2. Annual yield is calculated as (base dividend plus partial year special dividend where relevant) divided by current market capitalization including shares to be issued with the Crestwynd acquisition
Page 15
1. See Disclaimers – “Non-IFRS Measures”; FFF – Free Funds Flow; AFF – Adjusted Funds Flow; D/AFF – Net debt to annual adjusted funds flow; free funds flow and free funds breakeven were formerly referred to as
free adjusted funds flow and free adjusted funds flow breakeven respectively
2. Comprised of 18,000-19,000 bbl/d light and medium oil, 8,500-9,000 bbl/d heavy oil, 3,300-3,500 bbl/d NGL and 67,000-70,000 mcf/d natural gas
Page 16
1. See Disclaimers – “Non-IFRS Measures”; free funds flow was formerly referred to as free adjusted funds flow
2. See “Oil and Gas Advisories – Drilling Locations”
3. At US$55/bbl WTI & $2.50/GJ AECO flat pricing
Page 17
1. See Disclaimers – “Non-IFRS Measures”; FFF – Free Funds Flow; free funds flow was formerly referred to as free adjusted funds flow
Page 18
1. See Disclaimers – “Non-IFRS Measures”; free funds flow was formerly referred to as free adjusted funds flow
Page 19
1. Lateral length normalized to 3,000m, based on a 1:1 ratio of lateral length to well performance
2. Comprised of 6,550-7,200 bbl/d light and medium oil, 1,950-2,000 bbl/d NGL and 21,000-22,800 mcf/d natural gas
3. Well production is based on publicly reported production data and not sales information; the difference between the listed bopd and boe/d is comprised entirely of natural gas production
33 w w w . t a m a r a c k v a l l e y. c a 33Notes
Page 20
1. See “Oil and Gas Advisories”
Page 23
1. See “Oil and Gas Advisories”
2. Internal estimates and forward-looking Development Summary based on internal management projections
Page 25
1. ARO spend/inactive liability includes only net ARO spend (TVE funded and grant funded) during the period and excludes grants awarded to be spent in a future period
Page 27
1. See Disclaimers – “Non-IFRS Measures”; AFF – Adjusted Funds Flow; free funds flow and free funds breakeven were formerly referred to as free adjusted funds flow and free adjusted funds flow breakeven respectively
Page 29
1. See Disclaimers – “Non-IFRS Measures”; FFF – Free Funds Flow; TSR – Total Shareholder Return; PIR – Profit Investment Ratio; AFF – Adjusted Funds Flow; DAFFF – Debt Adjusted Free Funds Flow; free funds flow and free
funds breakeven were formerly referred to as free adjusted funds flow and free adjusted funds flow breakeven respectively
Page 30
1. As at January 10, 2021
2. Includes Crestwynd hedges which are summarized in the table below
Q1 2022 Q2 2022
Volume (bbls/d) 500
WTI fixed price
Average Fixed Price (CAD/bbl) $83.44
Volume (bbls/d) 1,000 500
WCS Diff
Average Fixed Price (CAD/bbl) ($16.23) ($14.85)
Volume (bbls/d) 250 500
WTI 2-way collar Def
Average Bought Put Price (CAD/bbl) $75.00 $75.00
Prem
Average Sold Call Price (CAD/bbl) $99.66 $96.01
34 w w w . t a m a r a c k v a l l e y. c a 34You can also read