Petrophysical core based zonation of OW oilfield in the Bredasdorp Basin South Africa - Nature
←
→
Page content transcription
If your browser does not render page correctly, please read the page content below

www.nature.com/scientificreports
OPEN Petrophysical core‑based zonation
of OW oilfield in the Bredasdorp
Basin South Africa
Mimonitu Opuwari*, Blessing Afolayan, Saeed Mohammed, Paschal Ogechukwu Amaechi,
Youmssi Bareja & Tapas Chatterjee
This study aims to generate rock units based on core permeability and porosity of OW oilfield in
the Bredasdorp Basin offshore South Africa. In this study, we identified and classified lithofacies
based on sedimentology reports in conjunction with well logs. Lucia’s petrophysical classification
method is used to classify rocks into three classes. Results revealed three lithofacies as A (sandstone,
coarse to medium-grained), B (fine to medium-grained sandstone), and C (carbonaceous claystone,
finely laminated with siltstone). Lithofacies A is the best reservoir quality and corresponds to class
1, while lithofacies B and C correspond to class 2 and 3, which are good and poor reservoir quality
rock, respectively. An integrated reservoir zonation for the rocks is based on four different zonation
methods (Flow Zone indicator (FZI), Winland r35, Hydraulic conductivity (HC), and Stratigraphy
modified Lorenz plot (SMLP)). Four flow zones Reservoir rock types (RRTs) were identified as
RRT1, RRT3, RRT4, and RRT5, respectively. The RRT5 is the best reservoir quality composed of a
megaporous rock unit, with an average FZI value between 5 and 10 µm, and HC from 40 to 120 mD/
v3, ranked as very good. The most prolific flow units (RRT5 and RRT4 zones) form more than 75% of
each well’s flow capacities are supplied by two flow units (FU1 and FU3). The RRT1 is the most reduced
rock quality composed of impervious and nanoporous rock. Quartz is the dominant framework grain,
and siderite is the dominant cement that affects flow zones. This study has demonstrated a robust
approach to delineate flow units in the OW oilfield. We have developed a useful regional petrophysical
reservoir rock flow zonation model for clastic reservoir sediments. This study has produced, for the
first time, insights into the petrophysical properties of the OW oilfield from the Bredasdorp Basin
South Africa, based on integration of core and mineralogy data. A novel sandstone reservoir zonation
classification criteria developed from this study can be applied to other datasets of sandstone
reservoirs with confidence.
Petrophysical reservoir characterization on reservoir scale or classification of the pore spaces based on pore throat
size distribution is a valuable tool in dividing pore types to explain uneven relationships between permeability
and porosity for different rock t ypes1,2. Porosity and permeability are the two properties that are important for
reservoir rock typing or zonation studies, which can be measured directly from the core. Furthermore, the core
analysis results in reservoirs produce valuable datasets regarded as the ground truth measurements used for the
calibration and conditioning of other petrophysical measurements such as well logs and s eismic3–7.
Many authors successfully apply core plug analysis results of porosity and permeability in carbonate and clas-
sic environments to quantify the reservoir flow and storage character and determine reservoir quality, e.g.8–13.
An integrated petrophysical reservoir characterization method that involves core, well logs, and sedimentology
helps to improve reservoir description by investigating various rock types that ultimately leads to an enhanced oil
recovery14–17. Several studies18–23 have reported that reservoir quality is controlled by the pore geometry, which
determines fluid movements. The changes from diagenetic processes could alter permeability, porosity, and
lithology within a reservoir that would produce zones with different reservoir properties. Therefore, reservoir
rock type classification or zonation and modelling is an essential method to explore in the oil field development
stage to investigate factors that influence variations in reservoir properties El Sharawy and Nabawy 2016, Opu-
wari et al. 2020, Nabawy et al. 2018.
The oil field investigated in this study is situated in the Bredasdorp Basin, which lies offshore on the southern
flank of South Africa. The Bredasdorp Basin holds a promising hydrocarbon prospect with several exploration,
Petroleum Geosciences Research Group, Earth Sciences Department, University of the Western Cape, 7535 Bellville,
Republic of South Africa. *email: mopuwari@uwc.ac.za
Scientific Reports | (2022) 12:510 | https://doi.org/10.1038/s41598-021-04447-6 1
Vol.:(0123456789)
www.nature.com/scientificreports/
Figure 1. Location map generated from Petrel 2018.2 software (https://usoftly.com/products/reservoir-engin
eering/schlumberger-petrel-2018-2-7), showing the study area, including the well locations offshore of South
Africa, modified after32.
development, appraisal, and production wells drilled over the years. The Lower Cretaceous age sediments have
been of primary exploration interest with renewed emphasis due to the recent hydrocarbon discoveries in com-
mercial quantities in the southern Outeniqua basin offshore, South Africa.
Despite the previous studies conducted on flow zonation in the Bredasdorp B asin24–26 for the western, central,
and northwestern parts of the Bredasdorp Basin, all the studies are targeted at the gas field in the Bredasdorp
Basin. Based on our knowledge, there is no published work regarding reservoir rock typing or flow zonation of an
oil field in the Bredasdorp Basin. Consequently, this work is focused on this important but neglected field. In this
study, we identified and classified lithofacies based on sedimentology reports in conjunction with well logs. We
used Lucia’s Petrophysical classification method to produce three different classes of rock. An integrated reservoir
zonation for the rocks is based on four different zonation methods (Flow Zone indicator (FZI), Winland r35,
Hydraulic conductivity (HC), and Stratigraphy modified Lorenz plot (SMLP). In addition, quantitative mineral-
ogy results from two wells are introduced to establish the effects of mineralogy on flow zones. The present study,
therefore, also aims to produce, for the first time, insights into the petrophysical properties of the OW oilfield
from the Bredasdorp Basin South Africa, based on integration of core and mineralogy data.
Geological overview
The Bredasdorp sub-basin is a passive marginal sub-basin (associated with syn-rift half-graben) located beneath
the Indian Ocean, covering approximately 18,000 k m2. It is arguably one of the largest producing hydrocarbon
Basins within Southern A frica27–30.
The study is located in the Bredasdorp Basin, part of the larger Outeniqua sub-basin off South Africa’s south
coast (Fig. 1). The Bredasdorp basin has been extensively explored and is well-known for its hydrocarbon poten-
tial. The majority of South Africa’s hydrocarbon discoveries and prospects have been identified in the Bredasdorp
Basin. The basin is bounded on the north-eastern part by the Infanta Arch, while the Columbine-Algulhas Arch
is on the western and southwestern s ides31,32. Four wells (OW1, OW2, OW3, and OW4) are used in this study,
indicated by the red text in Fig. 1.
The stratigraphic nomenclature of sedimentary successions for South Africa’s Offshore Basins is well docu-
mented. The sequences were numbered from 1 to 22 and alphabets based on major unconformities identified
on seismic s ections29,33 (Fig. 2).
According to30, Bredasdorp Basin sediments were derived from the erosion of the Cape Supergroup and
Karoo Supergroup’s sandstones and shales. The Cape supergroup sediments are made up of sequences from
shallow marine, transitional, and deep-sea environments. During the Cape orogeny, the Cape supergroup was
folded, generating the Cape fold belt, which extended offshore and on the coast of South Africa34. The Karoo
supergroup was deposited atop a retro arc foreland basin when subduction and erosion began29,35–37. From the
late Carboniferous through the early Jurassic period, the Karoo supergroup consisted of glacial, alluvial deltaic,
and marine deposits38. There was evidence of rifting on Eastern Gondwana after the erosion of the Karoo super-
group, and syn-rift half grabens a ppeared30.
Mature shale deposited in the deep marine within the Mid-Aptian age of 13At1 in the drift section serves as
the oil field’s primary source rock (Fig. 2).
Scientific Reports | (2022) 12:510 | https://doi.org/10.1038/s41598-021-04447-6 2
Vol:.(1234567890)
www.nature.com/scientificreports/
Figure 2. Stratigraphic nomenclature of sedimentary successions in South Africa’s Offshore Basins, modified
after29,32,33.
There are two major reservoirs in the Bredasdorp Basin. These reservoirs are shelf sandstones (syn-rift section)
and deep marine turbidite sandstones (drift section)32 Rahiam et al. 2019. The wells in the study area encountered
deep marine turbidite sandstones. The drift marine shales operate as the significant seals in the Bredasdorp basin.
Scientific Reports | (2022) 12:510 | https://doi.org/10.1038/s41598-021-04447-6 3
Vol.:(0123456789)
www.nature.com/scientificreports/
GR (api) Resistivity (Ohm m) Density (g/cc)
Lithofacies # points Mean Covariance factor Mean Covariance factor Mean Covariance factor
A 444 23.90 0.36 22.40 0.46 2.37 0.01
B 187 31.30 0.56 6.50 1.73 2.38 0.01
C 72 75.10 0.24 1.50 1.60 2.58 0.02
Table 1. Results of rock classification, clustering lithofacies into three groups.
The seal at the Syn-rift section is non-connecting faults in tilted form and faulted blocks. Both structural and
stratigraphic traps are present in the Bredasdorp Basin. Tilted fault blocks are common structural traps in the
syn-rift section, while stratigraphic traps are widespread within the drift s ection32,37.
Materials and methods
There are four wells available in the oilfield used for this study. Two cores were cut in well (OW1), with a total
of 33.24 m were recovered. The core consists of deep marine sandstone with claystone at the base. Two cores
were cut in well (OW2) with a 25.01 m recovery, while three cores were cut in well (OW3) with a total recovery
of 28.42 m, comprise mainly sandstone with occasional thin claystone interbed. Finally, three cores were cut
back to back in well (OW4) with a total recovery of 32.04 m. Routine core analyses, including helium porosity,
vertical and horizontal permeability, and grain density, were conducted at ambient condition on 371 core plugs
(108 for well OW1,64 for well OW2,89 for well OW3, and 110 for well OW4) that produced the porosity and
permeability data used for this study.
Conventional core analysis data (Porosity and Permeability) for all wells and mineralogical data were available
for two wells (OW2 and OW4). In addition, conventional well logs (gamma-ray, resistivity, density, and sonic)
were available for all the wells. The evaluation process commences with the classification of lithofacies through
to the delineation of reservoir zones.
In conjunction with the machine learning rock typing approach using well logs and Lucia’s Petrophysical
rock classification models, the Sedimentology report was adopted to group reservoir rocks into three distinct
lithofacies. Four different petrophysical rock typing methods (Hydraulic conductivity (HC), Winland r35 pore
throat radius Petrophysical Rock Type (PRT), Flow Zone Indicator (FZI), and Stratigraphy Modified Lorenz
Plot (SMLP) applied for grouping of reservoir rocks into flow zones. Explanation of the methods is discussed
in the result section.
Results and discussion
Lithofacies and Lucia’s petrophysical classification. Lithofacies. The sedimentology report indi-
cates that the wells’ sandstone reservoirs s are compositionally and texturally homogeneous; therefore, litho-
facies classification is possible. The sandstones are predominantly clean, very fine to coarse-grained, variably
sorted, slightly lithic, and very slightly carbonaceous32. Porosity reduction is influenced by quartz overgrowth,
with a minor amount of calcite infilling. The sandstones are occasionally silty.
The rock types classification into lithofacies was achieved by integrating well logs (gamma-ray, resistivity, and
density) and sedimentology reports. The sediments of the studied wells are mainly of deep marine depositional
environment. Therefore, a detailed core description of the sediments was obtained from sedimentology reports
and previous work in the studied wells that provided a geological classification framework based on texture
and grain size. As a result, three lithofacies were identified and subsequently grouped as lithofacies A, B, and C
from core description and sedimentology reports. Lithofacies A is a clean, massive channel sandstone, coarse to
medium grains; lithofacies B is fine to medium grains sandstone interbedded in places with siltstone, moderately
sorted. On the other hand, lithofacies C is carbonaceous claystone, finely laminated with siltstone32.
A machine learning rock classification algorithm using well logs (gamma-ray, density, and resistivity) from
IP.4.7 rock typing module was introduced in this study to group reservoir rocks into various clusters and integrate
results with core defined lithofacies. According t o39, clustering is the method and algorithm used to cluster or
group data according to measured or perceived characteristics and similarity40. Althogh machine learning has
shown to be reliable tool for lithofacies classification, applying a single model may not produce robust result,
hence the need to integrate it with discrete core data to improve the reliability and reduce uncertainities. We
performed environmental corrections on the logs to improve the results of the logs to remove underlying data
before maching learning operation. The results from cluster analysis for rock types are shown in Table 1 and
(Fig. 3). Overlying lithofacies (facies A and B) is identified in Fig. 3 due to discriminatory criteria in the well logs
used in Table 1. The number of sample points in the classification for each lithofacies is different, and such dif-
ferences may affect the performance of the machine learning clustering approach Liu et al. To remove the effect
and increase the reliability of the model, we integrated the results of the rock clustering method and compared
to lithofacies identification by manual core examination, and sedimentology results to consolidate lithofacies
rock classification as follows:
Lithofacies A. Lithofacies A is a massive sandstone, coarse to medium grains with an average gamma-ray value
of 24 API, resistivity of 22 ohmm, and density of 2.37 g/cc.
Scientific Reports | (2022) 12:510 | https://doi.org/10.1038/s41598-021-04447-6 4
Vol:.(1234567890)
www.nature.com/scientificreports/

                                 Figure 3.  Cluster analysis showing lithofacies identified in the wells from well logs.

                                 Lithofacies B. Represents fine to medium grains sandstone interbedded in places with siltstone, moderately
                                 sorted with an average gamma-ray value of 31 API, resistivity of 7 ohmm, and density of 2.38 g/cc.

                                 Lithofacies C. Carbonaceous claystone, finely laminated with siltstone with an average gamma-ray value of 75
                                 API, resistivity of 1.5 ohmm, and density of 2.58 g/cc.
                                    Lithofacies A is ranked as the best reservoir rock, followed by lithofacies B and C, respectively.

Scientific Reports |   (2022) 12:510 |                https://doi.org/10.1038/s41598-021-04447-6                                           5

                                                                                                                                      Vol.:(0123456789)
www.nature.com/scientificreports/
Figure 4. Lucia’s Petrophysical rock classification showing three classes of rock.
Lucia’s petrophysical classification. To determine the rock type in a reservoir, it is essential to understand the
primary rock properties, such as the mineralogy, texture, grain packing, and other parameters because they
influence the petrophysical properties of rocks10,12,13,17,41,42. Lucia’s Petrophysical rock classification is a technique
used to relate pore size distribution to rock fabric with laboratory measurements of porosity and permeability43.
Lucia’s classification method has been successfully applied to carbonate rocks in which the pores are categorized
into two broad categories: interparticle and vuggy. Rocks with interparticle pore spaces comprise three rock
classes grouped as class1, 2, and 3. The grouping of the rocks is based on texture, mud-dominated or grain-
dominated44.
Though Lucia’s Petrophysical classification method is mainly applied to carbonate rocks, we attempted this
method in this study to classify the rock types and also to establish the relationship between our data with the
standard Lucia’s classification by superimposing our data on the standard Lucia’s classification model developed
in the Interactive Petrophysics software package, IP.47. The results show that our data mostly clustered around
class 1 (Lithofacies A with permeability ranging from 50 to 1000 mD, and porosity from 15 to 22%), followed
by class 2 (Lithofacies B with permeability ranging from 1 to 50mD and porosity from 12 to 18%) and class 3
(Lithofacies C with a permeability of ≤ 1mD and porosity from 7 to 12%) presented in Fig. 4.
Generally, the best reservoir quality rock belongs to class1 sandstone with very good permeability and poros-
ity. On the other hand, the least reservoir quality rock belongs to class 3, which is Lithofacies C with low perme-
ability and fair porosity.
Reservoir rock type classification. Hydraulic flow unit. The concept of the hydraulic flow unit was
initially proposed from the Kozeny-Carmen equation of a capillary tube model for rock pore spaces, with a
key parameter in the method as the reservoir quality index (RQI), which is the average hydraulic radius in a
rock45–48. The input parameters for reservoir quality index (RQI) and flow Zone indicator (FZI) are core porosity
(Phi) and permeability (K) data that present the relationship below:
Rock quality index (RQI) = 0.0314 × Sqrt( K / Phi ) (1)
Pore - Grain volume ratio (PhiZ) = Phi/(1 − Phi) (2)
Flow Zone Indicator ( FZI) = RQI/PhiZ (3)
From a log–log plot of RQI against PhiZ, we can determine points of similar FZI characteristics of value
because they plot on a similar line with identical flow characteristics and identify flow zone boundaries. There-
fore, we first select flow unit boundaries based on points positioned on 45° lines with similar FZI values in the
analysis. Then, we create hydraulic flow units using the FZI boundaries. This method has been successfully
applied and documented by researchers in carbonate and clastic r eservoirs9,24,49.
Results present five flow units vertical boundary lines shown in the histogram of Fig. 5a, and the flow units
are calculated using the boundaries set in the flow units statistical Table 2, which resulted in five hydraulic flow
units HFU1, HFU2, HFU3, HFU4, and HFU5 shown in Fig. 5b. The boundaries using FZI indicate that HFU1
range from 0 to 1 micron, HFU 2 from 1 to 2 microns, HFU3 from 2 to 3 microns, and HFU 4 from 3 to 5 HFU
Scientific Reports | (2022) 12:510 | https://doi.org/10.1038/s41598-021-04447-6 6
Vol:.(1234567890)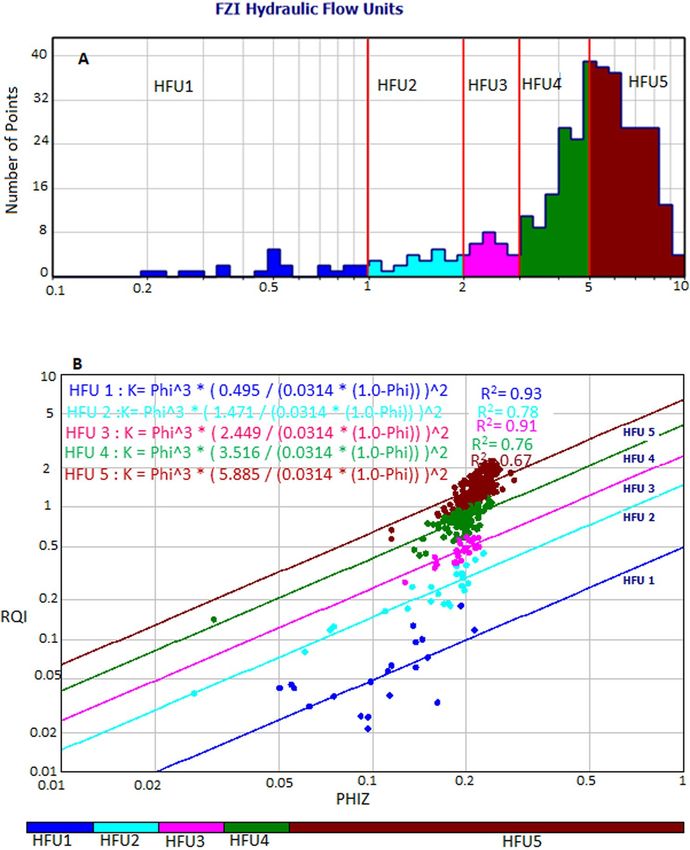
www.nature.com/scientificreports/

                                 Figure 5.  Results of flow zone indicator (a) Histogram of vertical boundary lines (red) showing boundaries
                                 of flow units (b) log–log plot of RQI versus normalized porosity (Phiz) showing five distinct flow units and
                                 respective relationships for the determination of permeability (K) from hydraulic flow unit. (c) Superimposition
                                 of RQI versus normalized porosity on Lucia’s plot.

Scientific Reports |   (2022) 12:510 |               https://doi.org/10.1038/s41598-021-04447-6                                                 7

                                                                                                                                           Vol.:(0123456789)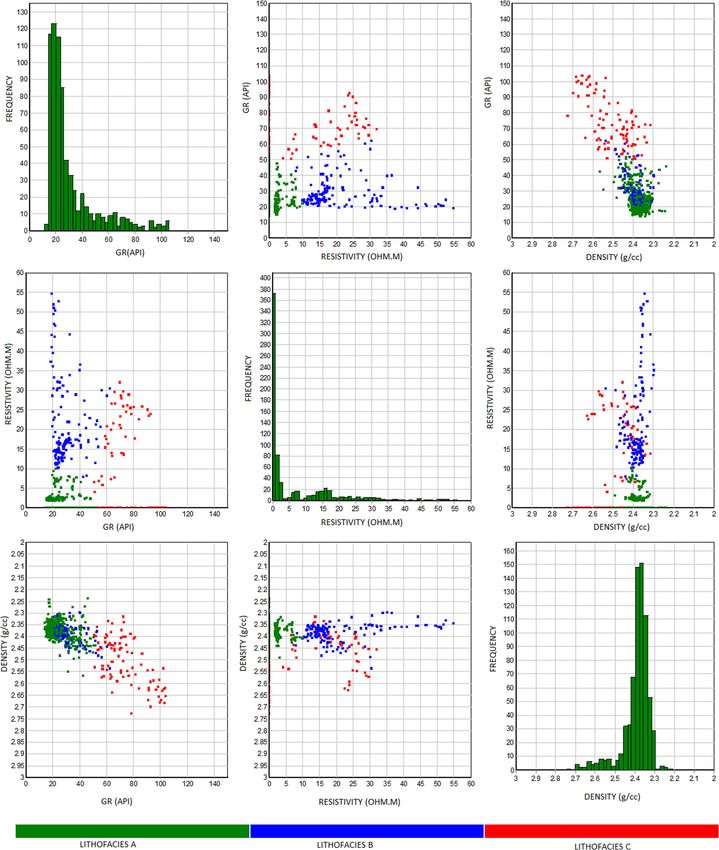
www.nature.com/scientificreports/
Figure 5. (continued)
5 from 5 to 10 microns. HFU5 presents the best reservoir rock quality with RQI ranging from 0.5 to 2.1 microns,
and the least reservoir rock flow unit is HFU with an RQI value ranging from 0.02 to 0.2 microns. To understand
the relationship between Lucia’s classes and HFUs, HFU from FZI was superimposed on the the Lucia’s plot
(Fig. 5c). Results reveal that HFU5 and HFU4 belong to class 1, HFU4, HFU3, andHFU2 belong to class2, while
HFU1 is represented by class 3.
Winland r35 rock typing model. Winland50 created a method for determining pore throat radius from core data
using core measurements of porosity and permeability data, published b y51. From the Winland r35 method, the
pore throat radius (r35), corresponding to the 35th percentile of mercury saturation (µm) could be calculated
on different data such as well logs and core provided they have porosity and permeability d ata15,51,52. From that
concept, Winland noted that large pores connected large crystals, and small pores connected small crystals.
Therefore, Winland indicated that if the intercrystalline pore system is filled by intergranular and solution pore,
the one that controls outflow and inflow into large pore is the smallest pore s ystem53. Winland’s correlation equa-
tion between pore sizes, porosity, and permeability published b y51 is shown in Eq. (4).
(4)
Winland r35 = Log 0.732 + 0.588 Log(K) − 0.864 Log(Phi)
where Phi is porosity (%) and K is air permeability in mD. From Eq. (4), rock typing can be done by calculating
the r35 value for each sample, classifying the sample with the same r35 value, and making an iso-pore throat
line in a graph. In this study, rock typing has been done for 371 plug samples from routine core analysis with
Winland r35 method. Our result was superimposed on the standard Winland r35 plot shown in Fig. 6a. From
the plot, we obtained distribution pore spaces, porosity, and permeability at iso-pore throat line that presents
five hydraulic flow units (HFU5 as mega pores ranging between 10 and 20 µm, HFU4 as macropores between
4 and 10 µm, HFU3 as mesopore between 2 and 4 µm, HFU2 as micropores ranges between 1 and 2 µm, and
HFU1 as nanopores less than 1 µm). The porosity/permeability function (K/Phi) was also introduced in Fig. 6b
to understand better the influence of porosity and permeability on pore throat size distribution and connectivity.
Applying the (K/Phi) plot indicates that higher reservoir quality is assigned to the mega pore rocks, whereas the
lowest is assigned to the nanopore rocks (Fig. 6b). Though the plot may successfully group the rocks, the influ-
ence of diagenesis and the lithology must be c onsidered20,54,55. Several empirical relationships were established
from the Winland r35 pore throat method to estimate permeability from porosity. To understand the relationship
between Lucia’s classes and HFUs, HFU was superimposed on the Lucia’s plot (Fig. 6c). Results reveal that HFU5
and HFU4 belong to class 1, HFU4, HFU3, andHFU2 belong to class2, while HFU1 is represented by class 3.
Scientific Reports | (2022) 12:510 | https://doi.org/10.1038/s41598-021-04447-6 8
Vol:.(1234567890)
www.nature.com/scientificreports/
Hydraulic conductivity (HFU) method. From HFU and in reference to56, reservoir quality index method, the
hydraulic conductivity method was d eveloped57 for sandstone reservoirs. This method was applied in this study
because we are working on sandstone reservoirs. The technique was developed b y58 to obtain a capillary model
for a porous medium from the relationship between permeability and porosity from Eq. (6): In this study, the
method developed by Scheidegger, 1957 was modified and called hydraulic reservoir unit (HRU) to replace
conductivity that best fits the purpose of the study.
Hydraulic Reservoir Unit (HRU) = Permeability/(1014 ∗ (Porosity)3 ) ∗ 0.1 (5)
In applying the hydraulic conductivity method, we first calculate HRU from each core sample using Eq. (5),
then cross plot of hydraulic conductivity against (Permeability/Porosity)0.5 and establish five different HRU’s
(Fig. 7). HRU5 ranges from 50 to 120; HRU4 from 20 to 50; HFU3 from 5 to 20; HRU2 from 1 to 5; and HRU1
less than 1. The best reservoir quality is HRU5, and the least reservoir rock quality is HRU1. An empirical power
relation was established to estimate hydraulic conductivity as follows:
Hydraulic Conductivity = 0.56 ∗ Log((Permeability/Porosity)0.5 )2.39 R2 = 0.91 (6)
SMLP method. Stratigraphic Modified Lorenz Plot (SMLP), a petrophysical-based method, was also used
in this study to identify hydraulic flow units within a sequence-stratigraphic framework59–61. This method is
applied through analysis of porosity and permeability to establish the vertical variation of flow (permeability
with the thickness, kh) and storage capacity (porosity with the thickness, Ph). The SMLP utilizes the cross plot of
cumulative flow and storage capacity values to determine flow units within a stratigraphic framework from base
to top of reservoir61,62. Significant inflection points on the SMLP are interpreted to represent changes in flow and
storage capacity flow unit. The interval of cumulative flow and storage capacity that slopes higher than 45° lines
on the plot is used to indicate high flow and low storage capacity; interval with a slope lower than the 45° lines
on the plot represents higher storage and low flow capacity, while those that plot around the 45° lines represents
an interval of equal flow and storage capacity.
SMLP was generated for our study using porosity and permeability values (Fig. 8). According to SMLP, four
flow units (FU1 to FU4) are recognized in well OW1(red line), OW2 (black line), OW3 (green line), and five flow
units (FU1 to FU5) are recognized for well OW4 (blue line) respectively. The Improved Stratigraphic Modified
Lorenz plot proposed by Maglio-Johnson 2000 and El Sawy et al. 2020 was integrated with SMLP to estimate
the contribution of individual flow units. As seen in Fig. 8, FU1 and FU3 contributes 91% of the flow capacity
of well OW1, while FU1, FU3, and FU4 supplied 96% of flow capacity for well OW2. In well OW3, 93% of flow
is supplied by FU1 and FU3, while in well OW4, FU1 and FU3 contributes to 94% of flow capacity. Generally,
FU1 and FU3 presents the best reservoir quality with a high flow unit in all the wells, whereas FU2 represents
the least reservoir quality and poor flow unit which are a barrier to flow.
Reservoir Zonation model. Integrating the lithofacies, Lucia’s Petrophysical rock classification model
with different reservoir characterization methods developed culminated into a new applicable reservoir zona-
tion scheme for the oil field presented in Table 2. We used an average value of the different reservoir zonation
methods to produce five distinct flow zones as reservoir rock types (RRTs), as RRT1, RRT2, RRT3, RRT4, and
RRT5, respectively. The RRT5 porosity and permeability values range from 18 to 22% and permeability from
200 to 1000 mD, with Winand r35 values ≥ l0 µm; FZI between 5 and 10 µm, HC between 50 and 120, which
corresponds to HFU5, where the highest and the best reservoir quality is detected. Therefore, it is ranked as very
good (Table 2). The RRT4 porosity and permeability values range from 12 to 18% and permeability from 50 to
200 mD, with Winand r35 values ranging from 4 to l0µm; FZI between 3 to 5 µm, HC between 20 and 50, which
corresponds to HFU4, ranked as good reservoir quality. RRT3 porosity and permeability values range from 14
to 18% and permeability from 10 to 50mD, with Winand r35 values ranging from 2 to 4 µm; FZI between 2 and
3 µm, HC between 5 to 20, which corresponds to HFU3, ranked as fair reservoir quality. RRT2 is not detected in
the studied samples. RRT1 is classified as an impervious reservoir rock with porosity and permeability values less
than 10% and 1.0 mD, respectively. Winand r35, FZI, and HC values are ≤ 1 µm for RRT1, which corresponds to
HFU1, with the least reservoir quality. We observed permeability variations at similar porosities in some flow
zones, attributed to pore type control on fluid flow. It has been reported previously that sandstone samples with
similar porosities can have different permeability resulting from the impact of diagenetic overprints on the pore
throat radius of sandstones63,64. Consequently, we used quantitative point-count mineralogy results of well OW3
and OW4 (Table 3) to determine mineral types and abundances in different zones that affect reservoir quality,
resulting in diagenetic effects on the pore throat radius.
The results indicated quartz as the dominant framework grain ranging in abundance from 52.3% to 82 wt%
(Table 3). Feldspar, lithics, and glauconite were all identified in varying proportions in the studied samples.
According to65,66, the main factors that influence the permeability and porosity of sandstone reservoirs are the clay
type and distribution, cementation, sandstone composition, hydrocarbon saturation, and compaction. Quartz
overgrowth and siderite are the predominant types of cement in the samples ranging from 7.9% to 18.8% and
Scientific Reports | (2022) 12:510 | https://doi.org/10.1038/s41598-021-04447-6 9
Vol.:(0123456789)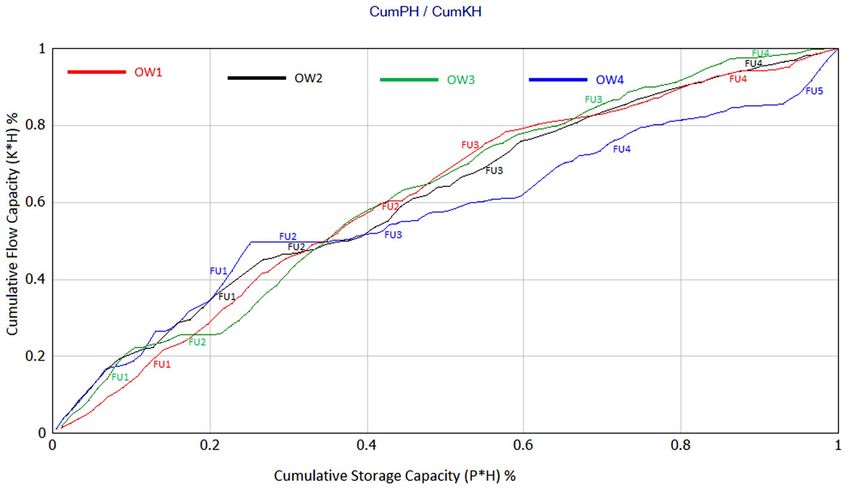
www.nature.com/scientificreports/
0.9% to 6.2 wt%, respectively. Dolomite is variable and minor pyrite is present in some samples as an alteration
and replacement product. Samples of high siderite content ≥ 2% belong to the RRT1 flow zone, while samples with
low siderite content ≤ 2% belong to the RRT3, RRT4, and RRT5 flow zones. The most abundant clay mineral is the
kaolinite ranging from 1% to 4.1%, and illite ranging from traces to 2.6%. The amount of cement (siderite) and
clay minerals (kaolinite and illite) increases in the RRT1 flow zone compared to other zones. Due to the coarse
nature of kaolinite and its position on the pore spaces and not in the pore throat, kaolinite is less destructive of
permeability than other clay minerals65,67. However, there appears to be a slight increase of illite, but the illite
fraction is not sufficient to differentiate the reservoir into different RRTs.
The results of integrating the four different methods (FZI, Winland r35, HC, SMLP) with lithofacies alongside
each other are presented in Figs. 9, 10, 11 and 12 for each well. In addition, detailed analyses of all rock types in
a zone are described in the following sections.
RRT5. The rocks are mainly coarse-grained sandstone (lithofacies A), and samples are, on average, moder-
ately to poorly sorted and belong to class 1 of Lucia’s Petrophysical classification. The RRT5’s have very good
petrophysical properties with porosity and permeability ranging from 18 to 22% and 200 mD to 1000 mD,
respectively (Table 2). The pore throat size is the best, with Winland r 35 greater than 10 µm and FZI in the range
between 5 and 10 µm, and HC between 50 and 120 mD/v3. The RRT5 is composed of HFU5 and ranked as a very
good reservoir quality rock. The RRT5 appears at the upper part of the reservoirs in the studied wells (Figs. 9,
10, 11 and 12) track 2. The content of framework grain is high (80% on average), and the average content of
quartz overgrowth is (10%), and siderite cement (≤ 1.3%) and illite clay mineral (≤ 0.5%) are low (Table 3). Seven
RRT5’s are identified in the wells. The best RRT5 is found in well OW1 (Fig. 9) with a thickness of 10 m and has
strong flow capacity, FU1 (60%), and storage capacity of 42%.
RRT4. The rocks are generally composed of lithofacies A (coarse-grained sandstone) and B (fine to medium-
grained sandstone) and belong to classes 1 and 2 of Lucia’s Petrophysical classification. The RRT4’s have good
petrophysical properties with porosity ranging from 12 to 18% and permeability from 50 to 200mD, respectively
(Table 2). The pore throat size is good with calculated Winland r 35 values range between 4 to10 µm, FZI in the
range between 3 to 5 µm, and HC between 20 and 50 mD/v3. The RRT4 is of HFU4 and ranked as a good reser-
voir quality rock. Seven RRT4’s are observed in the studied wells (Figs. 9, 10, 11 and 12) track 2. The best RRT4
is found in well OW2 (Fig. 10) with a thickness of 7.1 m, average porosity, and permeability of 16.7% and 16mD,
respectively. The content of framework grain is high (79% on average), and the average content of quartz over-
growth is (11.2%) and siderite cement (≤ 1.4%) and illite clay minerals (≤ 0.7%) are low (Table 3). Seven RRT4’s
contribute more than 26% flow and 58% storage capacities, mostly from FU3.
RRT3. The grain size of the RRT3 is mainly composed of lithofacies B (fine to medium sandstone) of class 2
of Lucia’s classification. Fair petrophysical properties are observed, with porosity ranging from 10 to 18% and
permeability from 20 to 50 mD, respectively. The calculated Winland r35 pore throat size values range between
2 and 4 µm, FZI between 2 and 3 µm, and HC between 5 and 20 mD/v3. The RRT3 is of HFU3 and ranked as a
fair reservoir quality rock. Two RRT’s are observed in well OWI (Fig. 9) and OW4 (Fig. 12) track 2. The RRT3
of well OW1 is bounded vertically at the top and bottom by RRT5. The RRT3 is interpreted to provide a lithofa-
cies A and lithofacies B contact that allows fluid flow between the high flow zones24,68, implying that the RRT5s
are in communication. The RRT3 is identified to have the same average permeability of 10mD but differ in their
average porosity values of 11.3% for well OW1 and 10.2% for well OW4, respectively. Comparison of calculated
petrophysical properties between the two wells showed that OW4 has better pore throat size values (r35 of
3.5 µm, an average FZI of 2.4 µm, and HC of 14 mD/v3) than that of well OW1 (r35 of 2.3 µm, an average FZI
of 2.1 µm, and HC of 6.0 mD/v3). The RRT3 is found in well OW2 (Fig. 10) with a thickness of 7.1 m, average
porosity, and permeability of 16.7% and 16mD, respectively. According to1,69, pore throat radius is related to
grain diameter, which explains why rocks of the same average permeability values may have different pore throat
radius due to differences in pore volume. An average quartz framework grain of 74% and the average content of
quartz overgrowth is (15.8%), and siderite cement (1.35%) and illite clay mineral (0.9%) are presented for RRT3
(Table 3). RRT3 contributes about 15% flow and 20% storage capacities, FU3 (well OW4 in Fig. 12).
RRT1. The essential characteristic of RRT1 is that it is predominantly composed of lithofacies C ( claystone,
finely laminated with siltstone) and corresponds to class 3 of Lucia’s classification. The petrophysical properties
(porosity, permeability, Winland r35, FZI, and HC) of the RRT1 are ≤ 1, as shown in Table 2. An average of 63%
quartz framework grain with a slight increase (1.3 to 5.8%) of carbonaceous material is indicated in this rock
type. The highest amount of cement (quartz overgrowth, 18.8%, siderite, 6.2%, pyrite, 2.6%) and clay minerals
(Kaolinite, 4.1% and illite, 2.6%) are indicated in the RRT1 samples (Table 3). The high amounts of cement and
clay minerals ultimately fill the pores, block the pores, and constrict the sandstone’s pore-throat, making the
throat small, leading to poor reservoir properties observed in RRT170. According t o70, lower permeability values,
Scientific Reports | (2022) 12:510 | https://doi.org/10.1038/s41598-021-04447-6 10
Vol:.(1234567890)www.nature.com/scientificreports/
Hydraulic
Top depth Bottom Thickness Permeability Conductivity
Well (m) depth (m) (m) Porosity % mD Zone/RRT r35 (μm) HFU Rock Type FZI (μm) Ranking mD/v3
18–22 200–1000 RRT5 > 10 5 Megaporous 5–10 Very Good 50–120
Macropo-
12–18 50–200 RRT4 4–10 4 3–5 Good 20–50
rous
10–18 10–50 RRT3 2–4 3 Mesoporous 2–3 Fair 5–20
10–14 1–10 RRT2 1–2 2 Microporous 1–2 Poor 1–5
< 10 < 1.0 RRT1www.nature.com/scientificreports/
Figure 6. (a) Winland r35 pore throat radius for the identification of rock types, showing five different rock
types from HFU 1 to HFU5. (b) Results of Winland r35 pore throat radius showing five different equations for
rock types. (c) Superimposition of Winland r35 results on Lucia’s plot.
Scientific Reports | (2022) 12:510 | https://doi.org/10.1038/s41598-021-04447-6 12
Vol:.(1234567890)www.nature.com/scientificreports/
Figure 6. (continued)
Figure 7. Cross plot of hydraulic conductivity against K/Phi indicating hydraulic reservoir units encountered in
the wells.
Scientific Reports | (2022) 12:510 | https://doi.org/10.1038/s41598-021-04447-6 13
Vol.:(0123456789)www.nature.com/scientificreports/
Figure 8. Stratigraphic modified Lorenz plots (SMPLs) for the studied wells showing different flow units (FUs).
Framework Grain Cements Clay
Quartz
Sample Feldspar Glauconite Carbonaceous overgrowth Dolomite Kaolinite
Well Zone/RRT depth m Quartz % % Lithics % % % % % Siderite % Pyrite % % Illite %
OW3 RRT5 2613.0 81.8 3.0 3.1 1.3 – 7.9 – 1.3 – 1.6 –
OW3 RRT5 2620.2 80.5 2.0 2.5 0.3 – 11.4 – 1.0 – 1.8 0.5
OW3 RRT4 2625.7 80.0 2.0 1.5 1.0 – 10.9 – 1.4 0.5 2.0 0.2
OW3 RRT4 2634.8 77.8 2.5 2.0 1.7 – 12.1 – 0.7 2.5 0.7
OW4 RRT5 2615.4 79.7 2.3 2.8 1.8 Traces 10.6 1 1 0.5 Traces 0.3
OW4 RRT4 2615.7 79.8 2.9 6.2 1.3 Traces 7.9 0.3 0.3 – 1.3 –
OW4 RRT4 2616 77.6 3 3 2 0.3 10.3 1 1 0.5 1 0.3
OW4 RRT1 2617.3 52.3 3.2 1.1 2.2 5.8 18.8 1.1 6.2 2.6 4.1 2.6
OW4 RRT1 2622.7 65.1 3.7 3.5 1 1.3 18.2 0.9 2.2 0.4 1.7 2
OW4 RRT3 2624.9 72.0 0.8 3 1 1 16.8 0.5 1.8 0.3 1.5 1.3
OW4 RRT3 2625.4 76.7 0.9 2.3 – 1.2 14.9 0.7 0.9 0.5 1.4 0.5
OW4 RRT4 2641.8 82 2.4 0.5 – – 14.6 0.5 – – Traces Traces
Table 3. Result of quantitative mineralogical analysis of wells OW3 and OW4 indicating the dominant cement
and clay that affects flow zones.
is high (80% on average), and the average content of quartz overgrowth is (10%) and siderite cement (≤ 1.3%),
and illite (≤ 0.5%). The RRT5 is composed of HFU5, has a strong flow capacity, FU1 (60%), and storage capacity
of 42%. The second best reservoir quality was the RRT4, composed of lithofacies A (coarse-grained sandstone)
and B (fine to medium-grained sandstone), belonging to classes 1 and 2 of Lucia’s Petrophysical classification.
The RRT4’s has good petrophysical properties with porosity ranging from 12 to 18% and permeability from 50
to 200mD. The pore throat size is good with calculated Winland r 35 values range between 4 and 10 µm, FZI in
the range between 3 and 5 µm, and HC between 20 and 50 mD/v3. The RRT3 is mainly composed of lithofacies
Scientific Reports | (2022) 12:510 | https://doi.org/10.1038/s41598-021-04447-6 14
Vol:.(1234567890)www.nature.com/scientificreports/
Figure 9. Shows the results for well OW1. Track 1 shows the measured depth. Displayed in tracks 2–9 are
flow zones, Gamma ray log, lithofacies, porosity, permeability, Winand r35, Flow zone indicator, and hydraulic
conductivity.
Figure 10. Shows the results for well OW2. Track 1 shows the measured depth. Displayed in tracks 2–9 are
flow zones, Gamma ray log, lithofacies, porosity, permeability, Winand r35, Flow zone indicator, and hydraulic
conductivity.
Scientific Reports | (2022) 12:510 | https://doi.org/10.1038/s41598-021-04447-6 15
Vol.:(0123456789)www.nature.com/scientificreports/
Figure 11. Shows the results for well OW3. Track 1 shows the measured depth. Displayed in tracks 2–9 are
flow zones, Gamma ray log, lithofacies, porosity, permeability, Winand r35, Flow zone indicator, and hydraulic
conductivity.
B (fine to medium sandstone) of class 2 of Lucia’s classification with fair petrophysical properties. The RRT3
provides contact that allows fluid flow between RRT5s and contributes about 15% flow and 20% storage capaci-
ties, FU3. RRT1 has the least reservoir quality, and it is predominantly composed of lithofacies C (claystone,
finely laminated with siltstone) and corresponds to class 3 of Lucia’s classification. The highest amount of cement
(quartz overgrowth, 18.8%, siderite, 6.2%, pyrite, 2.6%) and clay minerals (Kaolinite, 4.1% and illite, 2.6%) are
indicated in the RRT1 samples. The high concentration of the cement and clay minerals ultimately fills the pores;
it blocks the sandstone’s pore-throat, making the throat small, leading to poor reservoir properties observed in
RRT1 intervals.
It can be concluded that petrophysical characterization of the sandstone reservoirs of the OW oilfield has been
achieved with good agreement to classify the sandstone and flow zones. This may indicate that the classification
criteria can be confidently applied to other sandstone reservoirs in the basin. The present study, therefore, has
produced for the first time, insights into the petrophysical properties of the OW oilfield from the Bredasdorp
Basin South Africa, based on integration of core and mineralogy data.
Scientific Reports | (2022) 12:510 | https://doi.org/10.1038/s41598-021-04447-6 16
Vol:.(1234567890)www.nature.com/scientificreports/
Figure 12. Shows the results for well OW4. Track 1 shows the measured depth. Displayed in tracks 2–9 are
flow zones, Gamma ray log, lithofacies, porosity, permeability, Winand r35, Flow zone indicator, and hydraulic
conductivity.
Received: 30 August 2021; Accepted: 17 December 2021
References
1. Revil, A. & Cathles Iii, L. M. Permeability of shaly sands. Water Resour. Res. 35, 651–662 (1999).
2. Lala, A. M. S. & El-Sayed, N. A. Controls of pore throat radius distribution on permeability. J. Pet. Sci. Eng. 157, 941–950 (2017).
3. Spears, R. W. et al. Shale gas core analysis: Strategies for normalizing between laboratories and a clear need for standard materials.
In SPWLA 52nd Annual Logging Symposium (OnePetro, 2011).
4. Blount, A., McMullen, A., Durand, M., Croft, T. & Driskill, B. Maintaining and reconstructing in-situ saturations: A comparison
between whole core, sidewall core, and pressurized sidewall core in the Permian basin. In SPWLA 59th Annual Logging Symposium
(OnePetro, 2018).
5. Ma, S. M. & Amabeoku, M. Core analysis with emphasis on carbonate rocks—quality assurance and control for accuracy and
representativeness. Interpretation 3, SA91–SA106 (2015).
6. Opuwari, M. Petrophysical Evaluation of the Albian Age Gas Bearing Sandstone Reservoirs of the OM field, Orange basin, South
Africa. (University of the Western Cape, 2010).
7. Male, F. & Duncan, I. J. Lessons for machine learning from the analysis of porosity-permeability transforms for carbonate reservoirs.
J. Pet. Sci. Eng. 187, 106825 (2020).
8. Nabawy, B. S. Impacts of the pore-and petro-fabrics on porosity exponent and lithology factor of Archie’s equation for carbonate
rocks. J. Afr. Earth Sci. 108, 101–114 (2015).
9. Radwan, A. E., Nabawy, B. S., Kassem, A. A. & Hussein, W. S. Implementation of rock typing on waterflooding process during
secondary recovery in oil reservoirs: A case study, El Morgan Oil Field, Gulf of Suez, Egypt. Nat. Resour. Res. 30, 1667–1696 (2021).
10. El Sharawy, M. S. & Nabawy, B. S. Integration of electrofacies and hydraulic flow units to delineate reservoir quality in uncored
reservoirs: A case study, Nubia Sandstone Reservoir, Gulf of Suez, Egypt. Nat. Resour. Res. 28, 1587–1608 (2019).
11. Tiab, D. & Donaldson, E. Petrophysics: Theory and Practice of Measuring Reservoir Rock and Fluid Transport Properties 205–220
(Gulf Publ. Co., 1996).
Scientific Reports | (2022) 12:510 | https://doi.org/10.1038/s41598-021-04447-6 17
Vol.:(0123456789)www.nature.com/scientificreports/
12. Daraei, M., Bayet-Goll, A. & Ansari, M. An integrated reservoir zonation in sequence stratigraphic framework: A case from the
Dezful Embayment, Zagros, Iran. J. Pet. Sci. Eng. 154, 389–404 (2017).
13. Opuwari, M., Bialik, O. M., Taha, N. & Waldmann, N. D. The role of detrital components in the petrophysical parameters of
Paleogene calcareous-dominated hemipelagic deposits. Arab. J. Geosci. 14, 1–13 (2021).
14. Archie, G. E. Introduction to petrophysics of reservoir rocks. AAPG Bull. 34, 943–961 (1950).
15. Hearn, C. L., Ebanks, Wj., Tye, R. S. & Ranganathan, V. Geological factors influencing reservoir performance of the Hartzog Draw
Field, Wyoming. J. Pet. Technol. 36, 1335–1344 (1984).
16. Martin, A. J., Solomon, S. T. & Hartmann, D. J. Characterization of petrophysical flow units in carbonate reservoirs. AAPG Bull.
81, 734–759 (1997).
17. Magoba, M. & Opuwari, M. Petrophysical interpretation and fluid substitution modelling of the upper shallow marine sandstone
reservoirs in the Bredasdorp Basin, offshore South Africa. J. Pet. Explor. Prod. Technol. 10, 783–803 (2020).
18. Rahimpour-Bonab, H. A procedure for appraisal of a hydrocarbon reservoir continuity and quantification of its heterogeneity. J.
Pet. Sci. Eng. 58, 1–12 (2007).
19. Rahimpour-Bonab, H., Asadi-Eskandari, A. & Sonei, A. Control of Permian-Triassic Boundary over reservoir characteristics of South
Pars Gas Field. (Wiley, 2009).
20. Samakinde, C., Opuwari, M. & van Bever Donker, J. M. The effects of clay diagenesis on petrophysical properties of the lower
Cretaceous sandstone reservoirs, Orange Basin, South Africa. S. Afr. J. Geol. 119, 187–202 (2016).
21. Baron, M. et al. Evolution of hydrocarbon migration style in a fractured reservoir deduced from fluid inclusion data, Clair Field,
west of Shetland, UK. Mar. Pet. Geol. 25, 153–172 (2008).
22. Cerepi, A., Barde, J.-P. & Labat, N. High-resolution characterization and integrated study of a reservoir formation: The danian
carbonate platform in the Aquitaine Basin (France). Mar. Pet. Geol. 20, 1161–1183 (2003).
23. Tavakoli, V., Rahimpour-Bonab, H. & Esrafili-Dizaji, B. Diagenetic controlled reservoir quality of South Pars gas field, an integrated
approach. C.R. Geosci. 343, 55–71 (2011).
24. Opuwari, M., Mohammed, S. & Ile, C. Determination of reservoir flow units from core data: A case study of the lower cretaceous
sandstone reservoirs, Western Bredasdorp Basin Offshore in South Africa. Nat. Resour. Res. 30, 411–430 (2021).
25. Opuwari, M. & Dominick, N. Sandstone reservoir zonation of the north-western Bredasdorp Basin South Africa using core data.
J. Appl. Geophys. 193, 104425 (2021).
26. Opuwari, M., Magoba, M., Dominick, N. & Waldmann, N. Delineation of Sandstone Reservoir Flow Zones in the Central Bred-
asdorp Basin, South Africa, Using Core Samples. Nat. Resour. Res. 1–22 (2021).
27. Davies, C. P. Unusual biomarker maturation ratio changes through the oil window, a consequence of varied thermal history. Org.
Geochem. 27, 537–560 (1997).
28. Burden, P. L. & Davies, C. P. South Africa offshore EXP. II: Oribi field is South Africa’s first offshore crude oil production. Oil Gas
J. 95, 63–65 (1997).
29. Elliott, T. et al. Sequence Stratigraphy in Offshore South African Divergent Basins. An Atlas on Exploration for Cretaceous Low-
stand Traps by Soekor (Pty) Ltd. AAPG Studies in Geology Series no. 41. vii+ 184 pp.(very large format: 11$\times$ 24 inches,
28$\times$ 61 cm). Tulsa: American Association of Petroleum Geologists. Price US 59.00 for AAPG members); paperback. ISBN
0 89181 049 8. Geol. Mag. 134, 121–142 (1997).
30. McMillan, I. K., Brink, G. I., Broad, D. S. & Maier, J. J. Late Mesozoic sedimentary basins off the south coast of South Africa. In
Sedimentary Basins of the World 319–376 (Elsevier, 1997).
31. Megner-Allogo, A.-C. Sedimentology and stratigraphy of deep-water reservoirs in the 9A to 14A Sequences of the central Bredasdorp
Basin, offshore South Africa (Stellenbosch University, 2006).
32. Petroleum Agency of South Africa, P. A. S.A. Petroleum exploration information and opportunities. Petroleum Agency South Africa
Report 44 (2003).
33. Brown Jr, L. F. et al. SG41: Sequence Stratigraphy in Offshore South African Divergent Basins-Front Matter. (1995).
34. Hälbich, I. W., Fitch, F. J. & Miller, J. A. Dating the Cape orogeny. In Geodynamics of the Cape Fold Belt (1983).
35. Dingle, R. V., Siesser, W. G. & Newton, A. R. Mesozoic and Tertiary Geology of Southern Africa. (AA Balkema, 1983).
36. Broad, D. S., Jungslager, E. H. A., McLachlan, I. R. & Roux, J. Offshore mesozoic basins. Geol. S. Afr. 553, 571 (2006).
37. Jungslager, E. H. Petroleum habitats of the Atlantic margin of South Africa. Geol. Soc. Lond. Spec. Publ. 153, 153–168 (1999).
38. Smith, R. M. Alluvial paleosols and pedofacies sequences in the Permian Lower Beaufort of the southwestern Karoo Basin, South
Africa. J. Sediment. Res. 60, 258–276 (1990).
39. Jain, A. K. Data clustering: 50 years beyond K-means. Pattern Recogn. Lett. 31, 651–666 (2010).
40. Compan, A. L., Bodstein, G. C. & Couto, P. A relative permeability rock-typing methodology with a clustering method combined
with a heuristic optimization procedure. SPE J. 21, 1899–1915 (2016).
41. Ahr, W. M. Geology of Carbonate Reservoirs: The Identification, Description and Characterization of Hydrocarbon Reservoirs in
Carbonate rocks. (Wiley, 2011).
42. Ebanks W. J. Flow unit concept-integrated approach to reservoir description for engineering projects. AAPG Bull. 71 (1987).
43. Lucia, F. J. Petrophysical parameters estimated from visual descriptions of carbonate rocks: A field classification of carbonate pore
space. J. Petrol. Technol. 35, 629–637 (1983).
44. Lucia, F. J. Rock-fabric/petrophysical classification of carbonate pore space for reservoir characterization. AAPG Bull. 79, 1275–1300
(1995).
45. Amaefule, J. O., Altunbay, M., Tiab, D., Kersey, D. G. & Keelan, D. K. Enhanced reservoir description: Using core and log data to
identify hydraulic (flow) units and predict permeability in uncored intervals/wells. In SPE annual technical conference and exhibi-
tion (OnePetro, 1993).
46. Abbaszadeh, M., Fujii, H. & Fujimoto, F. Permeability prediction by hydraulic flow units-theory and applications, SPE 30158. In
Proceedings of SPE Petrovietnam Conference (1995).
47. Perez, H. H., Datta-Gupta, A. & Mishra, S. The role of electrofacies, lithofacies, and hydraulic flow units in permeability predictions
from well logs: A comparative analysis using classification trees. In SPE Annual Technical Conference and Exhibition (OnePetro,
2003).
48. Kadkhodaie-Ilkhchi, R., Rezaee, R., Moussavi-Harami, R. & Kadkhodaie-Ilkhchi, A. Analysis of the reservoir electrofacies in the
framework of hydraulic flow units in the Whicher Range Field, Perth Basin, Western Australia. J. Pet. Sci. Eng. 111, 106–120 (2013).
49. Nabawy, B. S. & Al-Azazi, N. A. Reservoir zonation and discrimination using the routine core analyses data: The upper Jurassic
Sab’atayn sandstones as a case study, Sab’atayn basin, Yemen. Arab. J. Geosci. 8, 5511–5530 (2015).
50. Winland, H. D. Oil accumulation in response to pore size changes, Weyburn field, Saskatchewan. Amoco Production Research
Report No. F72-G25 (1972).
51. Kolodzie, S. Analysis of pore throat size and use of the Waxman-Smits equation to determine OOIP in Spindle Field, Colorado.
In SPE Annual Technical Conference and Exhibition (OnePetro, 1980).
52. Porras, J. C., Barbato, R. & Khazen, L. Reservoir flow units: A comparison between three different models in the Santa Barbara and
Pirital fields, North Monagas Area, Eastern Venezuela Basin. in Latin American and Caribbean petroleum engineering conference
(OnePetro, 1999).
Scientific Reports | (2022) 12:510 | https://doi.org/10.1038/s41598-021-04447-6 18
Vol:.(1234567890)www.nature.com/scientificreports/
53. Palabiran, M., Sesilia, N. & Akbar, M. N. A. An analysis of rock typing methods in carbonate rocks for better carbonate reservoir
characterization: A case study of Minahaki Carbonate Formation, Banggai Sula Basin, Central Sulawesi. In 41th Scientific Annual
Meeting of Indonesian Association of Geophysicists (Pit Hagi) Lampung,(Aip Conference Proceedings) (2016).
54. Abuamarah, B. A. & Nabawy, B. S. A proposed classification for the reservoir quality assessment of hydrocarbon-bearing sandstone
and carbonate reservoirs: A correlative study based on different assessment petrophysical procedures. J. Nat. Gas Sci. Eng. 88,
103807 (2021).
55. Opuwari, M., Kaushalendra, B. T. & Momoh, A. Sandstone reservoir zonation using conventional core data: A case study of lower
cretaceous sandstones, Orange Basin, South Africa. J. Afr. Earth Sc. 153, 54–66 (2019).
56. Leverett, M. Capillary behavior in porous solids. Trans. AIME 142, 152–169 (1941).
57. Permadi, P. & Susilo, A. An investigation of the interrelation among pore throat, surface area, permeability, and NMR log data.
Final Study Report of ITB (2004).
58. Scheidegger, A. E. On the theory of flow of miscible phases in porous media. International Union of Geodesy and Geophysics in
Toronto (1957).
59. Gunter, G. W., Finneran, J. M., Hartmann, D. J. & Miller, J. D. Early determination of reservoir flow units using an integrated
petrophysical method. In SPE annual technical conference and exhibition (OnePetro, 1997).
60. Slatt, R. M. & Hopkins, G. L. Scaling geologic reservoir description to engineering needs. J. Pet. Technol. 42, 202–210 (1990).
61. Pranter, M. J., Hurley, N. F. & Davis, T. L. Sequence-Stratigraphic, Petrophysical, and Multicomponent Seismic Analysis of a Shelf-
margin Reservoir (San Andres Formation (Permian), 2004).
62. Craig, F. F. The Reservoir Engineering Aspects of Waterflooding: Society of Petroleum Engineers, Monograph volume 3 of the
Henry L. Doherty Series (1993).
63. Yarmohammadi, S., Kadkhodaie-Ilkhchi, A., Rahimpour-Bonab, H. & Shirzadi, A. Seismic reservoir characterization of a deep
water sandstone reservoir using hydraulic and electrical flow units: A case study from the Shah Deniz gas field, the South Caspian
Sea. J. Pet. Sci. Eng. 118, 52–60 (2014).
64. Lai, J. et al. A review on pore structure characterization in tight sandstones. Earth Sci. Rev. 177, 436–457 (2018).
65. Worden, R. H. & Morad, S. Clay minerals in sandstones: Controls on formation, distribution and evolution. In Clay Mineral
Cements in Sandstones 1–41 (Blckwell Publishing, 1999).
66. Worden, R. H. & Burley, S. D. Sandstone Diagenesis: Recent and Ancient (Blackwell, 2003).
67. Kamal, M. S., Mahmoud, M., Hanfi, M., Elkatatny, S. & Hussein, I. Clay minerals damage quantification in sandstone rocks using
core flooding and NMR. J. Pet. Explor. Prod. Technol. 9, 593–603 (2019).
68. Larue, D. K. & Legarre, H. Flow units, connectivity, and reservoir characterization in a wave-dominated deltaic reservoir: Meren
reservoir, Nigeria. AAPG Bull. 88, 303–324 (2004).
69. Lala, A. M. S. & Lala, H. M. S. Study on the improving method for gas production prediction in tight clastic reservoir. Arab. J.
Geosci. 10, 1–8 (2017).
70. Wang, W. et al. Pore-throat characteristics of tight sandstone reservoirs composed of gravity flow sediments: Yingcheng Formation,
Longfengshan sag, China. J. Petrol. Sci. Eng. 171, 646–661 (2018).
Acknowledgements
The authors are very grateful to the Petroleum Agency of South Africa, PASA, for providing the data and samples
used in this study. Many thanks are also extended to Synergy LR company for giving us access to Interactive
Petrophysics software (IP 4.7) used to analyse and process our data. The authors are grateful to the language
editors for their contribution to improving the manuscript. Many thanks and appreciations are also extended to
the Editor in Chief and anonymous reviewers.
Author contributions
M.O. conceptualize and wrote the main manuscript text.B.A. and S.M. edited the figures and reviewed the
manuscript.P.O.A., Y.B., and T.C. worked on the tables and reviewed the manucript.
Competing interests
The authors declare no competing interests.
Additional information
Correspondence and requests for materials should be addressed to M.O.
Reprints and permissions information is available at www.nature.com/reprints.
Publisher’s note Springer Nature remains neutral with regard to jurisdictional claims in published maps and
institutional affiliations.
Open Access This article is licensed under a Creative Commons Attribution 4.0 International
License, which permits use, sharing, adaptation, distribution and reproduction in any medium or
format, as long as you give appropriate credit to the original author(s) and the source, provide a link to the
Creative Commons licence, and indicate if changes were made. The images or other third party material in this
article are included in the article’s Creative Commons licence, unless indicated otherwise in a credit line to the
material. If material is not included in the article’s Creative Commons licence and your intended use is not
permitted by statutory regulation or exceeds the permitted use, you will need to obtain permission directly from
the copyright holder. To view a copy of this licence, visit http://creativecommons.org/licenses/by/4.0/.
© The Author(s) 2022
Scientific Reports | (2022) 12:510 | https://doi.org/10.1038/s41598-021-04447-6 19
Vol.:(0123456789)You can also read