Creating Sustainable Value - July 2021 - Tamarack Valley Energy

Page created by Leslie Estrada
 
CONTINUE READING
Creating Sustainable Value - July 2021 - Tamarack Valley Energy
TVE : TSX

                                                          Creating Sustainable Value

July 2021
See Disclaimers and Forward-Looking Statements attached
Creating Sustainable Value - July 2021 - Tamarack Valley Energy
Disclaimers
    Forward Looking Statements: Certain information included in this presentation constitutes forward-looking information under applicable securities legislation. Forward-looking information typically contains statements with words such as “anticipate”, “believe”, “expect”,
    “plan”, “intend”, “estimate”, “propose”, “project” or similar words suggesting future outcomes or statements regarding an outlook. Forward-looking information in this presentation may include, but is not limited to, statements about: our corporate strategy, objectives, strength,
    focus and five year plan; the development of the Company’s significant position in the Charlie Lake area through the acquisition of Anegada Oil Corp.; Tamarack’s commitment to ESG principles and Indigenous relationships, including as disclosed in the Company’s 2020
    Sustainability Report; Tamarack’s liquidity and financial position, the factors contributing thereto, the impact thereof and plans relating thereto; and Tamarack’s updated 2021 capital budget and guidance, including the timing and level capital expenditures; future production
    levels, including annual average production; oil and liquids weighting and changes thereto; development opportunities; drilling locations; economics and payouts of our wells; corporate decline rate; hedging positions and targets; future waterflood plans, outlook, estimates
    and forecasts; future land and seismic investments; additional consolidation opportunities in 2021; and future commodity prices and exchange rates. Statements relating to “reserves” are also deemed to be forward looking statements, as they involve the implied
    assessment, based on certain estimates and assumptions, that the reserves described exist in the quantities predicted or estimated and that the reserves can be profitably produced in the future.

    Forward-looking information is based on a number of factors and assumptions concerning Tamarack and the assets acquired pursuant to acquisitions which have been used to develop such information, but which may prove to be incorrect. In addition to other factors and
    assumptions which may be identified in this presentation, assumptions have been made regarding and are implicit in, among other things, the success of future drilling, development and completion activities, the performance of existing wells, the performance of new wells,
    the performance of enhanced oil recovery projects, the availability and performance of facilities and pipelines, the geological characteristics of Tamarack’s properties, including the assets acquired pursuant to acquisitions, the successful application of drilling, completion
    and seismic technology, prevailing weather and break-up conditions and access to our drilling locations, commodity prices, price volatility, price differentials and the actual prices received for the Company’s products, royalty regimes and exchange rates, the application of
    regulatory and licensing requirements, the availability of capital, labour and services, our ability to complete planned capital expenditures within budgeted cost estimates, the ability to market our and gas successfully, our ability to integrate assets and employees acquired
    through acquisitions, the creditworthiness of industry partners and our ability to acquire additional assets. Readers are cautioned that the foregoing list is not exhaustive of all factors and assumptions which have been used.

    Although Tamarack believes that the expectations and assumptions on which the forward-looking statements are based are reasonable, undue reliance should not be placed on the forward-looking statements because Tamarack can give no assurance that they will prove
    to be correct. Since forward-looking statements address future events and conditions, by their very nature they involve inherent risks and uncertainties. Actual results could differ materially from those currently anticipated due to a number of factors and risks. These include,
    but are not limited to, risks associated with the oil and gas industry in general (e.g., operational risks in development, exploration and production; delays or changes in plans with respect to exploration or development projects or capital expenditures; the uncertainty of
    reserve estimates; the uncertainty of estimates and projections relating to production, costs and expenses, and health, safety and environmental risks), incorrect assessment of the value of acquisitions, failure to realize the benefits of acquisitions, constraint in the
    availability of services, commodity price and exchange rate fluctuations, changes in legislation (including but not limited to tax laws, royalty regimes and environmental legislation), adverse weather or break-up conditions and uncertainties resulting from potential delays or
    changes in plans with respect to exploration or development projects or capital expenditures. Production forecasts are directly impacted by commodity prices and the actual timing of our capital expenditures. Actual results may vary materially from forecasts due to
    changes in interest rates, oil differentials, exchange rates and the timing of expenditures and production additions. In addition, the Company cautions that current global uncertainty with respect to the spread of the COVID-19 virus and its effect on the broader global
    economy may have a significant negative effect on the Company. While the precise impact of the COVID-19 virus on the Company remains unknown, rapid spread of the COVID-19 virus may continue to have a material adverse effect on global economic activity, and may
    continue to result in volatility and disruption to global supply chains, operations, mobility of people and the financial markets, which could affect interest rates, credit ratings, credit risk, inflation, business, financial conditions, results of operations and other factors relevant to
    the Company. These and other risks are set out in more detail in Tamarack’s annual information form for the year ended December 31, 2020 (the “AIF”) and Tamarack’s management’s discussion and analysis for the period ended June 30, 2021 (the “MD&A”) . The AIF
    and MD&A can be accessed on Tamarack’s website at www.tamarackvalley.ca or under Tamarack’s profile on www.sedar.com.
    Forward-looking information is based on current expectations, estimates and projections that involve a number of risks and uncertainties which could cause actual results to differ materially from those anticipated by the proposed management and described in the forward-
    looking information. The forward-looking information contained in this presentation is made as of the date hereof and the proposed management undertakes no obligation to update publicly or revise any forward-looking information, whether as a result of new information,
    future events or otherwise, unless required by applicable securities laws. The forward-looking information contained in this presentation is expressly qualified by this cautionary statement.

    FOFI Disclosure: This presentation contains future-oriented financial information and financial outlook information (collectively, “FOFI”) about Tamarack’s prospective results of operations and production, debt, net debt, cash flow, adjusted funds flow, free adjusted funds
    flow breakeven, half-cycle returns, long-term free adjusted funds flow growth, balance sheet strength, cash costs, ARO, netbacks, corporate netbacks, operating netbacks, operating costs, corporate decline rate, tax pools, capital structure and components thereof, all of
    which are subject to the same assumptions, risk factors, limitations and qualifications as set forth in the above paragraphs and the assumptions outlined in the Non-IFRS measures section below. FOFI contained in this presentation was approved by management as of the
    date of this presentation and was provided for the purpose of providing further information about Tamarack’s anticipated future business operations. Tamarack disclaims any intention or obligation to update or revise any FOFI contained in this presentation, whether as a
    result of new information, future events or otherwise, unless required pursuant to applicable law. Readers are cautioned that the FOFI contained in this presentation should not be used for purposes other than for which it is disclosed herein.
    bbls     barrels                             WTI       West Texas Intermediate, the reference price paid in U.S. dollars at Cushing, Oklahoma for the crude oil standard grade   mmcf/d   million cubic feet per day      P3        proved + probable + possible reserves
                                                                                                                                                                                     BOPD     barrels of oil per day          ERH       extended reach horizontal
    bbls/d   barrels per day                     AECO      the natural gas storage facility located at Suffield, Alberta, connected to TransCanada’s Alberta System
                                                                                                                                                                                     NAV      net asset value                 EUR       estimated ultimate recovery
    boe/d    barrels of oil equivalent per day   IFRS      International Financial Reporting Standards as issued by the International Accounting Standards Board                     TTM      trailing twelve months          FX        foreign exchange
    GJ       gigajoule                           ROR       rate of return                                                                                                            EOR      Enhanced Oil Recovery           ESG       Environmental, Social and Governance

2                                                                                                                   w w w . t a m a r a c k v a l l e y. c a                                                                                                                                       2
Creating Sustainable Value - July 2021 - Tamarack Valley Energy
Disclaimers (Oil and Gas Advisories)
    Reserves Disclosure: All reserve references in this presentation are to gross reserves as at the effective date of the applicable evaluation. Gross reserves are Tamarack’s total working interest reserves before the deduction of any royalties and including any royalty interests of Tamarack. The recovery and reserve estimates of
    Tamarack’s crude oil, natural gas liquids and natural gas reserves provided herein are estimates only and there is no guarantee that the estimated reserves will be recovered. Actual crude oil, natural gas and natural gas liquids reserves may be greater than or less than the estimates provided herein. The reserve estimates
    contained herein were derived from (i) a reserves assessment and evaluation prepared by GLJ Ltd., a qualified independent reserves evaluator, dated February 8 ,2021 with an effective date of December 31, 2020; (ii) in the case of the assets acquired pursuant to the acquisitions completed in March 2021, an internal estimate
    prepared by the Company’s internal Qualified Reserve Evaluators, with an effective date of March 1, 2021; and (iii) in the case of the assets acquired pursuant to the acquisition completed on June 1, 2021, an internal estimate prepared on April 7, 2021 by the Company’s internal Qualified Reserve Evaluators, with an effective
    date of June 1, 2021, in each case prepared in accordance with National Instrument 51-101 (“NI 51-101”) and the most recent publication of the Canadian Oil and Gas Evaluations Handbook (the “COGE Handbook”). It should not be assumed that the present worth of estimated future cash flow presented herein represents the
    fair market value of the reserves. There is no assurance that the forecast prices and costs assumptions will be attained and variances could be material. The recovery and reserve estimates of Tamarack’s crude oil, natural gas liquids and natural gas reserves provided herein are estimates only and there is no guarantee that
    the estimated reserves will be recovered. Actual crude oil, natural gas and natural gas liquids reserves may be greater than or less than the estimates provided herein. References in this presentation to peak rates, IRR, initial 30 day production rates (IP30) and other short-term production rates are useful in confirming the
    presence of hydrocarbons, however such rates are not determinative of the rates at which such wells will commence production and decline thereafter and are not indicative of long term performance or of ultimate recovery. While encouraging, readers are cautioned not to place reliance on such rates in calculating the
    aggregate production of Tamarack. Analogous Information: In this presentation, the Company has provided certain information on the prospectivity and the production rate of wells on properties adjacent to the Company's acreage which is "analogous information" as defined by applicable securities laws. This analogous
    information is derived from publicly available information sources which the Company believes are predominantly independent in nature. Some of this data may not have been prepared by qualified reserves evaluators or auditors and the preparation of any estimates may not be in strict accordance with the COGE Handbook.
    Regardless, estimates by engineering and geotechnical practitioners may vary and the differences may be significant. The Company believes that the provision of this analogous information is relevant to the Company's activities and forecasting, given its property ownership in the area; however, readers are cautioned that
    there is no certainty that the forecasts provided herein based on analogous information will be accurate. Type Curves: Certain type curves disclosure presented herein represents estimates of the production decline and ultimate volumes expected to be recovered from wells over the life of the well. The type curves represent
    what management thinks an average well will achieve, based on methodology that is analogous to wells with similar geological features. Individual wells may be higher or lower but over a larger number of wells, management expects the average to come out to the type curve. Over time type curves can and will change based
    on achieving more production history on older wells or more recent completion information on newer wells. BOE Disclosure: The term barrels of oil equivalent (“BOE”) may be misleading, particularly if used in isolation. A BOE conversion ratio of six thousand cubic feet per barrel of natural gas to barrels of oil equivalence is
    based on an energy equivalency conversion method primarily applicable at the burner tip and does not represent a value equivalency at the wellhead. All BOE conversions in the report are derived from converting gas to oil in the ratio mix of six thousand cubic feet of gas to one barrel of oil. OOIP Disclosure: The term original-
    oil-in-place (“OOIP”) is equivalent to total petroleum initially-in-place (“TPIIP”). TPIIP, as defined in the COGE Handbook, is that quantity of petroleum that is estimated to exist in naturally occurring accumulations. It includes that quantity of petroleum that is estimated, as of a given date, to be contained in known accumulations,
    prior to production, plus those estimated quantities in accumulations yet to be discovered. A portion of the TPIIP is considered undiscovered and there is no certainty that any portion of such undiscovered resources will be discovered. If discovered, there is no certainty that it will be commercially viable to produce any portion of
    such undiscovered resources. With respect to the portion of the TPIIP that is considered discovered resources, there is no certainty that it will be commercially viable to produce any portion of such discovered resources. A significant portion of the estimated volumes of TPIIP will never be recovered.

    Non-IFRS Measures: Certain financial measures referred to in this presentation, such as net debt, adjusted funds flow, free adjusted funds flow, field level free adjusted funds flow, year-end net debt to Q4 annualized adjusted funds flow, market capitalization, enterprise value and capital efficiency are not prescribed by IFRS.
    Tamarack uses these measures to help evaluate its financial, operating performance, and liquidity and leverage. These non-IFRS financial measures do not have any standardized meaning prescribed by IFRS and therefore may not be comparable to similar measures presented by other issuers. Net debt is calculated as long-
    term debt plus working capital surplus or deficit adjusted for risk management contracts. Adjusted funds flow is calculated by taking net income or loss before taxes and adding back items, including transaction costs, and certain non-cash items including stock-based compensation; accretion expense on decommissioning
    obligations; depletion, depreciation and amortization; impairment; unrealized gain or loss on financial instruments; unrealized gain or loss on foreign exchange; unrealized gain or loss on cross-currency swap; and gain or loss on dispositions. Free adjusted funds flow is calculated as adjusted funds flow less capital
    expenditures, excluding acquisitions and dispositions. Field level free adjusted funds flow is calculated as free adjusted funds flow before the effect of interest and general & administrative expenses. Debt adjusted free adjusted funds flow yield is calculated as free adjusted funds flow, adjusted for growth (to add back capital in
    excess of maintenance and ARO capital and to remove the adjusted funds flow associated with growth volumes), plus finance costs, the sum of which is divided by enterprise value. Year-end net debt to Q4 annualized adjusted funds flow is calculated as net debt divided by the annualized adjusted funds flow for the most
    recently completed quarter. Market capitalization is calculated as shares outstanding multiplied by the closing market price of the shares on the day referenced. Enterprise value is calculated as market capitalization less net debt. Capital efficiency is calculated as capital expenditures for a project or period divided by the
    incremental production attributable to the expenditures.

    This presentation contains metrics commonly used in the oil and natural gas industry, such as operating netbacks (calculated on a per unit basis as oil, gas and natural gas liquids revenues less royalties, hedging gains (losses) and operating costs), operating field netback or OFN (total petroleum and natural gas sales, less
    royalties and net production and transportation expenses) NPV-10 (meaning the net present value (net of capex) of net income discounted at 10%), RLI (calculated by dividing reserves volumes by estimated production), EUR (meaning estimated ultimate recovery, an approximation of the quantity of oil or gas that is potentially
    recoverable or has already been recovered from a reserve or well), internal rate of return ("IRR") (a rate of return measure used to compare the profitability of an investment and represents the discount rate at which the net present value of costs equals the net present value of the benefits. The higher a project's IRR, the more
    desirable the project), adjusted funds flow (determined as gross oil, natural gas and natural gas liquids revenues including realized gains on commodity risk management contracts, less the following: royalties, operating costs, transportation costs, general and administrative costs and interest expense), free adjusted
    funds flow (calculated by subtracting adjusted funds flow in a period by the capital expenditures spent during that same period) and recycle ratio (measured by dividing the operating netback for the applicable period by finding and development cost per boe for the year, which is intended to compare netback from existing
    reserves to the cost of finding new reserves and may not accurately indicate the investment success unless the replacement reserves are of equivalent quality as the produced reserves), finding and development costs (calculated as the sum of field capital plus the change in future development capital (“FDC”) for the period
    divided by the change in reserves that are characterized as development for the period) and finding, development and acquisition costs (calculated as the sum of field capital plus acquisition capital plus the change in FDC for the period divided by the change in total reserves, other than from production, for the period). These
    terms have been calculated by management and do not have a standardized meaning and may not be comparable to similar measures presented by other companies, and therefore should not be used to make such comparisons. Management uses these oil and gas metrics for its own performance measurements and to
    provide shareholders with measures to compare Tamarack’s operations over time. Readers are cautioned that the information provided by these metrics, or that can be derived from the metrics presented in this presentation, should not be relied upon for investment or other purposes.

    Drilling Locations: This presentation discloses drilling locations two categories: (i) booked locations; and (ii) un-booked locations. Booked locations are proved and probable locations derived from an internal evaluation using standard practices as prescribed in the most recent publication of the COGE Handbook and account
    for drilling locations that have associated proved and/or probable reserves, as applicable. Un-booked locations are internal estimates and an assumption as to the number of wells that can be drilled per section based on industry practice and internal review. Un-booked locations do not have attributed reserves or resources. Of
    the approximately 853 (767.4 net) drilling locations identified herein, 131 (125.0 net) are proved locations, 32 (30.3 net) are probable locations and 690 (612.1 net) are unbooked locations. Unbooked locations have been identified by management as an estimation of our multi-year drilling activities based on evaluation of
    applicable geologic, seismic, engineering, production and reserves information. There is no certainty that the Company will drill all unbooked drilling locations and if drilled there is no certainty that such locations will result in additional oil and gas reserves, resources or production. The drilling locations on which the Company
    actually drills wells will ultimately depend upon the availability of capital, regulatory approvals, seasonal restrictions, oil and natural gas prices, costs, actual drilling results, additional reservoir information that is obtained and other factors. While certain of the unbooked drilling locations have been de-risked by drilling existing
    wells in relative close proximity to such unbooked drilling locations, the majority of other unbooked drilling locations are farther away from existing wells where management has less information about the characteristics of the reservoir and therefore there is more uncertainty whether wells will be drilled in such locations and if
    drilled there is more uncertainty that such wells will result in additional oil and gas reserves, resources or production.

    US Registration: This presentation is not an offer of the securities for sale in the United States. The securities have not been registered under the U.S. Securities Act of 1933, as amended, and may not be offered or sold in the United States absent registration or an exemption from registration. This presentation shall not
    constitute an offer to sell or the solicitation of an offer to buy nor shall there be any sale of the securities in any state in which such offer, solicitation or sale would be unlawful.

3                                                                                                                                          w w w . t a m a r a c k v a l l e y. c a                                                                                                                                                                     3
Creating Sustainable Value - July 2021 - Tamarack Valley Energy
Corporate Snapshot (TSX: TVE)
    Corporate/Market Summary                           Tamarack

    Market Capitalization(1) ($mm)                      $1,034
    Net Debt(1) ($mm)                                    $506
                                                                                                                            Charlie Lake
    Enterprise Value(1) ($mm)                           $1,540                                                                Light Oil
    Bank Line Capacity ($mm)                             $600
    Tax Pools ($mm)(2)                                  $1,030                                                                              Clearwater
                                                                                                                                            Medium Oil
    P+P Reserves (mmboe)(3)                              162.3

    2021 Capital Budget and Guidance(4)                      Full Year          H2 2021

    Capital Budget ($mm)                                    $165-$180          $85-$100
    Average Production (boe/d)                                33,000            38,000                    Cardium
                                                                                                          Light Oil
    Free Adjusted Funds Flow(1) ($mm)                       $120-$125          $85-$90                   Spirit River
                                                                                                            Gas
    Year-End Net Debt to Q4 Annualized Adj.
Creating Sustainable Value - July 2021 - Tamarack Valley Energy
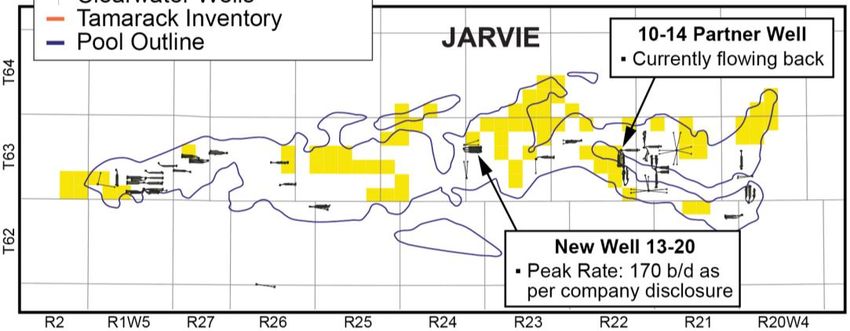
Q2 2021 & Year to Date Highlights
                                                  •    Closed the acquisition of Anegada Oil Corp. on June 1st, 2021
                        Strategic
                                                  •    Added greater than 350+ locations in the Clearwater and Charlie Lake oil
                       Acquisitions
                                                       plays

                        Financial                 •    Increased credit facilities to $600 million in Q2 and extended to May 2022
                        Flexibility               •    Path to < 1.2x Debt to Q4 Annualized Adjusted Funds Flow(1) by YE2021

                        Optimized
                                                  •    Quarterly production volumes of 32,416 boe/d in Q2 with 69% liquids
                        Production

                       Free Adjusted              •    Generated free adjusted funds flow(1) of $40.9 million in Q2
                        Funds Flow                •    Acquisitions enable positive FAFF(1) growth to $120-125+ million for 2021

                         Capital                  •    Invested $30.8 million in E&D expenditures to drill 21 (21.0 net) wells in Q2
                        Execution                 •    Invested $79.5 YTD, excluding acquisitions

5                                     w w w . t a m a r a c k v a l l e y. c a                                                         5
Creating Sustainable Value - July 2021 - Tamarack Valley Energy
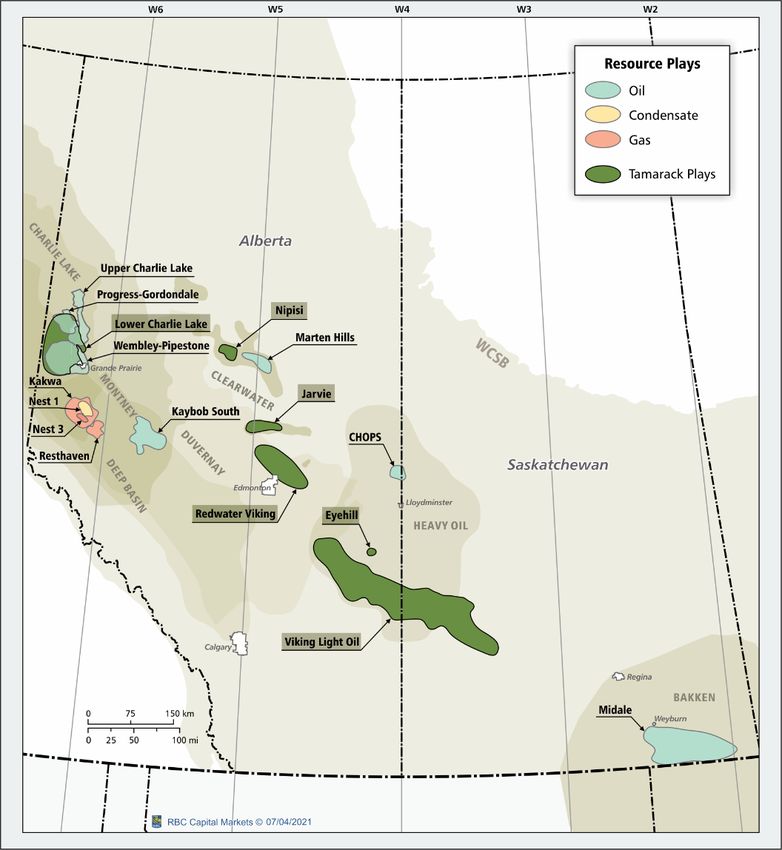
Tamarack – Strategic Free Adjusted Funds Flow(1) Growth
                          Strategic Principles                                                Tactical Execution

                                                          BALANCE SHEET STRENGTH AND RISK MANAGEMENT
                        Low Leverage & Balance            • Estimated 2021 year-end net debt to Q4 annualized adjusted funds flow(1)
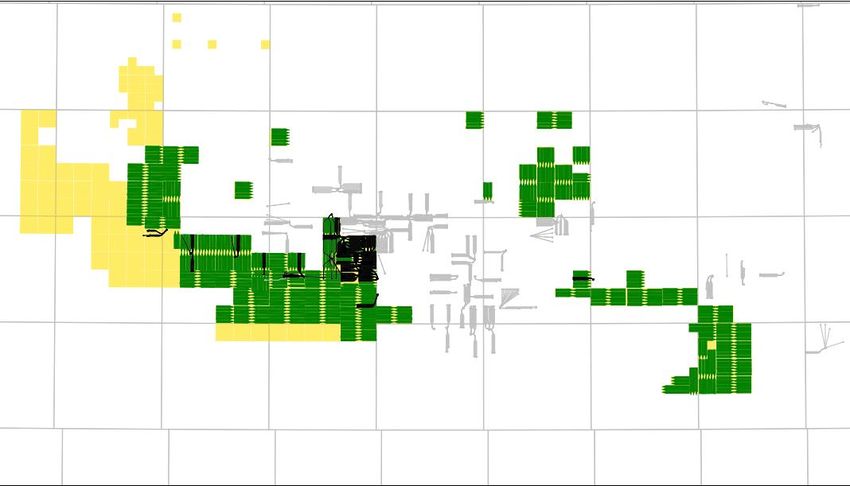
Creating Sustainable Value - July 2021 - Tamarack Valley Energy
7
                                                                                                                                                                                                                                     IRR (%)                                                                                    PV-10 Breakeven WTI @ 20:1

                                                                                                                                                                                                                                                                                                      Source: Enverus
                                                                                                                                                                                                                                                                                                                                       HH:WTI ($/bbl)

                                                                                                                                                                                                                                   200%
                                                                                                                                                                                                                                                           600%

                                                                                                                                                                                                      0%
                                                                                                                                                                                                                                                    400%
                                                                                                                                                                                                                                                                                                                                         $0
                                                                                                                                                                                                                                                                                                                                              $20
                                                                                                                                                                                                                                                                                                                                                           $60
                                                                                                                                                                                                                                                                                                                                                                      $80

                                                                                                                                                                                                                                                                                                                                                    $40
                                                                                                                                                                          Clearwater - Marten Hills                                                                                                         TVE Lwr Charlie

                                                                                                                                                                                                                                             571%
                                                                                                                                                                                                                                                                                                                                                    $30
                                                                                                                                                                                                                                                                                                                 Lake
                                                                                                                                                                          TVE Lower Charlie Lake
                                                                                                                                                                                                                                                                                                                               Midland

                                                                                                                                                                                                                                      459%
                                                                                                                                                                                                                                                                                                                                                    $33
                                                                                                                                                                               Montney - Progress-
                                                                                                                                                                                  Gordondale                                                                                                                                 Delaware

                                                                                                                                                                                                                                                                                                                                                     $35
                                                                                                                                                                             TVE Nipisi Clearwater                                                                                                                         TVE Nipisi
                                                                                                                                                                                                                                                                                                                                                     $36

                                                                                                                                                                                                                                 376% 353%
                                                                                                                                                                                                                                                                                                                           Clearwater
                                                                                                                                                                         Montney - Kakwa - Nest 1                                                                                                                             Montney
                                                                                                                                                                                                                                                                                                                                                      $41

                                                                                                                                                                               Deep Basin - Kakwa                                                                                                                                   DJ
                                                                                                                                                                                                                                                                                                                                                          $42

                                                                                                                                                                                   Viking - Alberta                                                                                                                        Eagle Ford
                                                                                                                                                                                                                                                                                                                                                          $43

                                                                                                                                                                             Midale Conventional -
                                                                                                                                                                                                                                                                                                                           Shaunavon
                                                                                                                                                                                                                                                                                                                                                          $44

                                                                                                                                                                                Saskatchewan

                                                                                                                                                                                                       182% 148% 126% 118%
                                                                                                                                                                                   Sparky - Eyehill                                                                                                                       Bakken - US

                                                                                                                                                                                                                           81%
                                                                                                                                                                                                                                                                                                                                                          $44

                                                                                                                                                                              Montney - Wembley-
                                                                                                                                                                                                                                                                                                                          Viking Primary
                                                                                                                                                                                                                                                                                                                                 Viking

                                                                                                                                                                                                      78%
                                                                                                                                                                                                                                                                                                                                                          $45

                                                                                                                                                                                  Pipestone

                                                                                                                                                                          Deep Basin - Resthaven                                                                                                                                  Yeso
                                                                                                                                                                                                                                                                                                                                                          $45

                                                                                                                                                                                                      73%

                                           Source: National Bank Financial and Internal TVE Benchmarking (Jarvie); Pricing Assumption: US$55.00/bbl WTI C$2.50/GJ AECO
                                                                                                                                                                          Midale Unconventional -
                                                                                                                                                                                                                                                                                                                         Bakken - CDN
                                                                                                                                                                                                                                                                                                                                                           $48

                                                                                                                                                                                                      71%
                                                                                                                                                                              Saskatchewan

                                                                                                                                                                            TVE Jarvie Clearwater                                                                                                                            NM Shelf
                                                                                                                                                                                                                                                                                                                                                           $49

                                                                                                                                                                                Mannville CHOPS       70%                                                                                                                    San Juan
                                                                                                                                                                                                                                                                                                                                                            $50

                                                                                                                                                                                                      63%
                                                                                                                                                                                                                                                                  Leading WCSB Play Benchmarking(1)

                                                                                                                                                                              Charlie Lake - Upper                                                                                                                          Val Verde
                                                                                                                                                                                                                                                                                                                                                            $51

                                                                                                                                                                                                      63%

                                                                                                                                                                            Viking - Saskatchewan                                                                                                                                Unita
                                                                                                                                                                                                                                                                                                                                                                $55
                                                                                                                                                                                                                                                                                                                                                                                     North American Half-Cycle Breakevens by Play

                                                                                                                                                                                                      57%

                                                                                                                                                                         Montney - Kakwa - Nest 3                                                                                                                        Cental Basin
                                                                                                                                                                                                                                                                                                                                                                $55

                                                                                                                                                                                                      56%

                                                                                                                                                                         Duvernay - Kaybob South                                                                                                                        SCOOP | Stack
                                                                                                                                                                                                                                                                                                                                                                $55

                                                                                                                                                                                                      54%
                                                                                                                                                                                                                                                                                                                                                                                                                                                                                                        North American Play Benchmarking
                                                                                                                                                                                                                                                                                                                                                                                                                                    Top tier asset with leading WTI breakevens and half-cycle returns

                                                                                                                                                                                                      0
                                                                                                                                                                                                                                   1
                                                                                                                                                                                                                                                           3

                                                                                                                                                                                                                                                    2

                                                                                                                                                                                                                                                                                                                             Duvernay
                                                                                                                                                                                                                                                                                                                                                                 $60

                                                                                                                                                                                                                            Payout (Years)
w w w . t a m a r a c k v a l l e y. c a
                                                                                                                                                                                                                                                                                                                                                                            Legend

7
Creating Sustainable Value - July 2021 - Tamarack Valley Energy
Successfully Executing on Acquisition Strategy
          Improving sustainability and resiliency, while enhancing free adjusted funds flow(1) profile

                                                                                                            Charlie Lake
                              West Central Alberta         Clearwater                Sparky / Clearwater
                                                                                                              Light Oil                Total
                                   July 2020              December 2020                  March 2021
                                                                                                             June 2021

    Acquisition Overview
    Purchase Price                 $4 million               $74 million                    $135 million      $494 million           $707 million
    Production                    2,500 boe/d               2,000 boe/d                    2,800 boe/d       12,500 boe/d           19,800 boe/d
    Op. Field Netback(1)           $3 million               $20 million                     $35 million      $135 million           $193 million

    Implied Multiples
    PP/Op. Field Netback(1)           1.4x                     3.8x                           3.9x               3.7x                   3.7x
    PP/Production                $1,600 / boe/d           $37,000 / boe/d                $48,000 / boe/d    $41,900 / boe/d        $35,700 / boe/d

    Asset Summary
    Gross Locations(2)            50 locations             400+ locations            100+ CW / 50+ Sparky   250+ locations         850+ locations
    Undiscounted ARO               $36 million               $3 million                   $11 million         $18 million            $68 million

                                                  Accretive acquisitions that reduce Tamarack’s breakeven pricing and add a deep
                                                     inventory of drilling locations in North America’s most economic oil plays

8                                                             w w w . t a m a r a c k v a l l e y. c a                                               8
Creating Sustainable Value - July 2021 - Tamarack Valley Energy
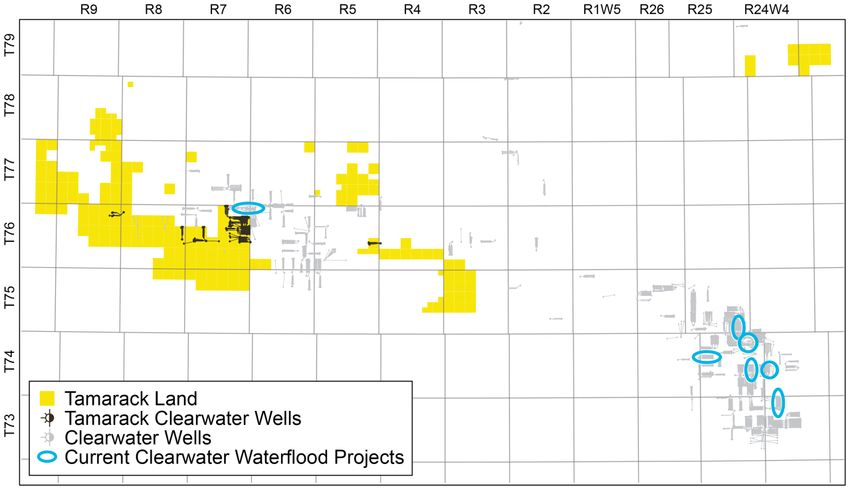
Capital Allocation Optionality Delivers Sustainability
           Portfolio that can deliver near-term and long-term free adjusted funds flow(1)

                                                           Sustaining Capital(1)
          Waterflood Management                                                                                     Economic Growth
                                                             Modest Growth

                                                     Highly Economic Inventory that Sustains
                    Low Decline,
                                                     Meaningful Production While Generating                   Highly Economic Production Growth
               Stable Production Base
                                                      Significant Free Adjusted Funds Flow(1)

    Veteran Viking Light Oil        ~5 Mboe/d     Charlie Lake Light Oil Wells              ~30 Mboe/d   Nipisi Clearwater Oil Wells   ~5 Mboe/d
    Eyehill Sparky Medium Oil                     Viking Primary Oil Wells                               Jarvie Clearwater Oil Wells
    Clearwater Medium Oil             ~20%        Cardium / Falher Wells                        ~40%                                     ~40%
    Slave Point and Penny Light Oil

                  Capital Allocation Across a Portfolio of High Quality, Long-Life Oil Assets that Delivers
                               Production and Free Adjusted Funds Flow(1) per Share Growth

          H2 2021           Percent of H2 2021
         Production          Capital Program

9                                                         w w w . t a m a r a c k v a l l e y. c a                                                 9
Creating Sustainable Value - July 2021 - Tamarack Valley Energy
Meaningful Free Adjusted Funds Flow(1) from all Assets
                                                                                           Maintenance Capex        FAFF $55 WTI       FAFF $65 WTI
                             $180

                             $160

                             $140                      $30
                                                                                                     $23

                             $120
     Run Rate NOI(1) ($MM)

                             $100

                                                       $76                                           $67
                             $80                                                                                                                $22

                             $60
                                                                                                                                                        $12
                                                                                                                                                $34
                             $40
                                                                                                                                                        $30
                                                       $50                                           $55
                             $20                                                                                                                $35
                                                                                                                                                        $20
                              $0

                                                Waterflood                                  Charlie Lake                                 Clearwater   Cardium
                              Additional Pricing Assumptions: AECO at $2.35/GJ as well as a CAD/USD exchange rate of 1.2500.

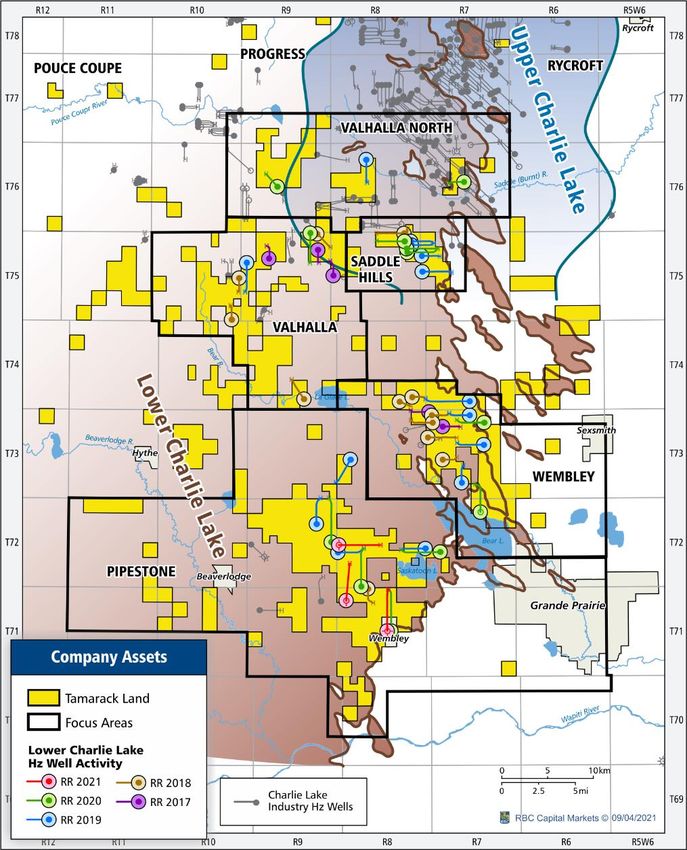
10                                                                                                   w w w . t a m a r a c k v a l l e y. c a                   10
Highly Economic Lower Charlie Lake Light Oil Locations
                                                                                                          2 Mile Lateral Length Normalized Well Performance(1)
                                                                                                200

                                                          Cumulative Production (Mbbl)
                                                                                                                       ~45% of wells ≥ 2 miles(3)
                                                                                                150
                                                                                                                                                                                   T10
                                                                                                                                                                                   T9
                                                                                                100                                                                                T8
                                                                                                                                                                                   T7

                                                                                                 50

                            102/16-22-073-07W6
                                IP30 Rate(2):                                                     0
                                                                                                      0                4                     8               12               16
                               1,048 boe/d(3)
                                                                                                                                           Months
                                 (650 bopd)
                                                                                                                                     Payout Sensitivity
                                                                                                                                        Flat Pricing
                                                                                                0.7

                                                                                                0.6

                                                                                                0.5

                                                                               Payout (Years)
                                                                                                0.4
                                                                                                                                                                                         $55 WTI
                  100/12-16-071-08W6                                                            0.3
                       IP30 Rate(2):                                                                                                                                                     $65 WTI
                     1,367 boe/d(4)                                                             0.2
                      (1,157 bopd)                                                                                                                                          TVE’s first 2 wells:
                                                                                                0.1                                                                          0.2 year payout
                                                                                                  0
                                                                                                              Tier 7            Tier 8              Tier 9        Tier 10

11                                               w w w . t a m a r a c k v a l l e y. c a                                                                                                          11
Tamarack’s Clearwater Assets
               400+ identified locations(1) in the Greater Nipisi area and 100+ identified locations(1) in the Jarvie area
                                                                                                                                                           Payout Sensitivity
                                                                                                                                                              Flat Pricing
      15-29 West          14-26 West
       Stepout             Stepout                                                                                      0.8
       ~300b/d             ~240b/d
                                                                                                                        0.7
                                                             5-13 Marten                                                0.6                                Current Results

                                                                                             Payout (Years)
                                                               Stepout
                                                              • ~118b/d                                                 0.5                                Exceeding
                                                               • 14 API                                                                                    Typecurves                                     $55 WTI
                                                                                                                        0.4
                                                                                                                        0.3                                                                               $65 WTI
                                                                                                                        0.2
       13-25 West
         Stepout                                                                                                        0.1
     • ~70b/d (3 legs)   15-17 West         Main
        • 19 API          Stepout       Development                                                                      0
                          ~250b/d           Area                                                                                  6-Leg Tier 1 Typecurve                     8-Leg Tier 1 Typecurve
                                       • Average Peak
                                         IP30: ~185b/d
                                                                                                                        25

                                                                                               Cumulative Oil (Mbbls)
                                                                                                                                                             >35% uplift in early
                                                           09-14 Partner Well                                           20
                                                                ~150 b/d
                                                                                                                                                             cum production
                                                                                                                        15

                                                                                                                        10

                                                                                                                         5
                                                   New Competitor
                                                      Well 1-30                                                          0
                                                      ~185 b/d                                                                0      1              2             3                 4           5     6
                                                                                                                                                                Months

12                                                                              w w w . t a m a r a c k v a l l e y. c a                                                                                     12
Clearwater Waterflood Potential
         Tamarack will develop the play with a long-term view to the application of EOR

                           Nipisi/Marten Hills EOR Pilots                                                         Evolution of Waterflooding Criteria/Applicability

                          Spur

                                                                   Deltastream
                                                                               Headwater

                                                                     Spur

     •   Other companies have initiated EOR pilot projects (both waterflood and polymer floods) in the Clearwater formation
     •   Tamarack’s Clearwater assets have the key attributes required for successful EOR projects and management has extensive experience managing waterfloods
     •   Tamarack has identified the focus area for its initial waterflood pilot which will commence in Q4 2021

13                                                                     w w w . t a m a r a c k v a l l e y. c a                                                       13
Tamarack’s Waterflood Assets
        Improving corporate declines with increasing exposure to assets under waterflood

                      Total Area     Prod. Under         Total Asset        Est. Recovery            Est. Ultimate
        Asset                                                                                                                               Current Initiatives
                        Prod.        Waterflood            OOIP(1)            to Date(2)              Recovery(2)

     Veteran Viking                                                                                                           Adding ~8 new injection patterns in Veteran and East
                                     2,400 bbl/d under    900 to 1,000
                      ~4,500 bbl/d                                                   2%                     17%             Veteran (new drills and conversions), start injection on first
        Light Oil                    active waterflood      MMbbl
                                                                                                                            3 patterns in North Veteran stepout area throughout 2021

       Sparky                                                                                                                     Increase make-up water and expand existing
                                     1,050 bbl/d under
                      ~2,100 bbl/d                         200 MMbbl                 2%                     15%             waterflooded area by ~1-2 sections (injector conversions,
      Medium Oil                     active waterflood
                                                                                                                                       4-6 patterns) in the next 6 months

      Slave Point                                                                                                               Identify injector conversions to improve waterflood
                                     575 bbl/d under
                       ~575 bbl/d                          40 MMbbl                  8%                     20%               performance, evaluate opportunities for infill producers
        Light Oil                    active waterflood
                                                                                                                                             after injection optimization

         Penny                       875 bbl/d under                                                                            Actively managing injection for optimal area-based
                       ~875 bbl/d                          60 MMbbl                 15%                     21%
        Light Oil                    active waterflood                                                                          recovery factors, additional infill locations identified

      Clearwater                                         15 to 20 MMbbl
                                        No active                                                   Up to 20% in selected
                      ~5,200 bbl/d                        per section in
Tamarack’s Waterflood Assets
       Improving corporate declines with increasing exposure to assets under waterflood

                                                               Net Waterflooded Oil – Includes 2021 Capital Program
      Production (bopd)

                                                Penny Barons               Veteran Viking             Nipisi Slave Point         Eyehill Sparky
        7,000

        6,000

        5,000

        4,000

        3,000

        2,000

        1,000

             0
            Jan-2020      Apr-2020   Jul-2020   Oct-2020   Jan-2021        Apr-2021      Jul-2021      Oct-2021      Jan-2022   Apr-2022     Jul-2022   Oct-2022   Jan-2023

        Recent additions in Eyehill and Nipisi will complement stable performance in Penny and exciting growth in Veteran

15                                                                    w w w . t a m a r a c k v a l l e y. c a                                                                15
Sustainability at Tamarack

     Environment, Social & Governance Focus Areas
                            • Reduce greenhouse gas emissions
                            • Understand climate change risks
                            • Innovate to lower energy intensity

                            • Prudently use water where required
                            • Recycle produced water in operations
                            • Innovate to minimize freshwater use

                            • Effectively manage inactive liabilities
                            • Understand and respect ecosystems
                            • Reduce environmental impact

                            • Actively engage with stakeholders
                            • Seek shared value opportunities                                     Inaugural Sustainability Report: Released October 2020
                            • Facilitate inclusive partnerships

                            • Prioritize health and safety                                   Understanding and managing risks enables sustainability
                            • Operate with integrity and transparency
                            • Proactively understand and manage risk                           and ESG to drive profit and enhance future value

16                                                                w w w . t a m a r a c k v a l l e y. c a                                                 16
Sustainability at Tamarack
                         Indigenous Partnerships                                                                                               Emissions & Land Management
     • Tamarack is committed to the principles of UNDRIP and participating in                                                                        2019 GHG Scope 1 + 2 Intensity by Company
       reconciliatory activities                                                                                                                                   (tCO2e/boe)
                                                                                                         0.10
     • The Kainai First Nation and Tamarack actively partner to create shared                            0.08
       value opportunities including:                                                                    0.06

           • Capital projects such as the Banff light oil play                                           0.04

           • Cultural initiatives                                                                        0.02

                                                                                                         0.00
           • Economic opportunities and employment for First Nations                                                                Peer 1      TVE      Peer 2   Peer 3    Peer 4     Peer 5     Peer 6   Peer 7      Peer 8
             individuals and businesses                                                                                               Peers Include: ARC, Baytex, Cenovus, Crescent Point, Enerplus, Suncor, TORC, Whitecap

           • Indigenous site rehabilitation program support for indigenous                                                                                    Net ARO Spend / Inactive Liability
                                                                                                                                7                                                                                   6.51%       7%
             business opportunities and reduction of environmental liabilities
                                                                                                                                6                                                                                               6%

                                                                                                       Net ARO Spend (CAD$MM)
     • Tamarack is actively engaging with Treaty 8 Nations in the Nipisi area

                                                                                                                                                                                                                                     ARO Spend/Liability (%)
                                                                                                                                5                                                                                               5%
                                                                                                                                                                                          3.97%
                             Through a decade-long partnership, the Blood Tribe                                                 4                                                                                               4%
                             and Tamarack have helped each other be successful.                                                 3                                                                                               3%
                                                                                                                                                                  2.33%
                             Our oil production is growing as others’ shrink and
                                                                                                                                2                                                                                               2%
                             we’ve done great work together to preserve our                                                                  1.15%
                             culture. We look forward to a full and equal partnership                                           1                                                                                               1%
                                                                                                                                     0.9 million             1.9 million             3.15 million           6.3 million
                             in developing our oil resources.                                                                   0                                                                                               0%
                                                                                                                                             2017                 2018                    2019                      2020
                             – Roy Fox, Chief Blood Tribe
                                                                                                                                                           NET ARO spend             ARO Spend/inactive liability

17                                                                       w w w . t a m a r a c k v a l l e y. c a                                                                                                                                              17
Investment Summary
         Track record of meeting and exceeding estimates

     Sustainable Returns Focused Strategy to Grow Production and Free Adjusted Funds Flow(1) per Share

                           Management team that has demonstrated its ability to execute and capitalize on opportunities

      Stable Base                 Economic Oil                                                         Balance Sheet
                                                                                                                             Leading ESG
     Production and                 Weighted                        Optionality                      Strength and Risk
                                                                                                                               Practices
         AFF(1)                     Inventory                                                           Management

        38,000 boe/d               Highly economic             Commodity exposure,                     Low leverage and     Indigenous partners,
APPENDIX

19              w w w . t a m a r a c k v a l l e y. c a   19
Risk Management – Current Hedges(1)
             58%           Enhancing certainty with flexibility
                               to capture upside value                    (2),(3)
                                                                                                                                                                                                          60%
              Oil price protection in 2021                                                                                                                                       Target oil hedging for H2 2021
                                                                                                                                                Q3 2021                             Q4 2021                        Q1 2022                           Q2 2022
                                                                                         WTI Put
                           Oil Hedge Coverage(3)                                          Volume (bbls/d)                                                         3,250                           4,750                          9,250                             5,500
                                                                                          Average Put/Premium (USD/bbl)                    $51.88              $2.43         $51.57            $2.15        $52.55            $2.55           $52.74            $2.74
70%
                                                                                         WTI 2-way collar
60%
                                                                                          Volume (bbls/d)                                                         5,750                           6,000                               500                          2,000
50%                                                                                                                                  $37.83          $59.31      $0.52     $38.33     $59.33     $0.50    $52.00     $84.60     $2.00       $51.50     $87.78     $2.02
                                                                                          Average Put/Call/Premium (USD/bbl)
40%                                                                                      WTI 3-way collar
30%                                                                                       Volume (bbls/d)                                                         1,000                           1,000
20%                                                                                       Average Put/Call/Sold Put/Premium
                                                                                                                                     $40       $60       $32       $2      $40      $60   $32      $2
10%                                                                                       (USD/bbl)
                                                                                         WTI 3-way collar alternate
 0%
            Q3 2021             Q4 2021                  Q1 2022               Q2 2022    Volume (bbls/d)                                                                                                                                                               500
                                                                                          Average Bought Put/Sold Call/Bought Call
                                                                                                                                                                                                                                            $52     $70    $73.76       $2
                       WTI Total (%)      MSW Diff (%)     WCS Diff (%)                   Put/Premium (USD/bbl)
                                       WTI Ext. (%)                                      WCS Diff
                                                                                          Volume (bbls/d)                                                          1,500                                                              500                               500
                                                                                          Average Fixed Price (USD/bbl)                                         ($11.88)                                                        ($12.85)                         ($12.85)
                            Gas Hedge Coverage
                                                                                                                                 Q3 2021             Q4 2021                                                       Summer 21 Winter 21-22 Summer 22
      60%
                                                                                         Edm Par Diff                                                                  AECO 5A fixed price
      40%                                                                                 Volume (bbls/d)                              8,750               8,750         Volume (GJ/d)                                    33,000                  40,000          30,000
      20%                                                                                 Average Fixed Price (USD/bbl)              ($5.15)             ($5.15)         Average Fixed Price (CAD/GJ)                      $2.49                   $3.10           $2.42
                                                                                         WTI fixed price                                                               Malin fixed price
      0%
                                                                                          Volume (bbls/d)                             3,750               2,500          Volume (DTH/d)                                       4,000
                 Summer 21                Winter 21-22             Summer 22
                                                                                          Average Fixed Price (USD/bbl)              $48.97              $48.35
                                                                                                                                                                         Average Fixed Price (USD/DTH)                        $2.83
                      AECO (% of Total)        US Markets (% of Total)                   WTI fixed price ext
                                                                                          Volume (bbls/d)                               500
                                                                                          Average Fixed Price (USD/bbl)              $50.00

20                                                                                              w w w . t a m a r a c k v a l l e y. c a                                                                                                                                      20
Notes
     Page 4
     1.    See Disclaimers – “Non-IFRS Measures”
     2.    Estimated as at December 31, 2020, adjusted for the previously announced March acquisitions and June Anegada Acquisition
     3.    Tamarack Valley based on the independent reserves evaluation prepared by GLJ Ltd. dated February 8, 2021 and effective December 31, 2020. Total proved plus probable reserves for the strategic Clearwater and
           Waterflood assets, announced on March 5, 2021, and the strategic Charlie Lake light-oil assets, announced April, 12, 2021, are internally estimated by the Company's internal qualified reserve evaluators ("QRE") and
           prepared in accordance with National Instrument 51-101 – Standards of Disclosure of Oil and Gas Activities ("NI 51-101") and the most recent publication of the Canadian Oil and Gas Evaluations Handbook
           ("COGEH"). "Internally estimated" means an estimate that is derived by the Company's internal QRE and prepared in accordance with NI 51-101. Internal estimates contained in this presentation were prepared
           effective as of: March 1, 2021 for the strategic Clearwater and Waterflood assets; and June 1, 2021 for the strategic Charlie Lake light-oil assets. Reserves values are based on working interest reserves of the Assets
           before deduction of royalties and without including any of royalty interest reserves.
     4.    Updated guidance from April 12, 2021 incorporates the Acquisition and updated market pricing; capital adjusted on June 1, 2021.

     Page 5
     1.    See Disclaimers – “Non-IFRS Measures”

     Page 6
     1.    See Disclaimers – “Non-IFRS Measures”

     Page 7
     1.    Assumes flat pricing; WTIUS$55.00/bbl, AECO C$2.50/GJ, Fx 1.2600 C$/US$, Ed. Light Diff (US$5.25/bbl), WCS Diff (US$12.50/bbl), Cromer Light is 98.6% of Ed. Light, C2, C3, C4, and C5+ are 11%, 36%, 62%, and
           103% of Ed. Light respectively, no inflation

     Page 8
     1.    See Disclaimers – “Non-IFRS Measures”
     2.    See “Oil and Gas Advisories”

     Page 9
     1.    See Disclaimers – “Non-IFRS Measures”

     Page 10
     1.    See Disclaimers – “Non-IFRS Measures”; NOI – Net Operating Income

21                                                                                              w w w . t a m a r a c k v a l l e y. c a                                                                                               21
Notes
     Page 11
     1.    Lateral length normalized to 3,000m, based on a 1:1 ratio of lateral length to well performance
     2.    See “Oil and Gas Advisories”
     3.    Comprised of 650 bbl/d light and medium oil, 74 bbl/d NGL and 1,942 mcf/d natural gas
     4.    Comprised of 1,157 bbl/d light and medium oil, 38 bbl/d NGL and 1,030 mcf/d natural gas

     Page 12
     1.    See “Oil and Gas Advisories”

     Page 14
     1.    See “Oil and Gas Advisories”
     2.    Internal estimates and forward-looking Development Summary based on internal management projections

     Page 18
     1.    See Disclaimers – “Non-IFRS Measures”; AFF – Adjusted Funds Flow

     Page 21
     1.    As at July 26, 2021, including hedges previously held by Anegada Oil Corp.
     2.    For July 1, 2021 through December 31, 2021
     3.    Includes the potential extension of WTI fixed price hedges in Q4 (500 bbls/day @ $50.00)

22                                                                                              w w w . t a m a r a c k v a l l e y. c a   22
You can also read