Croatia's Islands: Making the Most of Their Territorial Capital Through Smart Solutions - National Development Strategy Croatia 2030 Policy Note
←
→
Page content transcription
If your browser does not render page correctly, please read the page content below
National Development Strategy Croatia 2030 Policy Note:

Croatia’s Islands: Making the
Most of Their Territorial Capital
Through Smart Solutions
August 2019
Contents

1 Smart Islands – challenges and opportunities on the European and global level ................................. 3
      1.1 Challenges .................................................................................................................................. 4
      1.2 Opportunities .............................................................................................................................. 5
      1.3 Best practices ............................................................................................................................. 7
2 Development challenges and opportunities of Croatian islands based on their territorial capital ........ 9
3 Key areas of intervention and performance indicators ....................................................................... 25
      3.1 Key areas of intervention (KAI)............................................................................................... 25
      3.2 Key performance indicators (KPI) ........................................................................................... 26
4 Policy mix recommendations ............................................................................................................. 29
      4.1 Short-term policy recommendations (1-3 years) ...................................................................... 30
      4.2 Medium-term policy recommendations (4-7 years) ................................................................. 33
      4.3 Long-term policy recommendations (8-10 years) .................................................................... 36
      4.4 Cross-cutting issues and their implications for policy ............................................................. 38
5 Overview of possible funding sources ............................................................................................... 39
6 Annex | Smart Islands: Best practices – a detailed overview ............................................................. 44
      6.1 The Smart Islands programme, the Isles of Scilly, United Kingdom....................................... 44
      6.2 Emergency Quick Response Code, The Balearic Islands, Spain ............................................. 45
      6.3 The WiFI Palma project, Palma de Mallorca, Spain ................................................................ 46
      6.4 The VIRTU/ELVI project, Saaremaa, Estonia......................................................................... 47
      6.5 The smart Salina island, Italy ................................................................................................... 47
      6.6 The TILOS project, Greece ...................................................................................................... 48
      6.7 Island of Sifnos, Greece ........................................................................................................... 49
      6.8 The PORT-PEV project, Malta ................................................................................................ 50
      6.9 The Energy Self-Sufficient Island, the Island of Unije, Croatia .............................................. 51
      6.10 Marine Protected Area, Italy .................................................................................................. 51
      6.11 Movitz electric ferry, Sweden ................................................................................................ 52

Croatia’s islands: Making the most of their territorial capital through smart solutions                                                                2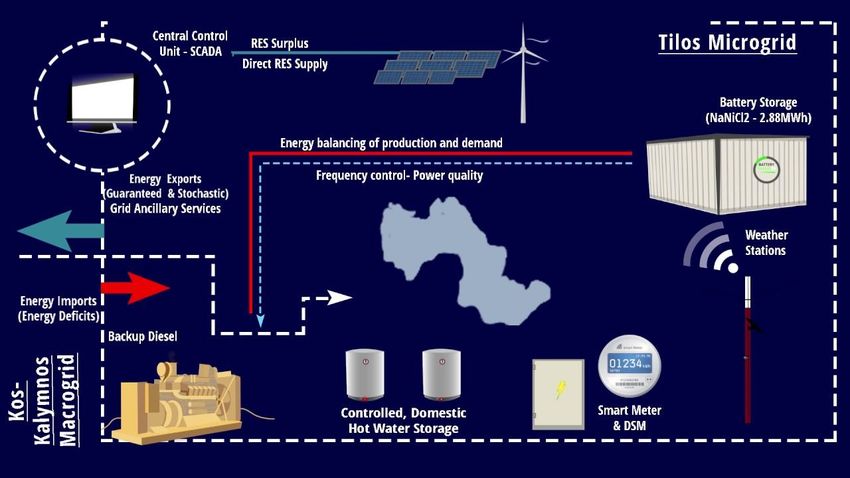
1 Smart Islands – challenges and opportunities on the
European and global level

A smart island is an island that demonstrates the following elements - smart governance, smart
people, smart mobility, smart living, smart economy, and smart environment.1 Being a smart island
is also becoming synonymous with being green, sustainable, energy efficient, and climate resilient.
Smart Island Initiatives define a smart island as an insular territory that embarks on a climate resilient
pathway, combining climate change mitigation and adaptation efforts, in order to create sustainable
local economic development and a high quality of life for the local populations by implementing smart
and integrated solutions for the management of infrastructure, natural resources and the environment
as a whole, supported by the use of ICT, all while promoting the use of innovative and socially inclusive
governance and financing schemes.2
    Despite their uniqueness and differences, all islands face similar challenges with regards to
their development. Those challenges consist of:
      •      overcoming the difficulties associated with geographical separation and distance from the
             mainland;
      •      solving the conundrum of public facilities that need to be able to meet peak demand during the
             tourist season but may be excessive and costly to operate for most of the year (such as infor-
             mation and communication technologies, energy, transport, waste collection and processing,
             sewage treatment, etc.); and related to this maintaining a balanced demographic make-up;
      •      organizing necessary education structures and providing vocational training and jobs for local
             people;
      •      guaranteeing the livelihoods of people working in the tourist industry, who have short seasons
             and often perform several different jobs;
      •      protecting the coastal and marine environment that is put under significant pressure at certain
             times of year;
      •      finding the necessary funding to provide public services for the permanent population, which
             is often small and aging; and,
      •      providing affordable housing for young people when holiday homes, the protection of natural
             areas and limitations on areas approved for development result in high housing costs.3
     Despite their differences, islands are shaped by insularity, a structural, ever-present condition
of geographic disconnection which has implications on energy supply, transportation costs, and
economic diversification. However, they also tend to have unique ecosystems, enhanced levels of so-
cial capital, strong traditions of cooperation amongst the population, and a strong sense of identity and
belonging. The Declaration states that this set of pluralistic characteristics is, in fact, conducive to the
emergence of local development paradigms on islands that optimally combine environmental, social,

1 Ghosal, A., Halder, S., 2018: Building Intelligent Systems for Smart Cities: Issues, Challenges and Approaches, in: Smart
Cities: Development and Governance Frameworks (ed. Mahmood, Z.), Springer, Derby, UK
2 Smart Islands Declaration: new pathways for European Islands, Smart Islands Initiative, 2016
3 TEN Section Report on the “Smart Islands” Project, European Economic and Social Committee, 2017.

Croatia’s islands: Making the most of their territorial capital through smart solutions                                       3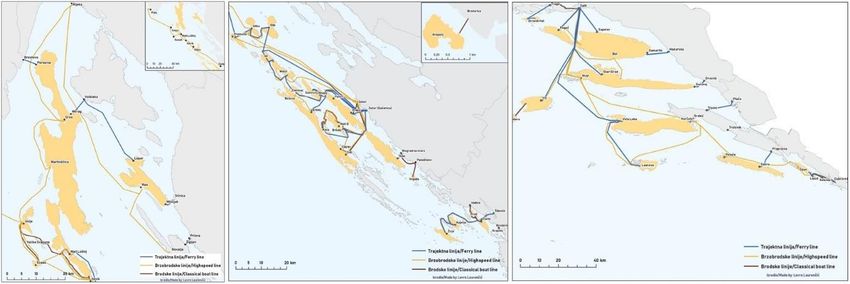
economic and technological solutions underpinned by the premise of smart, integrated and inclusive
natural resources and infrastructure management.4
     The European Parliament resolution on the special situation of islands recognizes the various
challenges as well as opportunities for future island development. It states that EU islands are also
often peripheral regions, situated in some cases on the EU’s external borders, and are particularly vul-
nerable to the challenges that are currently facing Europe, such as globalization, demographic decline
and aging, climate change, energy dependency and, especially for the southern regions, exposure to
increasing migration flows. Additionally, the resolution recognizes challenges related to the seasonality
of tourism and the accessibility of islands.5

1.1 Challenges

Leaders around the world struggle to understand how best to invest in intelligent infrastructure
and connectivity to deliver long-term value for their citizens.6 This can be the result of short-term
mindsets or a lack of the visionary leadership necessary for creating successful, smart islands.7 In order
to transform islands into smart and thriving economies, there is a need for well-designed and targeted
community capacity building. Engaging and strengthening island stakeholders is crucial for understand-
ing how to best invest in intelligent infrastructure and how to implement smart solutions that address
real needs. Also, there is a need for a visionary leadership that will be able to see the opportunities to
apply new cutting-edge technologies as they become available. Capacity building of different stakehold-
ers, such as authorities, citizens, entrepreneurs and academia is necessary to be able to develop effective
partnerships and holistic solutions and to ensure effective decision-making processes within the various
levels of government.
     There are specific technological challenges to be understood and overcome in any smart solu-
tion effort. These include machine-to-machine communications, security, spectrum utilization8, intelli-
gent information networks, and the interconnection of a set of standards to achieve system interopera-
bility.9 Data cannot be shared – and smart islands cannot fulfil their potential – if their systems cannot
work with other related systems. Other challenges include implementation costs, high energy consump-
tion, privacy and security, integration, and upgrading of technologies.10
    Engaging citizens, as well as a broad spectrum of stakeholders, is crucial for the success of
smart solutions to be implemented on islands. The potential solutions will be irrelevant to most in-
habitants unless they can learn how to use new technology.11 There is also the challenge of ensuring
equity and fairness regarding access by various socio-economic or disadvantaged groups in the local
community, such as people with low incomes or the elderly. Elderly inhabitants comprise a large share

4 Smart Islands Declaration: new pathways for European Islands, Smart Islands Initiative, 2016
5 European Parliament resolution of 4 February 2016 on the special situation of islands (2015/3014(RSP))
6 World Development Report 2016: Digital Dividends, World Bank Group, 2016
7 Smart cities: understanding the challenge and opportunities, Smart Cities World, 2017
8 Spectrum utilization refers to efficient use of radio frequencies in order to promote social benefit via the increase quality

and speed of wireless communication – Cave, M. et al, 2007: Modern Spectrum Management, Cambridge University Press
9 Smart Sustainable Cities: Reconnaissance Study, United Nations University, International Development Research Center,

2016
10 Ghosal, A., Halder, S., 2018: Building Intelligent Systems for Smart Cities: Issues, Challenges and Approaches, in: Smart

Cities: Development and Governance Frameworks (ed. Mahmood, Z.), Springer, Derby, UK
11 Smart cities: understanding the challenge and opportunities, Smart Cities World, 2017

Croatia’s islands: Making the most of their territorial capital through smart solutions                                           4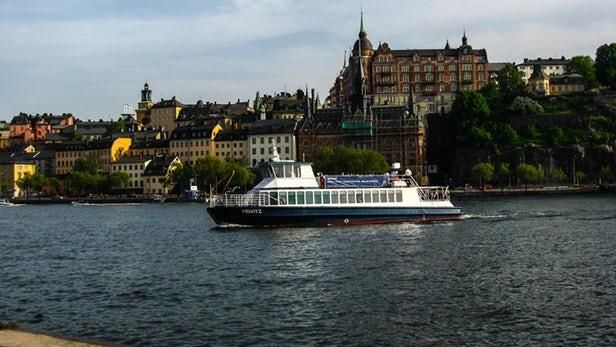
of the total population of the Croatian islands; therefore, including them in the process of implementa-
tion and use of smart solutions, and designing smart solutions based on their specific needs, is critical.
     Enhancing institutional and administrative capacity is necessary to develop and adopt smart
island solutions. It can, in general, be said that islands face challenges that are similar to, although more
pronounced than, those that other levels of subnational government face, regarding institutional and
administrative capacities. This is especially the case for small islands that are administrative units of
their own, with limited local government staff and insufficient capacities, as well as lacking the finances
needed to implement smart solutions. Additionally, due to negative demographic trends as well as un-
favorable population structures and small local economies, it is challenging to find local stakeholders
with the much-needed knowledge and capital to implement smart solutions. Aside from that, public-
private partnerships, as a way to implement smart solutions, are limited at the local level and stakehold-
ers willing to join the partnership, in most cases, must be found outside the local community.
     The provision of digital services is the most immediate challenge associated with ensuring
such technology and knowledge spillover. The digital divide in island societies and unequal access to
information and digital services needs to be tackled to enable the uptake of smart and sustainable tech-
nologies on islands. Together with additional policies and support to the local economy, this could allow
a more efficient and inclusive use of smart solutions, create new opportunities for citizens and business,
boost the growth of innovative SMEs and start-ups, and facilitate the access to markets and sources of
funding12.
     A potential way to begin identifying and developing solutions for some of these key challenges is
the establishment of a multi-disciplinary smart island task force (with local representation) to be put in
charge of creating smart solutions where the primary focus is to overcome the challenges and obstacles
in the everyday lives of island citizens with the purpose of increasing the quality of life for all.

1.2 Opportunities

Islands have the potential to be a living lab for integrated solutions that showcase and boost smart
approaches. As territories that have specific characteristics and constraints not faced on the mainland,
islands can offer important lessons on multiple policy fronts, including efficient and innovative ap-
proaches to energy, transport, circular economy, climate adaptation, multi-level governance and ICT
and for different geographies – cities and towns, rural and mountainous areas. The fact that islands are
faced with different challenges as a result of variations in their size, distance from the mainland, popu-
lation density, legal status and level of fiscal and political devolution, they also present the opportunity
to demonstrate different solutions. Despite their differences though, and as mentioned earlier, islands
are shaped by insularity, which presents challenges as well as strengths. The constraints and limitations
are, in fact, conducive to the emergence of local development paradigms on islands that optimally and
innovatively combine environmental, social, economic and technological solutions underpinned by the
premise of smart, integrated and inclusive natural resources and infrastructures management.13
    The population of islands traditionally coexist with nature and understand issues relating to natural
resource limitations. Today they are increasingly aware of climate change consequences, making their
potential to transition to clean energy and smart ecosystems all the more urgent and obvious. By their

12   Smart Islands Declaration: New pathways for European Islands, Smart Island Initiative, 2018
13   Smart Islands Declaration: New pathways for European Islands, Smart Island Initiative, 2018

Croatia’s islands: Making the most of their territorial capital through smart solutions                    5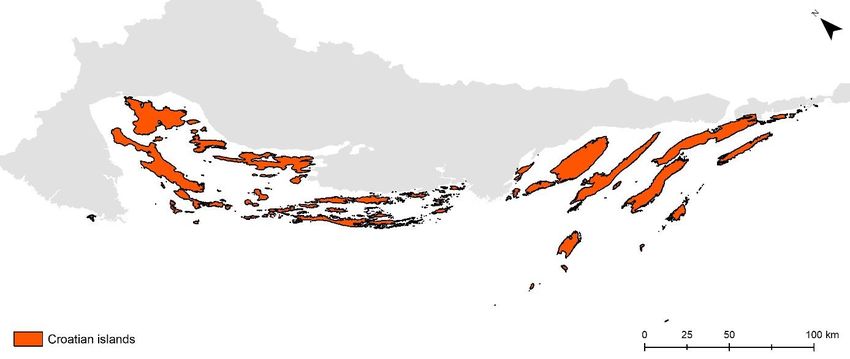
specific characteristics, island economies will increasingly need to close the loop locally to minimize
their carbon footprint and manage increasingly scarce natural resources through renewable energy
sources, smart water management, smart biodiversity preservation methods and other smart and inte-
grated solutions. Islands will increasingly need to begin their clean energy and sustainability transition
by improving the management of infrastructure, natural resources and the environment as a whole, sup-
ported by the use of ICT, all while promoting the use of innovative and socially inclusive governance
and financing schemes. In this way, islands can become, not only self-reliant but also prosperous and
open up to new opportunities for employment, as well as ensuring a high quality of life for their resident
population.14
     Various ICT solutions offer islands new opportunities to better manage their challenges. For
instance, smart infrastructure can improve environmental sustainability, affordability, business climate,
and general liveability. Solutions such as smart water meters and smart electricity grids can reduce usage
and costs by raising awareness among individuals about how much they are using, as well as by auto-
matically reducing consumption at times of limited demand. By collecting large amounts of data and
then translating these data into insights, island communities could be able to greatly boost the efficiency
and responsiveness of their infrastructure operations and manage the operating costs of infrastructure
that will increasingly need to be designed for both peak and non-peak seasonal uses.15
      Recognizing the importance of smart solutions for advancing island development various co-
operation platforms have emerged across Europe with the goal of providing partnership and sup-
port in implementing those types of solutions. One of them is the European Smart Islands Initiative.
It is a bottom-up effort of European island authorities and communities seeking to communicate the
significant potential of islands to function as laboratories for technological, social, environmental, eco-
nomic and political innovation.16 The initiative focuses on seven key areas of intervention: energy,
transport, water, waste, governance, ICT and economy. Additionally, the EU recognizes the importance
of implementing smart solutions for islands. For instance, the European Parliament resolution on the
special situation of islands stresses that digital capacity is a vital means of counterbalancing the physical
connectivity barriers faced by island regions. The resolution also underlines the importance of providing
education at all levels, and where necessary by also making more use of distance education systems.
Lastly, the resolution emphasizes that islands in the EU can contribute to strengthening sustainable de-
velopment in the Union, in particular given their high potential for producing energy from renewable
sources.17
     It is critical to identify a clear financing strategy for investing in smart island solutions and the
institutional capacity and resources available for implementing smart cities solutions. Funding sources
could include national, municipal, and EU funding, as well as from leveraging financial or in-kind sup-
port from the private non-government sectors, including academia and local communities. It is also
worth noting that the EU recognizes the need for an integrated approach in the 2021-2027 multiannual
financial framework, where the main financing mechanisms, aside from the Cohesion policy, would be
Horizon Europe, Digital Europe Programme, InvestEU, and LIFE. Within such financial support, islands
can better manage the challenges they are facing and take advantage of their opportunities by empow-
ering themselves to emerge as living labs for the energy transition, digital transformation, circular econ-
omy and innovative financing and so embark on sustainable and fair development pathways18.

14 Smart Islands Declaration: New pathways for European Islands, Smart Island Initiative, 2018
15 World Development Report 2016: Digital Dividends, World Bank Group, 2016
16
   2nd Smart Islands Forum: EU islands in the post-2020 era, 20-22 September 2018
17 European Parliament resolution of 4 February 2016 on the special situation of islands (2015/3014(RSP))
18 Florou, A., 2018: Proposal from the islands for the new MFF

Croatia’s islands: Making the most of their territorial capital through smart solutions                     6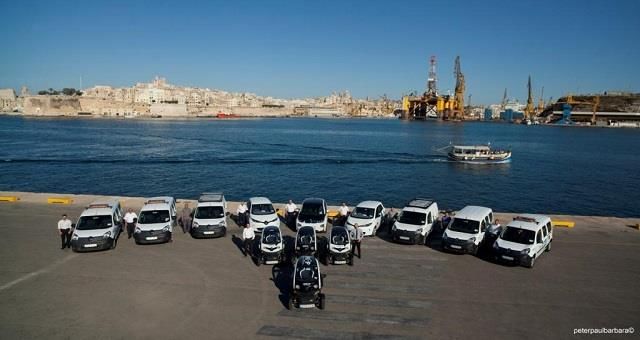
Additionally, the European Parliament's Resolution on the island's special situation points out that
although Croatia’s islands are faced with constraints, they also have territorial potential that should be
used as an opportunity for development, growth and job creation; the resolution highlights the im-
portance of low taxes and the policy for reducing bureaucracy as key incentives for attracting invest-
ment. In this context, apart from seasonal tourism, the development of sustainable tourism, with the
focus on the promotion of cultural heritage and special craftsmanship activities is also mentioned. The
islands also have enormous potential in the production of alternative renewable energy sources - sun,
wind, waves and sea currents. Thus, in the same document, point 11 emphasizes "the enormous potential
of ocean, wind and sun energy, and the ability of the islands (EU islands) become important sources of
alternative energy, as autonomous as possible, and above all, guarantee cheaper energy supply”.

1.3 Best practices

On a global and European scale, there are good examples of smart island approaches worth learn-
ing from; some particularly relevant cases are presented below. There are cases of islands imple-
menting various smart solutions, which differ from smart city solutions in their scale and complexity,
but which have the same aim of making a more efficient use of resources and achieving higher levels of
environmental and social sustainability. Samsoe island in Denmark, for example, has a project known
as Fossil Free Island where they are introducing a number of technologies such as biogas, smart energy
systems, upgraded wind power feeding heat pumps, storage heat and electricity, energy savings, smart
energy systems, and e-mobility (e-vehicles, ferry). Around 70-80 % of financing is obtained through
public-private partnership and only 20% comes from funding or direct subsidy.19
     The Island of Salina, often labelled as ‘the greenest of the Aeolian islands’, has started its clean
energy transition. The island has taken initiatives to promote eco-tourism and initiatives to reduce pol-
lution and environmental degradation and is planning to implement energy efficiency and energy saving
measures particularly in public lighting systems and the heating and cooling of its public buildings.
Further, the municipalities aim to produce energy locally, capitalizing on the island’s abundant renew-
able energy resources of electricity and heat, and to switch their public transport to electric minibuses
powered by solar PV. Charging stations would be available for electric vehicles on the island as well.
These initial plans and activities have been well received by residents, local tour operators and visitors.
     Involving all actors of the local community - including citizens, companies, trade associations, and
tour operators - is a challenge Salina is working to overcome as it advances its energy transition. The
municipalities driving the transition are aware of the shift needed in people’s mindsets in order to choose
clean energy options (such as opting for an electric vehicle for a new car rather than one that runs on
fossil fuel) and plans target education and communications activities to bring the local community on
board.
    The municipality of Palma de Mallorca is currently the second largest “Wi-Fi” city, after Mi-
ami (USA). WiFi Palma is a project run by the Universitat de les Illes Balears on big data and tourism.
The project is being developed in cooperation with the Supercomputing Centre in Barcelona, the most
powerful supercomputer in Spain. To increase its attractiveness as a tourism center, starting in 2014,
Majorcan authorities began to provide free Wi-Fi access across the entire island starting in 2014 thus
aiming to become an intelligent tourism destination. In some areas, work is still underway, but in Palma

19   Smart Islands Projects and Strategies, Issued from the 1st European Smart Islands Forum, Athens, Greece, 2016

Croatia’s islands: Making the most of their territorial capital through smart solutions                              7
de Mallorca, especially in the city center, and on Playa de Palma, people have free Wi-Fi access. The
hotspots were technically improved so that everyone could move around the city without losing connec-
tion. The provision of Wi-Fi on the beach promenade of Playa de Palma aims to identify new trends
(shopping, cultural and sports activities), which will help Palma propose tailored activities for tourists.
The project also has considerable potential for user groups who need special attention (i.e. people with
mobility impairments). Potentially, it may be possible to see whether fully accessible venues (i.e. for
people with disabilities, elderly people using mobility devices, families with baby strollers) are more
likely to be visited than venues which are not accessible to these target groups.
Further good practice examples can be found in Annex | Smart Islands: Best practices – a de-
tailed overview.
Croatia’s islands: Making the most of their territorial capital through smart solutions 82 Development challenges and opportunities of Croatian
islands based on their territorial capital
This section looks in detail at the development challenges and opportunities of Croatian islands
based on their economic, cultural, social, and environmental assets otherwise known as their ‘ter-
ritorial capital’.
In total there are 1244 islands, islets, rocks and ridges in Croatia. Of these, 78 are islands and
524 are islets. They are spread over an area of 31,479 square kilometres, which cover the surface of the
whole interior and territorial sea of Croatia (35.7 % of the total surface area, including land and sea
area). The significance of the Croatian islands can also be seen in the fact that over 70% of the total
Croatian coastal line length (6.278 km) relates to its islands.
In an administrative sense, the Croatian islands are divided into cities and municipalities. That
said, it is worth mentioning that 60% of all islands are administratively parts of cities and municipalities
with center on the mainland on some other island. Such is the case for the cities of Šibenik, Zadar, Pula,
Split, etc., where numerous islands (and settlements on them) are considered integral parts of these ad-
ministrative cities on the mainland. A certain number of islands are within the city or municipality hav-
ing their administrative center on some other island (e.g. Osljak, Sestrunj and Rivanj within the Preko
Municipality). Thus, the analysis of territorial capital cannot include islands that are in an administrative
sense part of mainland cities, as most of the data is available at the level of local administrative units
(LAU). If data for the mainland cities would be considered in the analytical process, the results would
not be representative given the size and development characteristics of those cities. Therefore, this anal-
ysis is limited to looking at the territorial capital of the 50 LAUs that are entirely located on the islands.20
20LAUs included in the analysis are: Baška, Blato, Bol, Cres, Dobrinj, Hvar, Janjina, Jelsa, Kali, Kolan, Komiža, Korčula,
Krk, Kukljica, Lastovo, Lopar, Lumbarda, Mali Lošinj, Malinska-Dubašnica, Milna, Mljet, Murter-Kornati, Nerežišća, No-
valja, Okrug, Omišalj, Orebić, Pag, Pašman, Postira, Povljana, Preko, Pućišća, Punat, Rab, Sali, Selca, Smokvica, Stari Grad,
Ston, Sućuraj, Supetar, Sutivan, Šolta, Tkon, Trpanj, Vela Luka, Vir, Vis, Vrbnik.
Croatia’s islands: Making the most of their territorial capital through smart solutions 9Figure 1. Geographical distribution of Croatian islands
In 2011, there were 132.756 inhabitants on Croatia’s islands, which is 3% of the total popula-
tion of Croatia.21. Out of 78 islands, 47 are permanently settled. There are exceptionally large differ-
ences in the number of inhabitants across the islands, with the largest being Krk, with 19,383 inhabitants,
while the smallest island of Male Srakane has only 2 inhabitants. Aside from Krk, the most populated
islands are Korčula, Brač, Hvar, Rab, and Pag. Looking at the surface area of islands, the largest are Krk
and Cres, both with an area of 406 square kilometers. Following that are the islands of Brač (395), Hvar
(300) and Pag (285). Croatian islands also have differing altitudes, with Brač being the islands with the
highest peak, St. Vid which stands at 780 m.
Figure 2. Largest Croatian islands by population in 2011
25,000
20,000 19,383
15,522
15,000 13,956
Population
11,077
10,000 9,328 9,059
7,587
6,049 5,908
4,895
5,000
0
Krk Korčula Brač Hvar Rab Pag Lošinj Ugljan Čiovo Murter
Source: Croatian Bureau of Statistics, 2018
21 Statistical Yearbook of the Republic of Croatia 2018, Croatian Bureau of Statistics, Zagreb, 2018
Croatia’s islands: Making the most of their territorial capital through smart solutions 10In contrast to the national population, which has seen negative growth since the 1990s, the
population of the Croatian islands increased by circa 3.4% between 2011 and 2017 according to
the estimation of Croatian Bureau for Statistics (2019). 22In the same period the population of Croatia
declined by 4.2 %.
The age coefficient demonstrates the share of the aged population versus the total population. The
age coefficient on the islands in 2011 was around 31%, while the national average was 24%. At the
same time, the aging index, which shows the number of elderly people per hundred young people,
amounted to 171.2 in the islands in 2011. This indicator was considerably higher than the national av-
erage of 115. Therefore, it is noticeable that despite having greater population growth, the islands
do have a more aged population compared to the country as a whole.
Figure 3. Population change of Croatian islands and Croatia 2011-2017
106
104
102
Index (2011=100)
100
98
96
94
92
90
2011 2012 2013 2014 2015 2016 2017
Islands Croatia
Source: Croatian Bureau of Statistics, 2019
Immigration is the key factor in the overall population growth of the islands rather than nat-
ural population increase (childbirth). However, as immigration did not contribute to the increase of
childbirths, some researchers assume that the increase in the number of immigrants can be attributed to
the so called “fictitious population” – inhabitants only registered on islands, but actually living on main-
land.23 Additional studies, focused primarily on individual islands, show that larger Croatian islands,
despite population aging, are potentially attractive destinations for a number of domestic and foreign
immigrants. Although it is difficult to expect a more significant demographic revitalization of the islands
from this immigration, tourism certainly brings new actors to it. Large islands are in a more favorable
position due to the greater number of inhabitants and the greater density of social relations, social and
public services and infrastructure facilities.24
Natural population change on the Croatian islands is negative, with an increasingly negative
trend in recent years similar to the country as a whole. Both Croatia as a whole and islands have
22 Data used for Croatian islands refers to all local administrative units (LAU) located on the islands, including the Peljesac
Peninsula which is considered an island according to the Islands Act (NN 116/18)
23
Lajić, I., Mišetić, R., 2013: Basic demographic processes on the Kvarner islands 1991-2011, Geoadria 18/1, 71-92
24 Marinović Golubić, M., 2017: Immigration to the island - modern migration on the island of Korcula, Migracijske i etničke
teme 33 (2), 115-141
Croatia’s islands: Making the most of their territorial capital through smart solutions 11experienced a significant increase in the number of deaths. However, the number of live births on Cro-
atian islands is pretty much consistent, with only a slight decrease, while the number of births in Croatia
as a whole is rapidly decreasing. Simultaneously, the net migration rate of Croatian islands is positive,
unlike the one of Croatia. However, the net migration rate of Croatian islands has been continuously
decreasing in the last several years.
One of the biggest challenges for the development of the Croatian islands is therefore the issue
of depopulation and aging. Along with the already mentioned problem of the small number of people
living on the islands, the most significant challenge is the availability of workplaces on the islands due
to their geographic distance from the mainland. The lack of young people and the growing number of
emigrants leaving Croatia pose a major challenge for all Croatian islands since smart development is
based on having an educated and working-age population. The decreasing number of local residents
leads to a functional change from a work-residence area to holiday-recreation-retirement area and con-
tributes to the disappearance of many elements of the traditional island economy. The promotion of the
islands as quality living and working areas must be incorporated into all management policies as one
way to overcome this challenge and could be considered a precondition for the islands' economic pros-
perity. At the same time, new and smart strategies are needed to service a declining, dispersed and
increasingly aged population.
Table 1. Natural population change of Croatian islands and Croatia
Area Element 2011 2012 2013 2014 2015 2016 2017
Live births 1.076 1.091 1.034 1.041 1.078 1.015 1.007
Deaths 1.519 1.595 1.557 1.596 1.725 1.699 1.800
Islands
Natural population
-443 -504 -523 -555 -647 -684 -793
change
Live births 41.197 41.771 39.939 39.566 37.503 37.537 36.556
Deaths 51.019 51.710 50.386 50.839 54.205 51.542 53.477
Croatia
Natural population
-9.822 -9.939 -10.447 -11.273 -16.702 -14.005 -16.921
change
Source: Croatian Bureau of Statistics, 2019
Table 2. Population Migration
Area Element 2011 2012 2013 2014 2015 2016 2017
Immigrants 3.694 4.052 4.628 4.637 4.172 3.787 3.874
Islands Emigrants 2.310 2.302 2.788 3.241 3.268 3.354 3.263
Net migration rate 1.384 1.750 1.840 1.396 904 433 611
Immigrants 79.937 77.798 87.218 91.374 87.633 88.737 87.133
Croatia Emigrants 84.102 81.716 92.102 101.594 105.578 111.188 118.932
Net migration rate -4.165 -3.918 -4.884 -10.220 -17.945 -22.451 -31.799
Source: Croatian Bureau of Statistics, 2019
Only 14% of the population living in the Croatian Islands has attained higher education
(amounting to 15,621 inhabitants), yet this number is only slightly less than at the national level.
In comparison to the national level, where the percentage of the population that has attained higher
education is 16.39 %, the islands have only a slightly lower percentage. In the analyzed islands, local
Croatia’s islands: Making the most of their territorial capital through smart solutions 12units have 2.6% of all the country’s population with higher education. The proportion of the highly
educated population varies between islands, which demonstrates the uniqueness of each island. The
largest ratio of highly educated people that make up their total population percentage is in the
municipalities of Omišalj and Trpanj, which have more than 22% of the total highly educated
population. The largest number of islands have a 16% or 17% share of the highly educated population.
The lowest share of the highly educated population is in Pučišća (8.4%) and Nerežišča (7.3%), which
are both located on the third most populated Croatian island, Brac, where the main economic activities
are tourism, agriculture and fishing.
Table 3. Population with higher education
Population (15+ years) Higher education % of higher education
Islands 107 137 15 621 14,58
Croatia 3 632 461 595 233 16,39
% of islands 2,95 2,62 1,8
Source: Croatian Bureau of Statistics, 2012
The population in the Croatian islands has on average in all age groups a higher informatic
literacy than the national level. 25At the national level, average informatic literacy is 57.5%, and on
the islands that rate is 61.7%. However, because of the small number of people that live on the Croatian
islands only 2.85% of all people in Croatia who are informatically literate live on the islands.
In terms of age group, the highest levels of informatic literacy is amongst the 15-24-year old
age group, where it is above 95%. The informatic literacy of the population in the age groups 10-14
and 25-30 years is slightly lower but is still over 90%. In the same age groups, informatic literacy on the
national level is a bit lower and as can be seen in figure 7, the percentage in the age group between 10
and 14 years is 91% and between 25 and 30 years is 90%. Informatic literacy in the population of Cro-
atian islands is gradually and continuously decreasing in older age groups as well as at the informatic
literacy of elderly at the level of Croatia. The working-age population between 15 and 65 years old has
an average information literacy of 68.8 % and is drastically lower in the three oldest groups of the pop-
ulation. In the last two age groups, the population’s informatic literacy it is lower than 10%.
However, a slightly lower percent of island households (at 50.3 %) has a personal computer
compared to the national average of 55.3%. Out of the total number of households in Croatia who
own a computer, 2.8 % are in cities. In comparison, 51.6% of households in Croatia that own personal
computers are in the 17 largest cities.
25Informatic literacy (defined as the ability to use computers and computer programs), is a key component of the labor mar-
ket and today's economy, and especially required for certain branches of the tourist industry.
Croatia’s islands: Making the most of their territorial capital through smart solutions 13Figure 4. Population by age using the internet on islands and in Croatia in 2011
100
90
80
70
60
%
50
40
30
20
10
0
10 - 14 15 - 19 20 - 24 25 - 29 30 - 34 35 - 39 40 - 44 45 - 49 50 - 54 55 - 59 60 - 64 65 - 69 70 - 74 over
75
ISLANDS CROATIA
Source: Croatian Bureau of Statistics, 2012
There is only a small number of university students living on the islands. There are fewer than
4,000 university students in the analyzed islands, accounting for 3.1% of the island population. More
than 147,000 students were enrolled in professional and university studies in Croatia in 2017, with only
2.6% of these being in the analyzed islands. In the period between 2011 and 2017, the number of students
on the analyzed islands that enrolled in universities decreased by 6% compared to 2011. Observing the
ratio of enrolled students and the number of inhabitants, 31.26 students per 1,000 inhabitants are enrolled
on the islands, while the average at the Croatian level is 34.43 students per 1,000 inhabitants.
Government quality and transparency on the islands, as measured by the publishing of public
documents and documents of major importance, is below the national average. In the context of
local governance quality and transparency, the Institute of Public Finance conducts research on the
transparency of the work of local and county authorities across Croatia. The research is based on the
number of publicly-published documents relating to the budget and the work of local bodies. Measured
by the number of published documents, the average transparency of the budgets of local self-government
units in Croatia is improving from year to year, so in the last four cycles, it almost doubled from an
average of 1.8 to 3.52 published documents (values are from 0-5). With an average level of transparency
of 3.28, LAUs on islands are below the national average, suggesting that public documents and docu-
ments of major importance for the development of local communities are not as easily available to island
citizens. Out of a total of 50 LAUs on islands, 8% scored 0 in 2018, while an additional 38% of them
were below the national average. This data indicates that local governments on islands must put signif-
icant efforts in increasing the transparency of their work.
In recent years, island LAUs have achieved a positive budget execution. In terms of budget reali-
zation, in 2016 the average budget surplus in island LAUs was 204,993 kunas per capita. However, there
are significant differences amongst the LAUs, with Smokvica having a surplus of 4,092,78 knpc, while
on the other hand, Pag had a budget deficit of -3,130,27 knpc.
Table 4. Budget transparency of island LAUs in 2018
Score Number of LAU % of LAU
0 4 8,00
1 3 6,00
Croatia’s islands: Making the most of their territorial capital through smart solutions 142 5 10,00
3 11 22,00
4 17 34,00
5 10 20,00
Islands 3,28
Average
Croatia 3,52
Source: Institute of Public Finance, 2019
Two key challenges of introducing smart solutions on Croatia’s islands are a lack of local
regulations and guidelines for these; and a lack of coordination in implementing planned ICT
projects. Furthermore, local authorities often lack the agile, open and inclusive forms of governance
that would allow innovation to happen. Also, they lack the tools and approaches to involve local com-
munities, non-government entities, and the private sector; these are all issues that need to be addressed
and solved in order to fully implement smart solutions.26
The lack of digitally available services affects the quality of life on the islands. Local islands
authorities are characterized by a low level of provision and use of public e-services and their poor
adaptation to the needs of individual users, as well as by the insufficient efficiency, efficacy, transpar-
ency, and accountability of authorities in the implementation of public policies related to the provision
of public services.27 In island communities, there is a relatively small number of existing digital services
related to communication between citizens and local authorities on social services such as health, edu-
cation, culture, etc. It is also important to emphasize the lack of monitoring and prevention system re-
lated to natural disasters that many islands are exposed to, especially due to climatological changes and
seismological conditions. Wildfires in recent years exemplify how such impacts have posed a specific
threat to communities and tourism.
In order to retain the population and improve the quality of life on the islands, improvements
in basic services such as education, health care, and others are critical and necessary for the fur-
ther development of the island economy. One of the indicators of the education system is the number
of kindergartens and the number of enrolled children in these kindergartens. On the Croatian islands in
2018 there were 72 kindergartens, which is an increase of 3 preschool institutions compared to 2013.
These 72 kindergartens account for about 4.2 % of all kindergartens in Croatia. While only 2.92% of
the Croatian population lives on the islands, there are 4.2% of kindergartens and other legal entities
implementing preschool education programs on them. This is due to the geographical characteristics of
islands and their separation from the mainland as well as the separation between them – a large number
of islands and settlements on them requires an increased number of kindergartens per capita due to the
inaccessibility of those institutions to nearby mainland towns or nearby islands. During 2014, in the 69
kindergartens there were 3,392 children enrolled, and just as the number of kindergartens has increased,
so has the number of enrolled children, growing by 15.5 % in the observed five-year period.
The number of pupils enrolled in elementary school in the islands grew by 5.42% since 2011,
which is a positive trend, especially in comparison to the national level where during the same
period the number of pupils enrolled fell by 7.11%. On Croatian islands, there are 93 elementary
schools with 8,212 pupils enrolled as of 2017. The share of pupils that are enrolled in elementary schools
on islands represents 2.6% of all elementary school pupils in Croatia. In 2017 there were 2,094 pupils
26 The smart city sector in Croatia, Flanders investment & trade market survey, 2017
27 e-Croatia strategy 2020, Ministry of Public Administration of the Republic of Croatia, 2017
Croatia’s islands: Making the most of their territorial capital through smart solutions 15enrolled in upper secondary schools, which is a decline of -18,68 % in comparison with 2011. In 2017
only 1,4 % of all upper secondary school pupils were enrolled in secondary schools on islands, which
indicates a need to strengthen the system of secondary schooling on islands, as some families decide to
move to mainland in order to have more accessible secondary schools for their children. The develop-
ment of secondary education, especially vocational education, would contribute to the island's popula-
tion, but also to the diversification of the island's economy, and potentially to the strengthening of en-
trepreneurship.
Table 5. Kindergartens and schools on Croatian islands in 2011 and 2017
2011 2017 2011 2017
Change (%) Change (%)
Kindergartens Institutions Children
Islands 69 72 4,35 3.392 3.918 13,43
Croatia 1.513 1.715 13,35 127.028 139.228 9,60
% islands 4,56 4,20 -0,36 2,67 2,81 0,14
Elementary schools Schools Pupils
Islands 94 93 1,08 7.790 8.212 5,42
Croatia 2.073 2.030 -2,07 340.116 315.942 -7,11
% islands 4,53 4,58 0,03 2,29 2,60 0,31
Upper secondary schools Schools Pupils
Islands 36 37 2,78 2.575 2.094 -18,68
Croatia 715 744 4,06 183.807 155.642 -15,32
% islands 5,03 4,97 -0,60 1,40 1,35 -0,05
Source: Croatian Bureau of Statistics, 2012
Recent research on the availability and geographic distribution of social and public services in Cro-
atian islands shows that spatial-development processes of Croatian islands are manifested through the
polarization of population and littoralization. When it comes to the island area of Croatia in the context
of the national network of central settlements, it is evident that on islands there are no settlements of
higher-ranking centrality other than the weaker subregional centers. By analyzing the distribution of the
functions and services of island settlements, it can be concluded that some settlements, parts of the island
or entire islands are sub-capacitated in terms of the basic functions/services such as education, health
care, etc. and gravitate to a greater or lesser extent to the neighboring island or mainland center. This
issue needs to be considered from the aspect of the quality of life of the local population on the islands
and as one of the most influential factors of emigration from islands where basic services and functions
are lacking.28
Modern technology is a tool that can be used to overcome the challenges of unequal access to
economic and social services in Croatia’s islands. Various services are nowadays easily available
through the use of the broadband Internet and modern technologies. The right for education and health
care are fundamental rights guaranteed by the Constitution and can be upgraded and rationalized through
28Marinković, V., 2018: Identifikacija prostorno-razvojnih trendova hrvatskih otoka analizom opremljenosti naselja central-
nim funkcijama, Sociologija I prostor, 56, 210 (1), 3-34.
Croatia’s islands: Making the most of their territorial capital through smart solutions 16the development of educational and health digital platforms. Modern tools thus contribute to social co-
hesion and eliminate spatial barriers, which is of great importance for the island population.
Social welfare, taking into account the poverty risk rate, is lower on the analyzed islands. In
the analyzed islands, the poverty risk rate in 2011 was 25.43%, which was significantly higher than the
national average of 21.10%. Poverty risk rates differ significantly between the islands; in the best posi-
tion is Municipality Blato at a rate of 5.97%, while the Municipality Pašman is in the most unfavorable
position with a poverty risk rate of 29.01%.
The number of doctors who permanently reside in the general hospitals in the Croatian is-
lands is very small. In the Mali Losinj and Supetar municipalities, there are only ten hospital beds and
one doctor practicing general medicine. In Mali Losinj, a special hospital for physical medicine and
rehabilitation has 200 beds and five specialist doctors (Croatian National Institute of Public Health,
Annual publication 2017). The health insurance on the islands under compulsory health insurance is
carried out by the Croatian Compulsory Health Insurance Agency through 107 contracted teams of Gen-
eral Family Medicine, 5 contracted health care teams for preschool children, 9 teams for health care for
women, 64 multidisciplinary dental healthcare teams, 10 emergency medical emergency teams, 17
emergency medical teams, 21 health care teams, 12 emergency medical teams, 3 emergency medical
teams, 8 emergency medical emergency teams, 3 healthcare team. Patronage's health care is imple-
mented by 41.5 teams, and the health care of the patients in the house is carried out by 28 teams. There
are also 28 pharmacies on the islands. Specialist-conciliar health care is implemented by 4.5 teams of
internal medicine; 4,7 Physical Medicine and Rehabilitation Teams; one team of general surgery; 2.6
teams of ophthalmology; 0.5 teams of urology; one team of orthopaedics; a team of orthodontics; 4.3
teams of radiology; one team of clinical cytology; 0.6 teams of medical biochemistry and 4 physiother-
apists of physical therapy at home (Plan and program of health protection on islands, 2007).
The main economic activities on the Croatian islands originate from their natural resources
and human adaptation to these natural resources. Along with tourism, which is the main economic
activity of the islands, trade, small shipbuilding, fishery, and agriculture are the dominant economic
activities. While agricultural land accounts for only 6 percent of the total island area, island products are
characterized and known for their high quality.
The Adriatic Sea, as an integral part of the Croatian islands, is considered to be the most
valuable territorial capital for islanders. It has been an important source of natural resources for cen-
turies as well as a medium for communication and the exchange of goods, technology, and knowledge.
It contributes to high tourist attractiveness and the islands’ economic orientation. At the same time, it is
a medium that separates and connects. Although the Croatian islands represent about 6 percent of the
land territory of the Republic of Croatia, the islands determine the territorial sea, which accounts for
almost 37 percent of the total area of Croatia.
Croatian islands have a work-age population of 107,000 inhabitants, of which 41.3% are em-
ployed, which is almost the same percentage of people that are employed at the national level (41.4
%). Given the small number of people living on the islands, the share of the employed population of the
island on the national level does not deviate from that figure; only 2.95% of the employed population in
Croatia works on the islands. A positive characteristic of the labor market of the Croatian islands is the
smaller rate of the unemployed working population in the period between 2014 – 2016 which was 10.5
% then that of the national level, where the rate of unemployment is 17.83 %.
The economic structure in today's island lacks diversification, with tourism being the domi-
nant economic sector. Activities closely related to the tourism sector employ the largest share of the
inhabitants of the Croatian islands; within this, activities tied to accommodation and food services ac-
count for about 18%, which is a lot higher than the national level wherein the same activities employ
Croatia’s islands: Making the most of their territorial capital through smart solutions 17only 6% of people. Retail and wholesale trade represent the second most important activity on the islands
and employs 13% of workers. Tourism has the biggest and most important role in the economy of the
islands in terms of employment. After tourism, activities in the primary sector, which on the islands
include agriculture and fishing, employ the biggest percentage of working people at around 11%. This
is higher than the nation level where 6% work in the primary sector. Manufacturing employs the largest
number of people nationally (16%) but considering the significantly different structure of the islands’
economy, the share of workers employed in these activities on the islands is significantly lower (6%).
Almost the same share of employees work in transport and storage activities, as well as construction
activities in the islands (7%) and at the national level (6%). As for rest of the activities, the biggest
percentage of the population is employed in public administration (6%), education (6%) and human
health and social work activities (5 %) (Table 6).
Table 6. Structure of the labor market on islands and on the national level in 2011
% islands in
Activity Croatia Islands
totally employed
A Agriculture, forestry and fishing 5,31 11,38 6,32
B Mining and quarrying 0,52 0,86 4,93
C Manufacturing 16,90 9,30 1,62
D Electricity, gas, steam and air conditioning supply 1,10 0,93 2,50
E Water supply, sewage disposal, waste management, and en-
1,51 2,79 5,46
vironmental remediation activities
F Construction 7,64 6,72 2,59
G Whole sail and retail trade 15,71 13,39 2,51
H Transportation and storage 6,01 7,08 3,47
I Accommodation and food service activities 6,10 17,61 8,51
J Information and communication 2,80 0,82 0,87
K Financial and insurance activities 3,03 1,43 1,39
L Real estate activities 0,35 0,51 4,37
M Professional, scientific and technical activities 4,26 2,67 1,85
N Administrative and support service activities 2,61 2,59 2,92
O Public administration and defence 8,18 6,24 2,25
P Education 7,04 5,83 2,44
Q Human health and social work activities 6,75 5,25 2,29
R Art, entertainment and recreation 1,79 2,01 3,32
S Other service activities 1,97 2,12 3,16
T Activities of households as employers, household activities
that produce different goods and perform various services for 0,11 0,08 2,14
their own needs
U Activities of extra territorial organizations and bodies 0,04 0,01 0,48
Unknown 0,27 0,36 3,85
Source: Croatian Bureau of Statistics, 2012
Croatia’s islands: Making the most of their territorial capital through smart solutions 18Figure 5. Labor market characteristics of Croatian islands in 2011
Administrative and
support service Other
activities 9%
Professional, scientific 3%
and technical activities Accommodation and
3% food service activities
Water supply, 18%
sewerage, waste
management and
remediation activities
3%
Human health and Wholesale and retail
social work activities trade, repair of motor
5% vehicles and
motorcycles
Education 13%
6%
Public administration
and defence,
compulsory social Agriculture, forestry
security and fishing
6% 11%
Construction
7%
Transportation and
storage Manufacturing
7% 9%
Source: Croatian Bureau of Statistics, 2012
Considering that tourism makes up a significant portion of the islands’ economies it also has
greater economic, socio-cultural and ecological impacts on the islands. The size and importance of
tourism for the islands are best reflected in the number of tourist arrivals and overnight stays, which has
steadily increased over the past five years. During 2018, more than 3.3 million tourists visited the Cro-
atian islands which, is a 5.4% increase compared to 2017. The number of tourist arrivals has been con-
tinuously increasing in the observed five-year period; the number of tourists increased by a total of 30%
in 2018 compared to the number of arrivals in 2014. In the same period, the number of tourist arrivals
at the Croatian level increased by 43.3%. The share of tourist arrivals on islands, out of the total number
of arrivals in Croatia, is continuously decreasing in the observed five-year period; in the year 2018,
18.44% of the total number of tourists in Croatia were visiting and staying on islands. Foreign tourists
in Croatia account for a significantly higher number of arrivals (89.3%) than domestic tourists (10.7%),
but the share of foreign tourists is even more pronounced on the islands, accounting for 91.4% of the
total number of arrivals while domestic tourists make up only 8.6% of arrivals.
Croatia’s islands: Making the most of their territorial capital through smart solutions 19Figure 6. Number of tourist’s arrivals on islands
20 20.0
18
19.5
Percentage of islands
16
Arrivals in milioms
14
19.0
12
10 18.5
8
18.0
6
4
17.5
2
0 17.0
2014 2015 2016 2017 2018
ISLANDS CROATIA % OF ISLANDS
Source: Croatian Bureau of Statistics, 2019
Between 2014-2018, the number of overnight stays on Croatian islands increased by 25.5%
(Figure 13). In the area of the Croatian islands, over 21 million overnight stays were recorded in 2018,
representing an increase of 2.94% compared to 2017. In comparison, in 2014, when the tourism sector
in Croatia was recovering from the economic crisis, some 17 million overnight stays were recorded. In
total, on the national level, the number of overnights in the observed period increased by 35.4% which
is, as can be seen, 10% more than on the islands. During 2014, about 25.5 % of all tourists’ nights in
Croatia were recorded on Croatia islands, but in 2018 this percentage fell down to 23.7%.
Figure 7. Number of tourist’s nights on islands
100 26.0
90
25.5
80 Percentage of islands
70 25.0
Nights in millions
60
24.5
50
24.0
40
30 23.5
20
23.0
10
0 22.5
2014 2015 2016 2017 2018
ISLANDS CROATIA % OF ISLANDS
Source: Croatian Bureau of Statistics, 2019
If comparing the number of nights spent in a location per individual arrival that were rec-
orded in the islands versus at the national level, visitors to the islands stay an average 1.5 days
longer. During the summer of 2018 tourists spent 6.3 days on average vacationing on the islands, while
at the national level they stayed 4.8 days. In the last five years, the length of the tourist visiting period
has decreased by 0.3% at both the national level and on the islands.
Croatia’s islands: Making the most of their territorial capital through smart solutions 20You can also read