CTU Monthly Economic Bulletin - No. 219 (April 2020) - New Zealand Council of Trade ...
←
→
Page content transcription
If your browser does not render page correctly, please read the page content below
CTU Monthly Economic Bulletin
No. 219 (April 2020)
A Wellbeing Budget for Covid-19 times

Summary
In the third Wellbeing Budget on May 14, which will respond to the effects of the Covid-19
lockdown, at least the following items are vital to ensure the New Zealand economy does not
continue to be low wage, low productivity, high rent and high carbon:
* Support for industry that commits to paying at least living wage rates
* Plans for retaining and redeployment of displaced workers
* Initial steps on social insurance
* Increased building of affordable rental and owner housing.
* Individualising and increasing benefits
* Reducing abatement levels and raising thresholds for Working for Families
* Increased numbers of Labour and Worksafe inspectors
* Increased funding and a plan to manage the health backlog – both pre and post Covid-19
* Increased funding and ensuring that He Ara Oranga can adequately cope with the mental
health issues associated with increased unemployment and poverty
* Additional funding for social service NGOs with massively increased demand but reduced
philanthropic funding
* Ensuring that all income received is taxed – whether from a closely held company or a rental
property.

While the official indicators have a lag, what is interesting is that the share market, bond market
and house prices are either currently not falling or not by as much as could be expected from the
severity of the lockdown.

1                                                          CTU Monthly Economic Bulletin – April 2020
In the prehistory that was life before lockdown, May was a big month in the life of a Government
because that was when the Budget was read.
This year May 14 – in Wellington anyway - could well be overshadowed by the decision to move
from Level 3 to Level 2. A time that I am hoping will get me out of my living room and zoom
screen and back with my colleagues – albeit appropriately physically distanced with lots of hand
washing and hand sanitiser.
The past two Budgets have been hailed as Wellbeing Budgets with liberal use of the Treasury’s
Living Standards Framework. Although arguably all Budgets are put together with an intention of
enhancing the wellbeing of its people – at least as perceived by the incumbent Minister of
Finance.
Before I came to the CTU, I was engaged by a Government agency to put together a Budget bid
for them within the Wellbeing Framework. In that Treasury required agencies to demonstrate
how wellbeing would be improved by the measure.
The touchstone Treasury encouraged was “How will this spending improve the lives of people in
New Zealand’.
For example, it was not enough showing the proposed spending would - say – cut surgery waiting
times; the agency needed to set out the flow on benefits. In the case of health spending, ability
to regain employment, reduced depression, and greater connection with the community were
the actual outcomes the Government was buying – the reduced surgery waiting times were the
means to an end.1
While this, and the associated CBAx spreadsheet, might not be everyone’s cup of tea I was
impressed as it helped move the analysis away from ‘what is the cost to Government’. When of
course the Government is the people of New Zealand and the idea that the Government can
‘save’ money in the social sector without a downstream cost is nuts.
And all too often cuts, or lack of social spending, mean that costs are simply pushed down to
those who can least cope. Hardly improving the lives of people in New Zealand.

The Minister of Finance, in December 19, set out the Government’s 5 key priorities.
While they were set in a pre-Covid world – as they were based on the long-term challenges
facing us as a country – they are all still super relevant.

       •    Just Transition – Supporting New Zealanders in the transition to a climate-resilient,
            sustainable, and low-emissions economy
       •    Future of Work – Enabling all New Zealanders to benefit from new technologies and lift
            productivity through innovation

1   This is just an example. I was not engaged by the Ministry of Health.
2                                                                           CTU Monthly Economic Bulletin – April 2020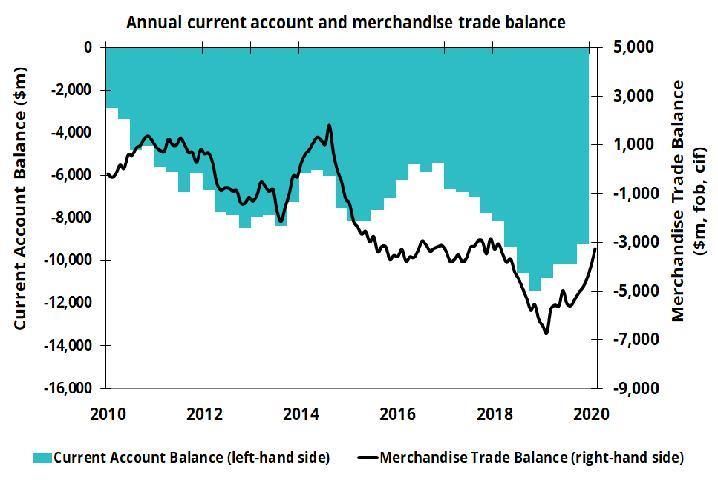
•   Māori and Pacific – Lifting Māori and Pacific incomes, skills, and opportunities
    •   Child Wellbeing – Reducing child poverty and improving child wellbeing
    •   Physical and Mental Wellbeing – Supporting improved health outcomes for all New
        Zealanders

These priorities now bear down in a world where the best case outcome post- Covid is 8%
officially unemployed.
As this is twice what it was in December 19 , doubling the other underutilisation indicators this
also could mean:
    •   225,000 people without any paid work;
    •   180,000 people without enough paid work;
    •   160,000 who want paid work but currently have other obligations or are discouraged; and
    •   150,000 young people not in education employment or training.

And again – this is the best case from Treasury scenarios with a 20 billion additional stimulus.
These numbers are also not gender neutral.

Unemployment and underutilisation pre -Covid were structurally higher for women than men –
132,000 men were underutilised compared to 167,000 women. So that gap of 35,000 could now
double to 70,000 more women ‘underutilised’ if all the other indicators followed in the same way
as the unemployment possibilities.
Covid has also shown the key role women play in the essential economy with over two thirds its
workers – often in minimum wage roles. And with women’s traditional caring roles now needing
to happen alongside their responsibilities in paid work, it will be interesting to see in the time
ahead whether women’s careers suffer disproportionately to men’s.

At this stage I have not looked at the effect on Māori and Pasifika. I will endeavour to apply this
lens when the next set of Labour Market Statistics come out next month.
Applying all these factors to a post-Covid world – this is what the Council of Trade Unions (CTU)
would like to see in Budget 2020:

Just Transition
Just Transition needs to now be broader than ‘just’ emissions and carbon.
Going into lockdown, New Zealand was a low wage, low productivity, high rent and high carbon
economy. With the loss of international tourism, export education and the flow on affects to

3                                                           CTU Monthly Economic Bulletin – April 2020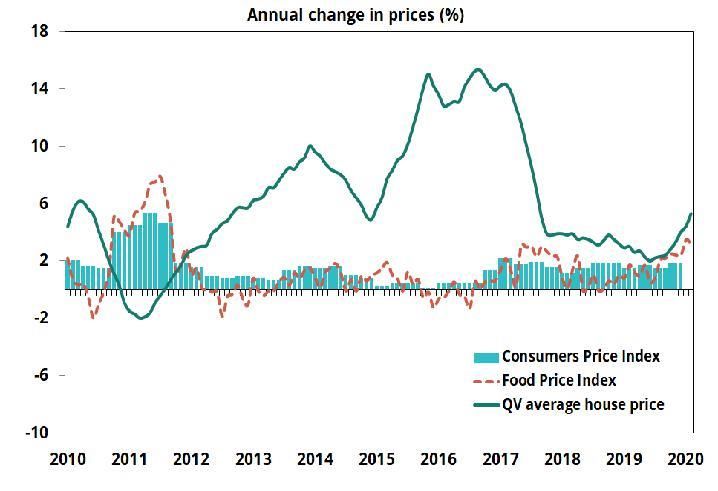
retail and hospitality the challenge is to absorb the people displaced but in a way that doesn’t
drive down wages or further entrench business models based on the minimum wage.
The CTU is supportive of assistance to business following the period of the wage subsidy but only
if it is linked to a commitment and a plan for industries to move to at least a model involving
paying living wage rates.
We also wish to see Industry Transformation plans developed between Business, Unions,
Government and Iwi to finally move us as a country to the high value add economy I have been
promised since the days of Roger Douglas.

There will be a lag and that is where Government commissioning work that will benefit us all
should come in.
A great example is the current Green Party proposal for increased nature based jobs, although
we would want them paid at, at least, living wage rates. But not everyone can or would want to
work outside. Maybe the Government could also increase levels of teacher aides or simply pay
people to read to children and help them with their reading – particularly in low decile schools.
Hospitality and retail, far from being low skilled, require similar interpersonal skills.
Another option could be a temporary extension of paid parental leave to anyone caring for a
child under the age of 3. At a time of high unemployment, this could be a mechanism to reduce
the paid labour force and instead support caring work that is often unpaid.

We would also hope that ‘shovel-ready’ projects ended up being projects other than roads and
have a greater commitment to public transport and large-scale affordable housing developments
including affordable rentals. With these projects, it is also important to apply a gender lens in
case these initiatives further exacerbate the current female/male employment and pay
disparities.

Future of Work
The future arrived on 26 March 2020 when the Prime Minister shut down the ‘non-essential’
economy.
Now it is time to turbo charge the Future of Work agenda. It is great to see that some in the
hospitality industry now looking ahead at this although, again, a commitment to, at least, a living
wage is vital in any change programme.
Key in the Future of Work are Industry Transformation plans discussed above as well as Active
Labour Market policies and Social Insurance. Active Labour Market policies complement Industry

4                                                          CTU Monthly Economic Bulletin – April 2020
Transformation plans through redeployment and retraining of displaced people. The recent
announcement by the Government on its Rapid Response teams is a good start.

Social Insurance could be funded by some combination of employer, employee or taxpayer and
provide an adequate income support cushion for workers in times such as these where they find
their jobs disappear underneath them.

Māori and Pacific

As with the previous discussion with women, the pre-Covid 19 world involved significant income
and wealth disparities between Pākehā, Māori and Pasifika. Therefore, it is important that the
effects of colonisation and structural racism feature in any analysis and that solutions are Iwi and
Pasifika led.

Child wellbeing
At the root of child wellbeing is family or parental wellbeing. So, all the measures discussed
above that keep parents in work or support their incomes are vital to child wellbeing.
But in addition:
    •   Benefits need raising and paid according to individual incomes rather than based on the
        household income;
    •   Abatements and thresholds for Working for Families need lowering and raising
        respectively;
    •   At a minimum, the in-work tax credit should be continued while a parent is actively
        looking for paid employment. Although being folded into the generic Family Tax Credit is
        preferable.

The reduction in export education also needs to be fully compensated for in the education
sectors budgets.
It would be also good if the concept of child-wellbeing is extended to ‘young people’.
It is heartening to see that the Prime Minister is concerned about intergenerational equity and
the effects this recession has on the them. I was a young person during the 1987 recession, lost
my job twice without redundancy as well as two years savings – so I am personally always very
attuned to the young person impact. In Europe the effect has been significant for some cohorts.

5                                                           CTU Monthly Economic Bulletin – April 2020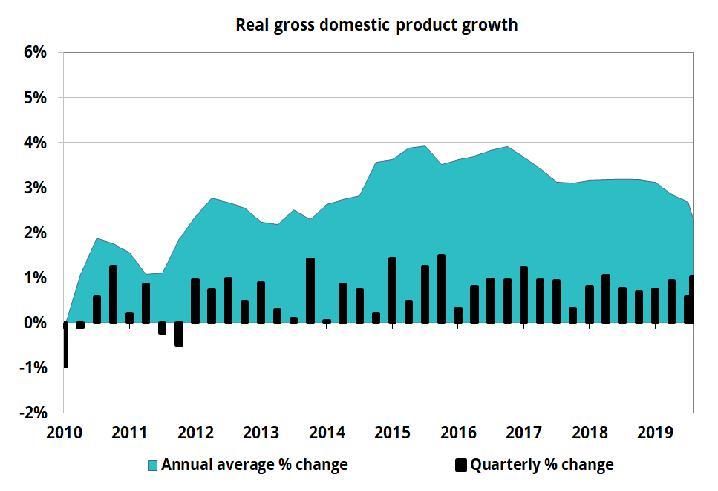
Physical and mental wellbeing

This has become even more important. Three additional areas are now key:

      1) A plan and funding for managing the health backlog from Covid-19. These include:
             • increased funding to public health to manage the threats of epidemics and
                ongoing threat of covid-19
             • funding and planning to meet health needs due to operation cancellations and
                hospital specialist referrals as a result of lockdown

      2) A plan and funding for the adverse affect on mental health from the lockdown and then
         increased unemployment and hardship.
      3) Statutory sick leave paid to employees – say 14 days needed to recover from Covid-19.
         Now more than ever there is a benefit to society from people staying home when they
         are sick.

And this is all on top of the gap in funding of $2.5 billion in 2019 dollars and the continuing need
for:

      •   Additional primary health care funding –to meet increased pharmacy, GP and primary
          health services and dental health needs
      •   Continued funding and planning for replacement of run-down health service facilities,
          hospital and poorly maintained infrastructure.

Other issues

Tax

While now may not be the right time to raise taxes. It is the right time for planning for a more
progressive tax system and greater transparency. It is also the right time to ensure the tax rules
apply evenly.

All personal income should be taxed according to the personal tax scale. This would be the
perfect time to remove income splitting opportunities through trusts or the ability to take regular
income from companies by way of loans.

It would also be the perfect time to ensure all forms of income are taxed. In the past capital gains
were brought into the tax base not because they were capital gains but because they are readily
substitutable or equivalent to taxable income. It is time to again focus on this aspect of tax policy

6                                                           CTU Monthly Economic Bulletin – April 2020
and lose the ‘taxing capital gains’ narrative. This could include extending the bright-line test or
equivalent as well as looking at applying this to other asset classes.

The Tax Working Group also made recommendations on collecting tax debt that should also be
implemented. Directors of companies where they have an economic interest should become
personally liable for the PAYE and GST tax debt of their companies.

Labour Market and Health and Safety enforcement

During this difficult period, the CTU and affiliated unions are receiving an increased number of
complaints about employment and health and safety breaches by employers. We would like to
see the resource provided to the Labour Inspectorate and Worksafe increased with an associated
increase in enforcement capacity.

Pay equity settlements – caring professions

While the lockdown put a pause on work to settle and progress pay equity claims we will be
looking for funding in Budget 2020 for pay equity settlements. The real value of women’s work
could not have been more evident than in the last several weeks and thousands of these women
have worked through the lock down or are in the group of workers first back to work coming out
of Alert Level 4.

All these measures are important for the wellbeing of the people in New Zealand. Whether it is
their ability to participate in paid employment, care of their families or simply be well.

Because recessions do not affect people equally.

Max Rashbrooke talks of it being a ravine.
Some people can use their resources to build a bridge and hop over it while others sink to the
bottom and struggle to get out. Our objective as a country needs to build up the bottom for
those that have fallen and maybe make any bridges a little more expensive for those who can
afford them.
Because to date, as seen in the next section, while labour is taking a big hit – the share market,
the bond market and house prices; not so much.
And while we are doing this, we also need to keep the – formerly known as – essential workers
front of mind. They all need (at least) a living wage and a fair pay agreement.

7                                                            CTU Monthly Economic Bulletin – April 2020
In the meantime, I hope you all can enjoy the benefits of Level 3 – whether it is returning to paid
work, slightly extending your bubble or simply getting takeaways and/or a decent coffee again.

As always, I welcome feedback to andreab@nzctu.org.nz.

Kia Kaha
Andrea

The NZIER consensus forecast was released on 16 March 20202.

        Annual Percentage Change (March Year)                        2019/20       2020/21      2021/22      2022/23

        GDP                                                            1.92          2.06          2.9          2.5
        CPI                                                             2.2           1.8          2.0          1.9
        Private Sector average hourly wage                              3.4           3.0          3.3          3.0
        Employment                                                      1.3           1.3          1.8          1.5
        Unemployment rate (% of labour force)                           4.2           4.4          4.3          4.2

2I have attached this for completeness as it wouldn’t be a CTU Economic Bulletin without it. But 16 March 2020 is now
prehistory.
8                                                                             CTU Monthly Economic Bulletin – April 2020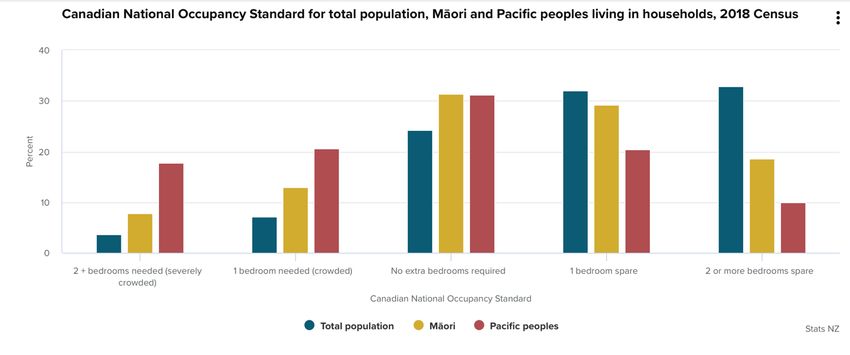
Economic Indicators – Covid-19 style
The Treasury and Stats NZ have both started publishing dashboards of indicators on the New Zealand
economy. So, I thought I would do the same but with a working people/inequality lens.

    1) The first one, for context, has to be scale of the wage subsidy. Thank you MSD. $10 billion and 1.4
       million employees at 17 April.

9                                                              CTU Monthly Economic Bulletin – April 2020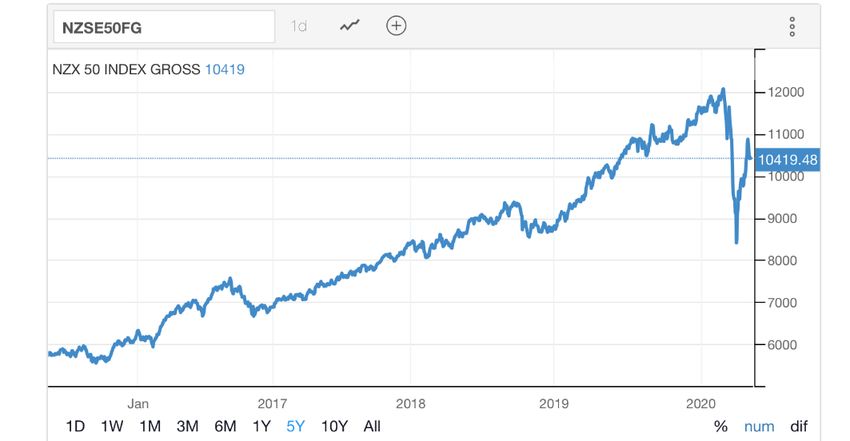
2) Claimants of Jobseeker support.

Not included is anyone who has a partner who earns slightly less than the fulltime minimum wage but
even allowing for that - 40,000 more people than at the same time last year.

       3) Rent, food and CPI.

As at March 2020 a week or so into lockdown3 – everything is still going up. March year on year, CPI has
increased by 2.5%, rent by 3.4% annually and .3% for the month of March, much the same increase as in
the month of February. Food annually increased by 3.3% with an increase in March of 0.6%.
These increases were before the oil price collapse so it will be interesting to see its effect in subsequent
months.

3   Although this could well have been measured before lockdown.
10                                                                 CTU Monthly Economic Bulletin – April 2020
4) Household Living Cost price index.
As at March the gap between the high and low- income cohorts continues to increase. As in past months,
this is due to rents having a higher weighting on the low-income cohort and low interest rates benefiting
the high income people.
5) The share market
While the sharemarket has indeed fallen, the New Zealand index NZX50 recently recovered a degree of its
fall and now sits at a level comparable to this time last year.
11 CTU Monthly Economic Bulletin – April 20206) Bonds
For bonds, usually it is the yields that are tracked rather than the price of the bonds and so it can be
difficult to find out what is happening to the price. As a proxy I am looking at the exchange traded fund
for New Zealand bonds. Note it is only slightly down from its 2019 peaks.
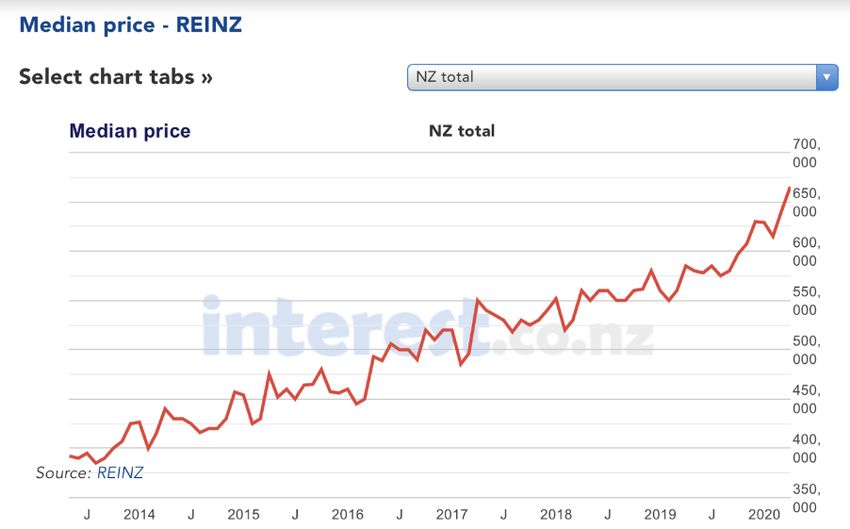
7) House prices
Also up.
The final piece would be the capital value of unlisted businesses but I am not aware of that information
being published anywhere.
12 CTU Monthly Economic Bulletin – April 2020While the share, bond and house prices may yet fall – or fall further - it is very interesting and I hope not an indicator of that – as Bill English suggested – something is amiss. And while not an indicator, this interesting survey from Stats NZ came out this month. While it shows quite distressing levels of overcrowding in housing – it also shows that 65% of the population has at least one bedroom more than they need. This is the compatible with the analysis from Kay Saville – Smith that until at least 2017 the houses being built were catering to the top end and were unaffordable for those on low or median incomes. Notes This bulletin is available online at http://www.union.org.nz/economicbulletin219. For further information contact Andrea Black 13 CTU Monthly Economic Bulletin – April 2020
Monthly Economic Review
April 2020

                                             2018/19      2019/20

    Economic Growth                            3.2%         2.3%     Annual average GDP Growth (December year)

    Unemployment                               4.3%         4.0%     Unemployment Rate (December quarter)

    N/C Inflation                              1.9%         1.9%     Annual Inflation Rate (December year)

    Current Account Deficit                   $11.4b       $9.2b     Current Account Deficit (December year)

    Interest Rates                            1.75%        0.25%     Official Cash Rate (14 April)

Latest data and events
The World Health Organization (WHO) characterised the COVID-19 outbreak as a pandemic on 11 March 2020. Currently
(14 April 2020) there are 1.92 million known cases internationally, with 119,588 associated deaths. Countries with the
largest number of known cases include the United States, Spain and Italy. New Zealand has 1,366 known cases, with nine
notified deaths. Countries have initiated lockdowns of various degrees in order to combat the virus, which has effectively
paused large sections of their economies. This is expected to result in numerous countries entering a technical recession
(two consecutive quarters of falling real GDP growth). OECD estimates indicate that the initial direct impact of the lockdown
could reduce output by between 20 and 25 percent (close to 30 percent for New Zealand), with household spending falling
by around a third. In New Zealand, companies have been withdrawing their profit guidance and cancelling dividend
payments, with some also raising additional capital. Economic forecasters are expecting a significant reduction in GDP in
the June 2020 quarter (Treasury has reported a possible 25 percent contraction under Scenario 1), followed by a partial
rebound in the September quarter.

The New Zealand economy expanded by 0.5 percent in the December quarter, with annual average growth of 2.3 percent
for the 2019 calendar year. Of the 16 industries, 11 recorded an increase in value-added output in the December quarter.
The services industries expanded by 0.6 percent over the quarter, with the rental, hiring, and real estate services industry
growing by 1.1 percent. In regards to expenditure GDP, growth in the quarter was driven by an increase in general
government spending and an increase in exports.

The current account deficit totalled $9.2 billion in the 2019 calendar year, which was equivalent to three percent of gross
domestic product. This compared with an annual deficit of $11.4 billion a year earlier (3.8 percent of GDP). The
improvement was due to a reduction in foreign investors’ income earnings and goods export values rising to a larger extent
than goods imports. New Zealand’s net international investment position, the net amount we owe the rest of the world in
net debt and equity, was $170.9 billion at 31 December 2020 (54.9 percent of GDP).

The Reserve Bank’s Monetary Policy Committee in an unscheduled meeting on 16 March 2020 decided to reduce the
official cash rate by 75 basis points to 0.25 percent The Committee also decided to keep the official cash rate “at this level
for at least the next 12 months”. The Reserve Bank has also announced a number of programmes and initiatives to support
the financial markets. Numerous other central banks around the world have also eased their monetary policy interest rates,
and implemented programmes to support their economies.

Core crown net debt (excluding student loans and other advances) was $59.8 billion at 29 February 2020, which was
equivalent to 19.2 percent of gross domestic product. Debt is expecting to rise in response to COVID-19.
Topic of the month: New Zealand’s tourism industry

Parliamentary Library, Research and Information                     March 2020 (latest data as at 14 April 2020)1Economic
growth
Economic growth
Background
A country’s gross domestic product (GDP) is a measure of economic activity during a period of time, normally reported on
a quarterly and an annual basis. It is the sum of money values of all final goods and services produced in an economy.
The primary indicator used for tracking economic growth over time is known as real gross domestic product, or real GDP.
Real GDP is gross domestic product adjusted for changes in prices. New Zealand’s official gross domestic product figures
are sourced from Stats NZ.
Gross domestic product
The economy expanded by 0.5 percent in the
December 2019 quarter, with 11 of 16 industries
recording an increase in value-added output in the
quarter. On an annual average basis, the economy
expanded by 2.3 percent.
The retail, hiring, and real estate services industry
expanded by 1.1 percent in the December quarter. Four
industries recorded a contraction in activity, including
manufacturing; wholesale trade; financial and
insurance services; and business services.
Growth in expenditure GDP was driven by an increase
in government spending, along with an increase in
goods and services exports.
Year ended December 2019 Nominal GDP
Other data
Gross Domestic Product $311,034 million
Retail sales fell 3.9 percent in March according to Stats
GDP per capita $63,251
NZ’s Electronic Card Transactions data, with spending in
the hospitality industry falling by 30.2 percent. Source: Stats NZ.
Reflecting the uncertainty of the times, preliminary BNZ-Business New Zealand Jan-20 Feb-20
results of April’s ANZ Business Outlook survey showed Performance of Manufacturing Index 49.83 53.18
that general business confidence fell nine basis points to
Performance of Services Index 57.19 52.04
a net minus 73 points. A net 61 percent of firms expect
Seasonally adjusted. A figure over 50 indicates an expansion in
the economic conditions faced by their own firm to
activity.
deteriorate over the coming 12 months. According to the Source: BNZ-Business New Zealand.
ANZ, “we’ve never seen numbers like these”.
ANZ Business Outlook Survey Feb-20 Mar-20
Outlook General ‘Business Confidence’ -19.4 -63.5
The economy is now expected to enter into a technical Own ‘Activity Outlook’ 12.0 -26.7
recession, which is defined as two consecutive quarters Net percentage expecting an improvement in 12 months’ time.
of contracting gross domestic product. While most Source: ANZ Bank, Business Outlook survey.
economic forecasters are forecasting a
contraction in the March quarter, a much larger contraction is expected in the June quarter in value-added output, with
estimates ranging from 10 to 17 percent (Treasury’s Scenario 1 has GDP contracting by 25 percent). At this stage, the
economy is forecast to be five to six percent lower on an annual average basis at the end of 2020.
GDP growth (%) Dec-18 Mar-19 Jun-19 Sep-19 Dec-19
Annual average (year-on-year) 3.2 3.1 2.9 2.7 2.3
Quarterly (seasonally adjusted) 1.0 0.4 0.0 0.8 0.5
Source: Stats NZ.
Next Release: Gross Domestic Product: March 2020 quarter. Date: 18 June 2020.Employment and Unemployment
Background
The unemployment rate measures the number of people unemployed as a proportion of those in the labour force. The
labour force is the number of people of working age (15 years and over) who are working for wages or a salary, working
for a family business, or who are unemployed and seeking work. In New Zealand, the official unemployment rate is sourced
from Stats NZ’s quarterly Household Labour Force Survey (produced as part of its Labour Market Statistics).
Labour market Numbers unemployed and the unemployment rate
There were 111,000 people unemployed in the 180 8
December 2019 quarter in seasonally adjusted terms. 160 7
(%sa)
The associated unemployment rate was four percent.
sa)
140 6
The underutilisation rate, which measures those 120
Unemployment rate
5
Thousands (000s,
wanting to work plus those wanting to work more hours, 100
4
was ten percent in the December quarter (its lowest rate 80
since the June 2008 quarter). 60
3
Annual employment growth has been declining, with the 40 2
number of those employed rising by one percent 20 1
between the December 2018 and 2019 quarters (driven 0 0
2010 2011 2012 2013 20142015 2016 2017 2018 2019
by an increase in full-time employment).
Unemployed (left-hand side) Unemployment rate (right-hand side)
Other data
The Government has announced that $9.6 billion has
been paid out under its Wage Subsidy Scheme to date, ANZ Business Outlook Survey Feb-20 Mar-20
supporting over a million workers. The amount paid out Net % expecting to increase 1.7 -22.5
is equivalent to 3.1 percent of GDP. employment in their business in
12 months*
There has been a collapse in firms’ employment
*equal to the % of respondents expecting an increase minus the %
expectations. A net 16 percent of firms in the latest
expecting a decrease. Source: ANZ Bank.
NZIER Quarterly Survey of Business Opinion reported
that they intended to reduce staff numbers in the June Quarter Dec-18 Dec-19
quarter. The majority of firms responding to this survey,
Average ordinary time weekly
did so prior to the lockdown being announced. ANZ has $1,200.82 $1,244.21
earnings for FTEs (pre-tax) ($)
released preliminary results from its April 2020
Business Outlook survey. A net 54 percent of firms’ Labour Cost Index - % change in
salary and wage rates (including
reported that they intended to reduce staff numbers in +1.9 +2.6
overtime) from the same
the coming 12 months.
quarter of the previous year
Outlook Source: Stats NZ.
New Zealand’s unemployment rate is expected to
rise substantially in the near term. The official
unemployment rate for the March quarter will be released early May, with a rate in the range of 4.2 – 4.9 percent being
forecast by bank economists. The unemployment rate is then forecast by the banks to rise to around 8.6 – 9.0 percent in
the June 2020 quarter as employment numbers contract. Latest economic modelling by the Treasury has the
unemployment rate rising to 13 percent in the June quarter (Scenario 1).
Household Labour Force Survey Dec-18 Mar-19 Jun-19 Sep-19 Dec-19
Unemployment Rate (seasonally adjusted, %) 4.3 4.1 4.0 4.1 4.0
Employment Growth (annual, %)* 2.0 1.4 1.6 1.0 1.0
*change since the same quarter of the previous year based on seasonally adjusted data. Source: Stats NZ.
Next Release: Labour Market Statistics: March 2020 quarter. Date: 6 May 2020
Parliamentary Library, Research and Information March 2020 (latest data as at 14 April 2020) 3Inflation
Background
Inflation is the change in prices of goods and services over a certain period of time. The official rate of consumer inflation
is measured by Stats NZ’s Consumers Price Index (CPI). The CPI tracks the price of a basket of household goods and
services over time on a quarterly basis.
Consumers Price Index
Consumer goods and services prices rose by 0.5
percent in the December 2019 quarter, and by 1.9
percent over the year ended in the December quarter.
According to Stats NZ, dwelling rental costs rose by 0.8
percent in the December quarter and by 3.1 percent
over the year (the highest annual increase in rents
since the September 2008 quarter).
Costs associated with the purchase of housing rose by
2.4 percent over the year ended in the December
quarter. This was its lowest annual increase since the
December 2011 quarter.
Other data
Food prices rose by 3.1 percent over the year ended
Annual Percentage Change (%) Jan-20 Feb-20
February 2020 according to the Food Price Index.
Stats NZ said that higher prices for meat, especially for Quotable Value – Residential property
4.4 5.3
values*
beef and preserved products like bacon, was a
significant driver of higher food prices for the year. REINZ House Price Index** 7.0 8.7
Food Price Index** 3.5 3.1
Firms’ inflation expectations fell to a new low of 1.28
percent according to preliminary results for April in the *change since the same three months ended in the month of the
previous year **change since the same month of the previous year.
ANZ Business Outlook survey. Firms’ pricing
Sources: Quotable Value; REINZ; Stats NZ.
intentions over the coming year were negative with a
net eight percent of firms expecting to reduce the price ANZ Business Outlook Survey Feb-20 Mar-20
of their goods and services. This was the first time this Net % of respondents expecting to
indicator has returned a negative result. 27.0 14.8
increase prices in 3 months’ time*
Outlook Inflation expected in 12 months’ time 1.89 1.51
Reduced demand for goods and services, along with *equal to the % of respondents expecting an increase minus the %
lower international commodity prices (especially the expecting a decrease. Source: ANZ Bank.
price of oil), will place downward pressure on
inflation. After peaking at around two percent in the year ended in the March 2020 quarter, annual inflation is forecast to
drop over the remainder of 2020. House prices are forecast to decline in the near term. Westpac believes that house prices
could fall by seven percent over the second half of 2020.
Inflation (%) Dec-18 Mar-19 Jun-19 Sep-19 Dec-19
Consumers Price Index - Annual 1.9 1.5 1.7 1.5 1.9
Tradables inflation 0.9 -0.4 0.1 -0.7 0.1
Non-tradables inflation 2.7 2.8 2.8 3.2 3.1
CPI - quarterly 0.1 0.1 0.6 0.7 0.5
Source: Stats NZ.
Next Release: Consumers Price Index: March 2020 quarter. Date: 20 April 2020
Parliamentary Library, Research and Information March 2020 (latest data as at 14 April 2020) 4External
Background
The balance of payments is the record of the receipts and payments between a country’s residents and the rest of the
world, over a given period. The current account is that part of a country’s balance of payments which embraces its
transactions of goods, services, primary income (i.e. international income), and secondary income (i.e. current transfers
such as foreign aid). A “balance of payments deficit” refers to a deficit of the current account.
Current account balance
The seasonally-adjusted current account deficit was
$1.9 billion in the December 2019 quarter, compared
with a deficit of $2.5 billion in the previous quarter.
On an annual basis, the current account deficit totalled
$9.2 billion in the 2019 calendar year, equivalent to
three percent of GDP.
Other data
Good exports totalled $60.5 billion in the year ended
February 2020, up five percent from the previous year.
Goods imports totalled $63.7 billion for the year,
resulting in a merchandise trade deficit of $3.3 billion.
Stats NZ has released provisional data for the
period 1 February to 25 March 2020. When compared with the same period in 2019 it found that total exports rose by 0.5
percent (exports to China down 12 percent), while total imports fell by 3.4 percent (imports from China down 14 percent).
Stats NZ has estimated that there were 240,000 – Annual Change (%) Feb-20 Mar-20
260,000 overseas visitors in the country as of late World Commodities Prices* 0.6 -5.5
March, of which 83 percent were non-New Zealand
NZ$ Commodities Prices* 7.1 6.2
citizens.
Overseas Visitors** -0.6 n/a
Outlook *change since the same month of the previous year. **change since the
New Zealand’s terms of trade will continue to be previous year-end. Sources: Stats NZ; ANZ.
supported by lower international oil prices which
have fallen further over the past month. The fact that food product exports are a significant component of our merchandise
exports will support export demand. However, services exports will be significantly impacted by the upcoming collapse in
international tourist numbers in the near term.
Balances ($m) Dec-18 Mar-19 Jun-19 Sep-19 Dec-19 Feb-20
Quarterly Current Account (seasonally adjusted) -2,832 -2,450 -2,353 -2,522 -1,877 n/a
Annual Current Account -11,437 -10,801 -10,164 -10,189 -9,223 n/a
Goods -5,225 -4,564 -3,894 -4,198 -3,857 n/a
Services 5,003 4,625 4,308 4,181 4,195 n/a
Primary income (i.e. investment income) -10,927 -10,559 -10,084 -9,564 -8,909 n/a
Secondary income (i.e. current transfers) -288 -303 -494 -608 -662 n/a
Net international investment position (as at date) -168,806 -163,922 -166,704 -171,170 -170,861 n/a
Annual Merchandise Trade Balance (FOB-CIF)* -6,161 -5,739 -4,987 -5,321 -4,467 -3,258
* CIF – Cost of goods imported, including insurance and freight to New Zealand. FOB – Free on board, the value of goods at New Zealand
ports before export. Source: Stats NZ.
Next Release: Balance of Payments: March 2020 quarter. Date: 17 June 2020
Parliamentary Library, Research and Information March 2020 (latest data as at 14 April 2020) 5Finance
Background
The trade weighted index (TWI) is an index of the New Zealand dollar’s value against a basket of 17 overseas currencies,
where each currency is weighted by a combination of the size of the associated country’s bilateral merchandise trade with
New Zealand (including the Euro area) and their gross domestic product. The Official Cash Rate (OCR) is the interest rate
that applies to overnight borrowing and lending between banks and the Reserve Bank. The S&P/NZX 50 is the main share
index of the New Zealand Exchange. It tracks changes in the share prices of the top 50 publicly listed companies by free
float market capitalisation on the NZX market. It is a gross index, so it includes the payout of dividends in its calculation.
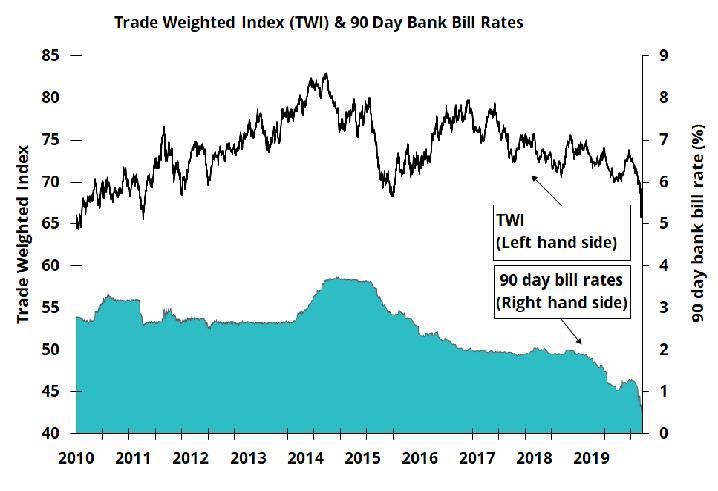
Recent trends & data
On 16 March, the Reserve Bank’s Monetary Policy
Committee decided to reduce the official cash rate by
75 basis points to a record low of 0.25 percent. The
Bank said that the rate “will remain at this level for at
least the next 12 months”. Short-term and long-term
interest rates eased during March, with the 90-day bank
bill rate averaging 0.71 percent, while the ten-year
government bond yield averaged 1.07 percent (both
record lows).
The Bank has announced a number of additional
measures to support New Zealand’s financial markets.
These include delaying the commencement
of increased capital requirements for banks to July 2021; dropping the core funding ratio; a $30 billion Large Scale Asset
Purchase programme of government bonds; providing additional liquidity through a Term Auction Facility (TAF) and Term
Lending Facility (TLF). New Zealand banks have also agreed to suspending paying dividends.
The New Zealand Debt Management Office announced it was increasing the value of bonds it was issuing in 2019/20 to
$25 billion. This compares with a Half Year Economic and Fiscal Update 2019 forecast for the financial year of ten billion.
The increase is due to “…assessments of funding requirements due to additional fiscal impacts of COVID-19”. To date,
eight billion of bonds have been issued, with $17
Core Crown borrowing as at 29-Feb-20 29-Feb-20
billion to be raised over the last three months of the
($m) (%GDP)
financial year.
Gross sovereign-issued debt * 92,094 29.6
Outlook
Government debt is expected to rise significantly in Net core Crown debt ** 59,751 19.2
response to COVID-19. Westpac has forecast *Excluding Reserve Bank settlement cash and Reserve Bank bills.
government debt to rise to 40 percent of GDP by mid- ** Excluding NZ Super Fund and other advances. Source: The
2022, while ASB expects net debt to rise above 50 Treasury.
percent of GDP over the next couple of years.
Monthly averages Nov-19 Dec-19 Jan-20Feb-20 Mar-20
90 Day Bank Bill rate 1.18 1.23 1.27 1.18 0.71
10 Year Government Bond yields (secondary market) 1.35 1.53 1.48 1.28 1.08
Floating mortgage rate* 5.26 5.26 5.26 5.26 4.50
SME overdraft rate* 9.00 9.00 9.09 9.09 8.50
Trade Weighted Index (TWI) exchange rate 70.86 72.73 72.67 71.37 68.77
S&P/NZX50 index 10947 11378 11699 11715 10120
*Last business day of the month. Sources: Reserve Bank; NZX.
Next Official Cash Rate (OCR) decision: 13 May 2020
Parliamentary Library, Research and Information March 2020 (latest data as at 14 April 2020) 6International
Background
New Zealand’s economic growth rate, unemployment rate and central bank interest rates are compared with our main
OECD trading partners. The first table below illustrates the seasonally adjusted quarterly growth rates in economic activity.
The second table below shows the harmonised unemployment rate in each OECD country/area, while the third shows the
main central bank interest rates for various countries (and the Euro).
Economic growth
Quarterly economic growth rates (%) The OECD has estimated that the initial impact of
Country* Jun-19 Sep-19 Dec-19 policies to contain COVID-19 could result in a 20 to 25
Australia 0.6 0.6 0.5 percent reduction in output in member countries
Japan 0.6 0.0 -1.8 (close to 30 percent for New Zealand), and consumer
spending falling by around a third. The impact on
NEW ZEALAND 0.0 0.8 0.5
annual GDP depends upon the length of shutdowns,
United Kingdom -0.2 0.5 0.0 the rollout of monetary and fiscal stimulus packages,
United States 0.5 0.5 0.5 and ongoing demand for goods and services.
Euro area 0.1 0.3 0.1
Unemployment
OECD Total 0.4 0.4 0.2 The number of people applying for unemployment
China** 1.6 1.4 1.5 benefits in the United States in the week ended 4 April
* Seasonally adjusted growth rate from the previous quarter. **
2020 totalled 6.6 million people, which followed 6.9
non-OECD. Source: OECD. million people in the previous week (and compares
with a figure of 203,000 a year earlier). Over the last
Harmonised unemployment rates (%) three weeks, a total of 16.8 million people have applied
Country Jan-20 Feb-20 Mar-20 for unemployment benefits in the United States.
Australia 5.3 5.1 n/a Central banks
Japan 2.4 2.4 n/a Central banks, in both scheduled and unscheduled
NEW ZEALAND 4.0 (Dec qtr) n/a n/a meetings, have been reducing monetary policy
interest rates. They have also introduced a range of
United Kingdom 3.7 (Dec) n/a n/a
additional measures, such as bond purchasing
United States 3.6 3.5 4.4 programmes, and term funding facilities, to support
European Union 6.5 6.5 n/a financial markets.
OECD Total 5.1 5.0 n/a On 18 March, the Australian Reserve Bank Board
Source: OECD. decided to reduce the cash rate to 0.25 percent. The
Board also decided to target a yield of 0.25 percent for
the three year Government bond, and to provide credit to firms through a term funding facility.
Central Bank interest rates (as at 14 April)
Central Bank Key Rate Interest Rate Effective from Direction (Basis
(%) points)
Australia Cash Rate 0.25 20-Mar-20 -25
China Loan Prime Rate 4.05 20-Feb-20 -10
European Central Bank Main Refinance Rate 0.00 16-Mar-16 -5
Japan Uncollateralized overnight rate -0.10 to 0.00 16-Feb-16 -10
NEW ZEALAND Official Cash Rate 0.25 16-Mar-20 -75
United Kingdom Bank Rate 0.25 10-Mar-20 -50
United States Federal Funds Rate 0.00 to 0.25 16-Mar-20 -75
Source: Central Bank interest rates as at the date stated.
Parliamentary Library, Research and Information March 2020 (latest data as at 14 April 2020) 7Topic of the month
New Zealand’s tourism industry
The tourism industry is a significant industry in New Zealand’s economy. In the year ended March 2019, total tourism spending was
$40.9 billion according to Stats NZ’s Tourism Satellite Account: 2019. This includes both spending by international tourists ($17.2
billion) and domestic tourism spending ($23.7 billion). The domestic figure includes two categories, spending by businesses and
government ($5.8 billion) and spending by households ($17.9 billion). International tourism spending was equivalent to 20.4 percent
of total exports in the year ended March 2019.
Revenue received through international student spending is part of the international tourism spending. In the year ended March 2019,
a total of $3.9 billion was received through the export education sector from those students who were studying in New Zealand for a
period of less than 12 months. This amount includes spending on course fees, living costs, and airfares on resident airlines. Spending
by cruise ships in New Zealand waters is included within the international tourism spending figures. In the year ended March 2019,
cruise ship spending totalled $569.8 million (with Auckland and Tauranga ports receiving the largest proportion of spending).
In regards to the tourism industry’s contribution to gross domestic product (GDP), in the year ended March 2019 the direct contribution
to GDP was $16.2 billion, with a further $11.2 billion in indirect contribution to GDP ($27.3 billion in total). Together, these contributions
were equivalent to 9.8 percent of total GDP in the year ended March 2019. Tourists paid $3.8 billion in GST payments on the goods
and services they consumed in the year ended March 2019.
There were 229,566 people directly employed in the tourism sector in the year ended March 2019, with a further 163,713 people
indirectly employed (i.e. providing goods and services to the sector), resulting in total direct and indirect employment of 393,279. As a
proportion of the total number of people employed, direct employment in the tourism sector was equivalent to 8.4 percent, with a further
six percent indirectly employed.
Tourism spending by type of product, year ended March 2019
Product Domestic International Total tourism Tourism
tourism ($m) tourism (m) ($m) spending as %
total spending
Accommodation services 1,414 1,889 3,303 96%
Food and beverage serving services 2,016 2,685 4,701 42%
Air passenger transport 2,997 2,623 5,620 99%
Other passenger transport 3,268 1,277 4,545 68%
Imputed rental on holiday homes 847 0 847 100%
Cultural, recreation, and gambling services 708 464 1,172 19%
Retail sales – alcohol, food, and beverages 1,971 470 2,440 3%
Retail sales – fuel and other automotive products 1,502 717 2,218 18%
Retail sales – other 4,911 2,914 7,824 13%
Education services 400 728 1,128 16%
Other tourism products 1,636 1,625 3,261 6%
GST paid on purchases by tourists 2,028 1,771 3,799 ..
Total tourism spending 23,697 17,162 40,859 ..
Source: Stats NZ. Tourism Satellite Account:2019.
Grant Cleland
Research Services Analyst - Economics
Parliamentary Library, Research and Information
ISSN 1176-5860 (Print) ISSN 1178-1300 (Online)
Parliamentary Library, Research and Information February 2020 (latestdata as at11February 2020) 1You can also read