Emissions of Carbon Dioxide in the Transportation Sector - DECEMBER
←
→
Page content transcription
If your browser does not render page correctly, please read the page content below
Emissions of Carbon Dioxide
in the Transportation Sector
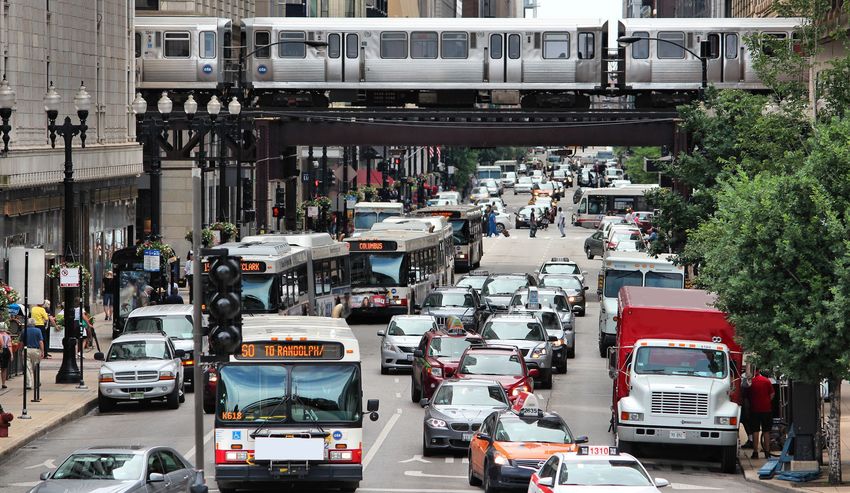
© Tupungato/Shutterstock.com
DECEMBER
JANUARY||2022
2021At a Glance
The largest source of emissions of carbon dioxide (CO2, the most common greenhouse gas) in the
United States is the transportation sector. Emissions from transportation surpassed emissions from
the electric power sector five years ago and now constitute two-fifths of domestic emissions from
burning fossil fuels.
In this report, the Congressional Budget Office provides an overview of CO2 emissions in the trans-
portation sector, describing the sources of and trends in such emissions and projecting their future
path.
• In 2021, CO2 emissions in the transportation sector were 6 percent less than they were in 2005.
The decline in emissions from transportation has contributed to a drop of about 20 percent in
total CO2 emissions in the United States since 2005; most of that overall reduction has come from
the electric power sector.
• Reducing emissions from transportation has been difficult because of the value that people
place on transportation and the dominance of a single fuel source—petroleum. Demand for
transportation is much less sensitive to price changes than is demand for electric power, and
people have had few cost-effective alternatives to motor fuels.
• Most emissions in the transportation sector come from cars and trucks. Motor vehicles
accounted for 83 percent of CO2 emissions from transportation in 2019. Personal vehicles and
commercial trucks (the predominant forms of passenger and freight transportation) averaged more
CO2 emissions per passenger-mile or ton-mile than most other modes of transportation.
• CO2 emissions have declined since 2005—despite an increase in travel by car and truck—
because vehicles have become more efficient. The use of motor vehicles has expanded with
economic growth, but the average fuel economy of new light-duty vehicles (cars and light-duty
trucks, including sport utility vehicles, crossover utility vehicles, minivans, and pickup trucks) rose
from 20 miles per gallon in 2005 to 25 miles per gallon in 2021.
• Tighter standards for fuel economy and emissions, along with greater use of electric vehicles, are
projected to reduce emissions moderately over the next decade. CBO projects CO2 emissions in
the transportation sector to decrease by 9 percent from 2021 to 2032 as the vehicle fleet becomes
increasingly efficient to comply with more stringent fuel economy standards. Sales of electric
vehicles, which accounted for 4 percent of the market in 2021, are expected to grow substantially.
The use of electric vehicles is expected to contribute to greater emissions reductions in future
decades than it does today because the electric power sector is projected to continue to become
progressively less carbon intensive.
www.cbo.gov/publication/58566Contents Carbon Dioxide Emissions From Transportation and Other Sectors 2 Trends in Carbon Dioxide Emissions 3 Challenges in Reducing Emissions From Transportation 4 Sources of Transportation-Related Emissions 5 Passenger Transportation 6 Emissions From the Different Modes of Passenger Transportation 7 Differences in Emissions Within Modes of Passenger Transportation 8 Freight Transportation 9 Emissions From the Different Modes of Freight Transportation 10 Trends in Transportation Sector Emissions 11 Growth in Motor Vehicle Travel 12 Changes in Fuel Economy 13 Projections of Carbon Dioxide Emissions From Transportation 14 Changes in Standards, Electric Vehicle Incentives, and Emissions 15 CAFE Standards 16 Greenhouse Gas Emissions Standards 17 Demand for Electric Vehicles 18 Emissions Attributable to Electric Vehicles 19 Effects of Economic Growth and Oil Prices on Future Emissions 20 Appendix A: Analytic Method 23 Appendix B: Data Sources for Figures 25 About This Document 29
Notes

To produce this report, the Congressional Budget Office adapted data from many sources. For
a description of CBO’s analytic method, see Appendix A. Citations for the figures are listed in
Appendix B.

Numbers in the text and figures may not add up to totals because of rounding.

Unless this report indicates otherwise, all years referred to are calendar years.
Emissions of Carbon Dioxide
in the Transportation Sector

The accumulation of greenhouse gases in the atmosphere contributes to climate change. The most prevalent of those
gases, carbon dioxide (CO2), is released when fossil fuels (such as coal, oil, and natural gas) and the derivatives of oil
that are frequently used to power transportation (namely, gasoline, diesel fuel, and jet fuel) are burned. Climate change
imposes costs on people and countries around the world, including the United States.

Transportation is the largest source of greenhouse gas emissions in the United States, and CO2 emissions represent
roughly 97 percent of the global warming potential of all greenhouse gas emissions from transportation.1 Before the
coronavirus pandemic, CO2 emissions from transportation had risen (in amount and as a share of emissions) for sev-
eral years.

In this report, the Congressional Budget Office provides an overview of CO2 emissions and identifies the sources of
those emissions in the transportation sector. The report also discusses factors that determine transportation-related
emissions and presents the agency’s projections of their path over the next 10 years.
2 EMISSIONS OF CARBON DIOXIDE IN THE TRANSPORTATION SECTOR December 2022
Carbon Dioxide Emissions From Transportation and Other Sectors
In 2021, worldwide emissions of greenhouse gases from all sources amounted to 40.8 billion
metric tons (BMT).2 Greenhouse gas emissions in the United States are estimated to account
for almost one-sixth of that amount—6.4 BMT.3 Of those U.S. emissions, 5.0 BMT (or
80 percent) were CO2; methane, nitrous oxide, and other (mainly fluorinated) gases from
agriculture, industry, energy production, and waste management accounted for the remain-
ing amount.4
About 92 percent (or 4.6 BMT) of U.S. CO2 emissions stemmed from burning fossil fuels
to produce energy. The remaining 8 percent of those emissions were unrelated to energy
production; they resulted from industrial, agricultural, and waste management processes.
Historically, about 15 percent of total CO2 emissions in the United States were offset by the
net absorption of CO2 by the nation’s forests and soil.
In 2021, CO2 emissions from transportation in the United States totaled 1.7 BMT—the
most from any sector of the economy. With CO2 emissions of 1.5 BMT, the electric power
sector was the second largest source that year. (For more information about emissions in that
sector, see Congressional Budget Office, Emissions of Carbon Dioxide in the Electric Power
Sector [December 2022], www.cbo.gov/publication/58419.) Together, the remaining energy-
related sources—the industrial, residential, and commercial sectors—contributed an addi-
tional 1.4 BMT.
Shares of Energy-Related Emissions of Carbon Dioxide, by Economic Sector, 2021
Transportation
38%
Emissions of carbon dioxide
in the transportation sector
accounted for 38 percent of
Total energy-related emissions in
Commercial 4.6 Billion Metric Tons the United States in 2021—
5% Electric Power the largest share of such
33% emissions of any sector of
Residential the economy.
7%
Industrial
17%December 2022 EMISSIONS OF CARBON DIOXIDE IN THE TRANSPORTATION SECTOR 3
Trends in Carbon Dioxide Emissions
In 2017, CO2 emissions from transportation, which had peaked in the mid-2000s, surpassed
emissions from electric power. After the 2007–2009 recession, transportation-related emis-
sions declined, but they had rebounded and were heading toward their prerecession peak
when the pandemic hit in early 2020.
Total energy-related emissions of CO2 in the United States peaked in 2005 and declined
by about 20 percent by 2021—an average reduction of roughly 0.07 BMT per year. Three-
quarters of that reduction came from the electric power sector. Emissions from the trans-
portation sector declined by 6 percent over the same period—an average of 0.01 BMT per
year. That change accounted for only one-tenth of the overall reduction in energy-related
emissions. The industrial, residential, and commercial sectors were responsible for the rest of
the decline.
Whereas reductions of emissions in the industrial sector may be offset by corresponding
increases in emissions in other countries, reductions in the transportation sector are not likely
to be. Policies that lower emissions of greenhouse gases in the United States but lead to
offsetting increases in emissions elsewhere—say, by causing activity in carbon-intensive
industries to shift to other countries—would leave global emissions (and thus climate
change) largely unaffected.
Energy-Related Emissions of Carbon Dioxide, by Economic Sector, 1975 to 2021
Billions of Metric Tons
3.0
2.5
Electric Power
2.0 Transportation became
the leading source of CO2
Transportation emissions in the United
1.5
States in 2017 after
emissions in the electric
1.0 power sector declined
Industrial
substantially.
0.5 Residential
Commercial
0
1976 1981 1986 1991 1996 2001 2006 2011 2016 2021
3,000
2,500
Electric Power
2,000
1,500 Transportation4 EMISSIONS OF CARBON DIOXIDE IN THE TRANSPORTATION SECTOR December 2022
Challenges in Reducing Emissions From Transportation
Reductions in emissions from transportation have been harder to achieve than those in the
electric power sector for three main reasons. First, the demand for transportation services is
not very sensitive to the price of such services. Demand for transportation is built into the
places that people live, work, and socialize and the places that businesses produce and sell
their goods. Those locations can change, but such change typically happens slowly. Second,
the transportation sector is overwhelmingly dependent on a single fossil fuel, petroleum.
Although the price of petroleum is higher than that of other fossil fuels per unit of energy
(in part because of the cost of refining it into usable fuels), few cost-effective alternatives
are currently available. In fact, the price of embedded CO2 (what final users pay for energy
per metric ton of CO2 released) in the transportation sector is more than twice the price in
the other sectors. Third, people tend to own vehicles for a long time, delaying the effects of
improvements in the fuel efficiency of new vehicles.
The difficulty in reducing transportation emissions can be illustrated by considering the
effects on different sectors of an emissions tax—for example, one that would start at $25 per
metric ton and grow at an inflation-adjusted rate of 5 percent per year.5 The transportation
sector would experience a smaller reduction in CO2 emissions than other sectors would as a
result of such a tax—a 3 percent reduction compared with a reduction of 34 percent in the
electric power sector and of 6 percent in the industrial, residential, and commercial sectors
combined, CBO estimates.
Estimated Effects of a $25-per-Ton Tax on Energy-Related Emissions of Carbon Dioxide That Grows at an Inflation-Adjusted
Annual Rate of 5 Percent, by Economic Sector
Billions of Metric Tons
Industrial, Residential,
Transportation Electric Power and Commercial
2.0
Without Tax
With Tax
This illustrative case
involving a tax on each
1.5 metric ton of CO2 emitted
demonstrates one key
challenge to reducing
transportation emissions:
1.0 Demand for transportation
is much less sensitive to
changes in prices than is
demand for electric power,
0.5 the second leading source
of emissions.
0
2023 2032 2023 2032 2023 2032December 2022 EMISSIONS OF CARBON DIOXIDE IN THE TRANSPORTATION SECTOR 5
Sources of Transportation-Related Emissions
Personal vehicles—cars, light-duty trucks (including sport utility vehicles, crossover utility
vehicles, minivans, and pickup trucks), and motorcycles—were responsible for 58 percent
of emissions in the transportation sector in 2019. (Although data for 2020 were available,
CBO used 2019 as its reference year because emissions in 2020 were affected by the corona-
virus pandemic.) Emissions from commercial trucks and all buses accounted for 25 percent.
Together, the following modes of transportation accounted for the remaining 17 percent: air
(including commercial passenger aviation, general aviation, air cargo, and military avia-
tion), pipelines (for which fuel is burned to power compressors that keep oil and natural gas
flowing at a steady rate), rail (passenger railroads, rail transit, and freight railroads), and water
(including ships and boats).
This report focuses on motor vehicles (personal vehicles as well as commercial trucks and
buses) because they account for the bulk of emissions. But emissions reductions could be
achieved in the other modes of transportation. For instance, improvements in aircraft design
have led to emissions reductions in aviation, and alternative fuels could someday reduce
emissions from other forms of transportation.
The figure below reflects all transportation regardless of whether people or goods are being
transported; in the rest of this section, passenger and freight transportation are discussed
separately.
Shares of Transportation-Related Carbon Dioxide Emissions, by Mode of Transportation, 2019
Personal Vehicle
58%
Motor vehicles—personal
vehicles and commercial
Water trucks and buses—
2% Total
1.8 Billion Metric Tons accounted for 83 percent
of emissions in the
Rail
2%
transportation sector in
2019.
Pipeline
3%
Air Commercial Truck and Bus
10% 25%6 EMISSIONS OF CARBON DIOXIDE IN THE TRANSPORTATION SECTOR December 2022
Passenger Transportation
In 2019, most passenger travel—81 percent of all passenger-miles—took place in per-
sonal vehicles. (A passenger-mile represents one person traveling one mile. The Bureau of
Transportation Statistics cautions that the mileage may reflect some double-counting and
may exclude small amounts of self-propelled travel from walking and biking.) For long-
distance travel, air travel was the primary alternative to motor vehicles; for local travel, bus
and rail transit were the main alternatives.
Rail transit systems fall into two categories: heavy rail and light rail. Usually in urban centers
and often underground, heavy-rail transit (commonly called a subway or metro) serves a large
volume of passengers. Light-rail transit (such as streetcars and trolleys) serves fewer passen-
gers than heavy rail and is typically at street level. Passenger railroads include Amtrak and
commuter railroads, which operate on railroad tracks and typically provide service between
the center of a metropolitan area and its outlying areas.
Shares of Passenger-Miles Traveled, by Mode of Transportation, 2019
Personal Vehicle
81%
Most passenger travel
occurs in personal vehicles.
Total Air, bus, and rail (including
Rail 6.1 Trillion heavy- and light-rail transit
1% Passenger-Miles and passenger railroads)
Bus
6% account for much smaller
shares of passenger travel.
Air
12%December 2022 EMISSIONS OF CARBON DIOXIDE IN THE TRANSPORTATION SECTOR 7
Emissions From the Different Modes of Passenger Transportation
In 2019, CO2 emissions from personal vehicles averaged 0.47 pounds per passenger-mile.6
Average emissions from other modes of passenger transportation—heavy- and light-rail tran-
sit, passenger railroads, commercial air travel, and bus—were all lower per passenger-mile.
Emissions from bus transportation averaged 0.39 pounds of CO2 per passenger-mile in 2019;
that average encompasses several kinds of bus operations with varying emissions. Transit
buses, for example, averaged 0.95 pounds per passenger-mile, largely because they often
operated at only a fraction of their capacity. (Emissions per passenger-mile decline as the
number of occupants increases.) Emissions of CO2 from intercity buses (including charter
buses and tour buses, which are sometimes referred to as motorcoaches) were much lower,
averaging 0.15 pounds per passenger-mile, slightly less than the average for rail transit.
Traffic congestion and travel speeds, which are influenced by travel growth, can affect the
efficiency with which motor vehicles burn fuel and produce emissions. An extra 0.04 BMT
of greenhouse gases—about 2 percent of all transportation-related emissions—were emitted
in 2019 as a result of congestion.7
Average Carbon Dioxide Emissions per Passenger-Mile, by Mode of Transportation, 2019
Pounds of Carbon Dioxide per Passenger-Mile
Personal Vehicle 0.47
Carbon dioxide emissions
Bus 0.39 per passenger-mile from
travel by personal vehicles
are higher on a per-mile
basis than emissions from
Air 0.34
other forms of passenger
travel. Heavy- and light-rail
transit produce relatively
Passenger Railroad 0.30 few emissions per
passenger-mile.
Rail Transit 0.178 EMISSIONS OF CARBON DIOXIDE IN THE TRANSPORTATION SECTOR December 2022
Differences in Emissions Within Modes of Passenger Transportation
Average emissions obscure substantial differences within each mode of transportation.
Several factors—including vehicle size, average occupancy, the type of fuel used, and fuel
efficiency—affect emissions per passenger-mile. Conventional cars typically have greater fuel
economy than light duty trucks. Newer vehicles are usually more fuel efficient than older
ones. And smaller vehicles get better mileage, on average, than larger ones. The most pop-
ular size car in 2020 emitted 0.60 pounds of CO2 per vehicle mile, whereas one category
of large pickup trucks built in that year had average emissions that were nearly twice that
amount—1.18 pounds of CO2 per vehicle mile.8
A transit system’s emissions depend on the average carbon content of the electricity used to
power it (that is, the amount of CO2 released in the process of generating that electricity) as
well as the system’s load factor (the percentage of the system’s seats that are filled, on average).
Emissions from heavy-rail transit systems in 2019 varied greatly, ranging from 0.09 pounds of
CO2 per passenger-mile to 0.99 pounds. Some public transportation systems may offer
frequent service and a large network of routes to provide greater mobility for their users; those
offerings can reduce a system’s load factor and thus increase its emissions per mile traveled.
Emissions of Carbon Dioxide From Heavy-Rail Transit Systems, by Carbon Content of Electricity and Load Factor, 2019
Pounds of Carbon Dioxide per Passenger-Mile
Carbon Content of Electricity Load Factor
1.0 ● ●
0.8
Emissions per passenger-
0.6 mile can vary substantially
● ●
within a particular mode. For
instance, subways that use
● ●
electricity with less carbon
0.4 ●
Chicago “L” ●
content and systems that are
Washington more heavily utilized tend
Washington ●● ● Metro ● ● ● Chicago “L”
to have lower emissions per
Metro
● ● passenger-mile.
0.2 ● ●
● ● ● ●
San ● San ●
New York New York
Francisco
BART
● City Subway
Francisco
BART
● City Subway
0
0 250 500 750 1,000 0 25 50 75 100
Pounds per Megawatt Hour Percent
(Symbol size represents volume of passenger-miles.)December 2022 EMISSIONS OF CARBON DIOXIDE IN THE TRANSPORTATION SECTOR 9
Freight Transportation
Emissions from freight transportation depend on the weight of the cargo. In 2019, trucks
carried 43 percent of all ton-miles; railroads, 29 percent; and pipelines and water transpor-
tation, most of the rest. (A ton-mile represents one ton of freight transported one mile.)
Measured in terms of weight, air cargo accounted for less than 1 percent of freight transpor-
tation. (When the value of cargo is used instead of its weight to measure freight transpor-
tation, trucking still accounted for the largest share of such transportation. But whereas the
weight of goods shipped by railroad exceeded that of goods shipped by air, the value of goods
shipped by air was greater.)
Shares of Ton-Miles of Freight, by Mode of Transportation, 2019
Truck
43%
Trucking is the primary form
of freight transportation,
Air Total although it does not
Less than 1% 5.5 Trillion Ton-Miles dominate freight
transportation as much
Water as motor vehicles do
10% Rail passenger travel.
29%
Pipeline
18%10 EMISSIONS OF CARBON DIOXIDE IN THE TRANSPORTATION SECTOR December 2022
Emissions From the Different Modes of Freight Transportation
CO2 emissions per ton-mile from the different modes of freight transportation vary greatly—
far more than those from the different modes of passenger transportation. Per ton-mile,
trucking produced more CO2 emissions, on average, than most other modes of freight
transportation but far less than air cargo.
Average Carbon Dioxide Emissions per Ton-Mile of Freight, by Mode of Transportation, 2019
Pounds of Carbon Dioxide per Ton-Mile
Air 2.57
Truck 0.40 Per ton-mile, emissions
from trucking, the
predominant mode of
freight transportation, were
Water 0.14 eight times those from rail.
And emissions per ton-mile
from air cargo were six
Pipeline 0.13 times those from trucks.
Rail 0.05December 2022 EMISSIONS OF CARBON DIOXIDE IN THE TRANSPORTATION SECTOR 11
Trends in Transportation Sector Emissions
Changes in the volume of motor vehicle transportation and changes in vehicles’ fuel efficiency
are the two factors that have most influenced emissions. In the late 1970s and early 1980s,
improvements in the fuel economy of light-duty vehicles (that is, passenger cars and light-
duty trucks) partially offset the substantial increase in vehicle miles traveled by road.9 In the
mid-1980s, fuel economy plateaued and then decreased slightly as consumers shifted from
traditional automobiles to less efficient trucks and sport utility vehicles; as a result, emissions
generally rose as highway use increased.
A two-decade stretch of travel growth from the mid-1980s to the mid-2000s stopped with
the 2007–2009 recession. Because of that break in the trend and further improvements in
fuel economy, transportation emissions in 2019 were slightly lower than their prerecession
high. Emissions fell sharply in 2020 as a result of the pandemic but rebounded in 2021.
Emissions of Carbon Dioxide in the Transportation Sector, Motor Vehicle Miles Traveled, and Emissions per Mile Traveled by
Light-Duty Vehicles Measured as a Percentage of Their Value in 1975
Percent
250 ● 243
200 Motor Vehicle Miles Traveled
Transportation sector
150 ● 145 emissions have not risen
nearly as much as vehicle
CO2 Emissions From Transportation miles traveled because
100 gains in fuel economy have
reduced emissions per mile
of travel.
50 ● 51
Emissions per Mile Traveled
by Light-Duty Vehicles
0
1976 1981 1986 1991 1996 2001 2006 2011 2016 202112 EMISSIONS OF CARBON DIOXIDE IN THE TRANSPORTATION SECTOR December 2022
Growth in Motor Vehicle Travel
The demand for passenger and freight transportation by motor vehicle has historically not
been very sensitive to the cost of such transportation and has typically declined only during
economic recessions. From 1990 to the mid-2000s, vehicle miles traveled by passenger and
freight motor vehicles grew steadily. The 2007–2009 recession disrupted that long-term
growth: Freight transportation by truck, in particular, fell—dropping by 14 percent from
2008 to 2011—before slowly climbing back toward its 2008 level.
In 2020, the growth of motor vehicle travel was temporarily reversed by the pandemic. As
economic activity slowed and people traveled less during the first year of the pandemic, the
number of vehicle miles traveled by passenger motor vehicles dropped by 12 percent.
Miles Traveled by Passenger and Freight Motor Vehicles, 1990 to 2020
Trillions of Vehicle Miles Traveled
3.5
3.0
Measured in terms of motor
vehicle miles traveled,
2.5 passenger and freight
transport by motor vehicle
2.0 grew at similar rates in the
1990s and early 2000s.
Passenger Freight transport by motor
1.5
vehicle fell as a result of
the 2007–2009 recession,
1.0
and passenger travel
dropped in 2020 during the
0.5 coronavirus pandemic.
Freight
0
1990 1995 2000 2005 2010 2015 2020December 2022 EMISSIONS OF CARBON DIOXIDE IN THE TRANSPORTATION SECTOR 13
Changes in Fuel Economy
Corporate average fuel economy (CAFE) standards set by the National Highway Traffic
Safety Administration (NHTSA) govern fuel consumption for light-duty vehicles. The
standards require each auto manufacturer to meet annual targets for the fuel economy of its
entire U.S. fleet, weighted to reflect the sales of different models. Those fleet-wide targets
account for different standards for vehicles of different sizes. The fuel economy ratings that
are used to determine compliance with CAFE standards are calculated using a series of labo-
ratory tests of fuel consumption under specific conditions.
Estimated “real-world” data about fuel economy and emissions are measured using tests
that incorporate a wider range of conditions than those used to determine compliance with
CAFE standards. That wider range of conditions—including hot and cold weather, higher
speeds, and faster accelerations—better reflects the conditions the average driver is likely
to encounter. The fuel economy values found on the window stickers of new cars, which
are roughly 20 to 30 percent lower than the values used to determine compliance with
CAFE standards, are based on the same tests as those used for the real-world data, though
the calculations of the two measures differ slightly: Highway driving is weighted more heavily
in the mix of driving between city and highway conditions used to calculate the real-world
measure than it is in the calculation of the sticker value.
Average real-world fuel economy for new light-duty vehicles increased from an average of
20 miles per gallon in 2005 to an average of 25 miles per gallon in 2021. (By comparison,
the average fuel economy of the largest trucks in service was 6 miles per gallon in 2019.)10
Emissions of carbon dioxide per vehicle mile for new light-duty vehicles dropped accord-
ingly—from an average of 0.99 pounds per vehicle mile in 2005 to an average of
0.77 pounds per vehicle mile in 2021.
Real-World Fuel Economy of and Carbon Dioxide Emissions From New Light-Duty Vehicles, 1975 to 2021
Miles per Gallon Fuel Economy
30
● 25.3
20
10
The fuel economy of new
0 light-duty vehicles in the
United States has improved
Pounds of Carbon Dioxide per Mile
Emissions by about one quarter over
the past 15 years. As fuel
2.0 economy improved, CO2
emission rates fell.
1.5
1.0
● 0.77
0.5
0
1976 1981 1986 1991 1996 2001 2006 2011 2016 202114 EMISSIONS OF CARBON DIOXIDE IN THE TRANSPORTATION SECTOR December 2022
Projections of Carbon Dioxide Emissions From Transportation
Drawing on estimates from the Energy Information Administration (EIA) and adjusting
them for subsequent changes in relevant laws and regulations, CBO projects that transporta-
tion emissions of carbon dioxide will decline over the next decade as electric and other more
fuel-efficient vehicles (including those produced in accordance with the 2022 increases to the
CAFE standards for model years 2024, 2025, and 2026) constitute a larger share of the
vehicle stock. The reductions in emission rates are projected to outweigh increases in vehicle
miles traveled, reducing total CO2 emissions from transportation, on net. In CBO’s projec-
tions, transportation-related emissions of CO2 fall by 9 percent from 2021 to 2032—from
1.74 BMT to 1.59 BMT, which is 15 percent less than the 1.86 BMT of such emissions
produced in 2005. (For a discussion of the method that CBO used to make its projections,
see Appendix A.)
Carbon Dioxide Emissions From Transportation, 1975 to 2032
Billions of Metric Tons
2.0 1.86 Projected
1.74
1.59
1.5 CO2 emissions from motor
vehicles are projected
to decline as recent and
scheduled increases in fuel
1.0 economy standards for
new vehicles, combined
with greater use of electric
vehicles, lower the average
0.5 rate of emissions of vehicles
over time.
0
1977 1982 1987 1992 1997 2002 2007 2012 2017 2022 2027 2032December 2022 EMISSIONS OF CARBON DIOXIDE IN THE TRANSPORTATION SECTOR 15
Changes in Standards, Electric Vehicle Incentives, and Emissions
Increases in CAFE and greenhouse gas emissions standards and changes in incentives for
purchasing electric vehicles take time to improve the average fuel economy of vehicles on the
road because the stock of vehicles is replaced slowly. The average age of passenger vehicles
driven in the United States is 12 years, so even several years after a new standard is adopted
or electric vehicle sales are boosted, most vehicles on the road will still be older models that
produce more emissions. In CBO’s projections, regulatory and legislative changes adopted in
2021 and 2022 result in transportation-related CO2 emissions in 2032 that are 0.16 BMT
(or about 10 percent) lower than the agency estimates they would have been without those
changes.
Federal agencies are considering additional changes to CAFE and greenhouse gas emissions
standards, but those plans have not been incorporated into CBO’s emissions projections
because the proposals remain preliminary. In August 2022, NHTSA announced its intent to
analyze the potential environmental impacts of new CAFE standards for passenger cars and
light-duty trucks starting with model year 2027 and of new fuel efficiency standards for
heavy-duty pickup trucks and vans starting with model year 2029. Similarly, EPA has begun
work to establish new emissions standards for heavy-duty vehicles for model years 2027
through 2030 or later.
Projected Carbon Dioxide Emissions From Transportation Before and After the Changes in Fuel Economy Standards, Emissions
Standards, and Incentives for Electric Vehicles That Were Adopted in 2021 and 2022
Billions of Metric Tons
2.0
Before Changes
● 1.75
● 1.59
1.5 After Changes Higher fuel economy and
emissions standards,
combined with increases in
incentives for purchasing
1.0
electric vehicles, are
projected to reduce
transportation-related CO2
0.5 emissions in 2032 by about
10 percent.
0
2022 2024 2026 2028 2030 203216 EMISSIONS OF CARBON DIOXIDE IN THE TRANSPORTATION SECTOR December 2022
CAFE Standards
CAFE standards were first applied to model year 1978 vehicles and increased through the
early 1980s. The standards remained unchanged for many years thereafter. In accordance
with energy legislation enacted in 2007, the National Highway Traffic Safety Administration
set higher standards, which were implemented in two phases, one for model years 2012 to
2016 and the second for model years 2017 to 2025.
Issued in 2020, the Safer, Affordable, Fuel-Efficient (SAFE) Vehicles Rule replaced those
standards with lower standards: Whereas the earlier Phase 2 standards required an increase
in fuel economy of about 5 percent each year, the revised standards mandated a 1.5 percent
increase each year starting in 2021 and were projected to result in an industry-wide average
fleet fuel economy of about 40 miles per gallon in 2026. In 2022, NHTSA raised standards
once again, bringing them closer to the original Phase 2 standards by requiring increases of
8 percent annually for model years 2024 and 2025 and an increase of 10 percent for model
year 2026; NHTSA projected that those new standards would result in an industry-wide fleet
average (among cars and light trucks) of approximately 49 miles per gallon in 2026.
A fleet’s average fuel economy depends not only on the fuel economy of each model of car
and truck but also on the mix of vehicles sold. Light-duty trucks, which include popular
compact sport utility vehicles, represented only half of sales of new light-duty vehicles as
recently as 2013 but outsold cars 3 to 1 by 2021. (Although only standards for light-duty
vehicles are shown below, NHTSA has set additional Phase 2 standards that currently apply
to commercial trucks, large pickup trucks, vans, and all buses and work trucks of model years
2021 to 2027.)
CAFE Standards for and Estimated Fuel Economy of New Light-Duty Vehicles, 1978 to 2026
Miles per Gallon
Passenger Cars Light Trucks
2022 Rule
Phase 2
SAFE
The 2022 increase in CAFE
Estimated standards represents a
Fuel Economy substantial increase in fuel
economy over the previous
Standard SAFE Rule and returns the
standards closer to the
earlier Phase 2 standards.December 2022 EMISSIONS OF CARBON DIOXIDE IN THE TRANSPORTATION SECTOR 17
Greenhouse Gas Emissions Standards
New motor vehicles are also subject to greenhouse gas emissions standards established by
the Environmental Protection Agency (EPA) under the Clean Air Act. For many years, EPA
aligned its standards with NHTSA’s CAFE program, but the two sets of standards diverged
with the latest regulatory changes announced by the agencies for the 2023–2026 period.
EPA states that the model year 2026 emissions standard of 161 grams per mile is equiva-
lent to a 55 mile per gallon fuel economy standard if the emissions standard was met solely
by reducing tailpipe emissions.11 But manufacturers can reduce their emissions to meet the
standard in a number of ways, including by producing alternative-fuel vehicles, improving
the integrity and efficiency of air-conditioning systems, and implementing other technologies
that improve the operating efficiency of their vehicles. (Such technologies can also be used to
meet CAFE standards.) The different pathways to compliance make it difficult to determine
whether the fuel economy standards or emissions standards have the greater effect on emis-
sions; CBO expects that the changes in CAFE standards and emissions standards will have
similar effects on CO2 emissions.
The timing of changes in emissions in relation to changes in the standards is affected by
a system of emissions credits. Manufacturers can earn credits by achieving lower average
annual emissions than required under the standard and accumulate them for use in future
years. They can also sell those credits to other automakers that would otherwise fall short of
the standard. Such trading lowers the overall costs for the industry of meeting the standards.
Credits can even be applied retroactively: Firms have three years in which to bank or acquire
the necessary amounts to achieve compliance. (The CAFE standards program has a similar
credit system.)
After accumulating a stockpile of credits in the early years of the program, manufacturers
used an average of 0.02 BMT of credits per year from 2016 to 2020. As a result, vehicles of
those model years will emit an average of 0.02 BMT of CO2 more over their lifetime than
the standards would suggest. A bank of 0.10 BMT of credits is expected to carry over from
2021 to 2022.
Greenhouse Gas Emissions Standards and Estimated Emissions for New Light-Duty Vehicles, 2012 to 2026
Grams per Mile
300
250
From 2012 to 2015, auto
manufacturers achieved
200 better emissions results
than the EPA standard.
Since then, the estimated
150
Greenhouse industry-wide emission rate
Gas Standard has exceeded the standard.
100 In December 2021, EPA
adopted more stringent
standards for model years
50 2023 to 2026.
Estimated
Emissions
0
2012 2014 2016 2018 2020 2022 2024 202618 EMISSIONS OF CARBON DIOXIDE IN THE TRANSPORTATION SECTOR December 2022
Demand for Electric Vehicles
Electric vehicle sales (including sales of plug-in hybrids and all-electric vehicles) have grown
substantially over the past few years as the cost of batteries has declined, their storage capacity
has increased, and charging infrastructure has expanded. In 2021, 610,000 light-duty electric
vehicles were sold, and three-quarters of them relied entirely on electricity to operate. The
number of charging stations, small for many years, roughly doubled from 2019 to 2021.
About 6,600 stations offered the fastest charging rates (providing roughly 300 miles of charge
in one hour and 15 minutes) in 2021.12 (By comparison, approximately 130,000 stations sell
gasoline.13)
Electric vehicles are expected to make up a growing share of light-duty vehicle sales in
coming years. Projections of electric vehicle sales in 2030 vary widely because federal subsi-
dies for charging stations and electric vehicles changed in 2021 and 2022. Among the
changes were up to $7.5 billion in federal funding for new charging infrastructure and a
revised income tax credit of up to $7,500 per vehicle for buyers of qualifying plug-in electric
vehicles. Many states also provide financial incentives for purchasing electric vehicles. And in
California, by 2035, all new cars sold are required to be free of CO2 emissions.
Electric Vehicles’ Share of New Light-Duty Vehicle Sales, 2011 to 2021
Percent
1.1 Plug-in
Hybrids
Sales of electric vehicles
3.0
jumped in 2021 to account
for 4 percent of all new
All- light-duty vehicle sales.
Electric
Electric Vehicles’ Share of New Light-Duty Vehicle Sales in Recent Years and Selected Projections for 2030
Percent
70 Projected
60 57
50
50
Yuzawa Projections of the market
and Others
(2022) share of electric vehicle
40 39 sales in 2030 vary widely.
Central 34 Projection The seven projections that
32
Estimate Range
30 CBO examined range from
30 19 percent to 57 percent of
Mahajan
and Others all new light-duty vehicle
20 (2022) sales.
19
Larsen
10 and Others
4.1 (2022)
0.1 0.9
0
2011 2016 2021 2030December 2022 EMISSIONS OF CARBON DIOXIDE IN THE TRANSPORTATION SECTOR 19
Emissions Attributable to Electric Vehicles
Even as sales of electric vehicles are expected to rise substantially, the effect of that increase
on overall CO2 emissions depends on interactions with CAFE standards and greenhouse
gas emissions standards. Auto manufacturers might delay the adoption of fuel-saving and
emission-reducing features or lower the prices of their non-electric offerings in response to
greater sales of electric vehicles and still meet stricter fuel economy and emissions standards.
Those changes could offset reductions in emissions from sales of electric vehicles.
When comparing emissions from operating different types of vehicles, the emissions from
producing and distributing the power to operate the vehicles are relevant. A car getting
59.4 miles per gallon (the standard for new cars in 2026) will emit about 0.33 pounds of
CO2 per mile from burning motor fuel. Producing and distributing the fuel also creates
greenhouse gases. On average, those emissions add roughly 30 percent to the emissions
released from the tailpipe of a light-duty vehicle.14
No emissions are produced by the motor of a vehicle powered by electricity. However, gener-
ating electricity results in emissions, so the reduction in emissions represented by an electric
vehicle also depends on where its battery is charged. Some regions of the country have much
lower CO2 emission rates from electricity production than others. For example, in 2020,
generating one megawatt-hour of electricity in the California subregion of the Western
Electricity Coordinating Council resulted in an average of 514 pounds of CO2, whereas
generating the same amount of electricity in the Rockies subregion yielded 1,145 pounds of
CO2, on average.15 Such differences can lead to substantial variation in electric vehicle emis-
sions. For instance, a popular model of all-electric sedan powered in California in 2020 was
estimated to result in emissions of 0.15 pounds of CO2 per mile, but charged in Colorado,
that same vehicle was estimated to result in 0.33 pounds of CO2 per mile.16
As the generation of electricity becomes less carbon intensive in the future, emissions attrib-
utable to driving electric vehicles will decline accordingly. CBO projects that by 2030, CO2
emissions in the electric power sector will fall to half their 2021 level.17
Carbon Dioxide Emission Rate per Megawatt Hour of Electricity Production, by State, 2020
Pounds of Carbon Dioxide per Megawatt Hour
Emissions attributable to
electric vehicle use depend
on the emissions from
generating the electricity
used to power them. Some
parts of the country—
particularly those that
Less than 500 use more renewables and
natural gas than coal—can
500 to 999 generate electricity with
1,000 to 1,499 much lower CO2 emission
rates than others.
1,500 to 2,00020 EMISSIONS OF CARBON DIOXIDE IN THE TRANSPORTATION SECTOR December 2022
Effects of Economic Growth and Oil Prices on Future Emissions
Economic growth and the price of motor vehicle fuels affect total vehicle miles traveled and,
in turn, total CO2 emissions in the transportation sector. Growth that was faster or slower
than anticipated could cause emissions to be higher or lower than projected. In 2032, if real
GDP was 8 percent higher than it is in the Energy Information Agency’s baseline scenario,
transportation emissions would be 6 percent higher than projected, CBO estimates. If,
instead, real GDP was 6 percent lower than it is in EIA’s baseline scenario over that period,
emissions from transportation would be 5 percent lower.
Uncertainty about oil prices is estimated to have less of an impact on transportation emis-
sions. If higher-than-anticipated global demand for liquid fuels and lower-than-expected
supply resulted in oil prices in 2032 that were roughly half what they are in EIA’s baseline
scenario, transportation emissions would be 2 percent higher than projected, CBO estimates.
Alternatively, if oil prices in 2032 were double the projected amounts, emissions from
transportation would be 1 percent lower.
CBO’s Projections of Carbon Dioxide Emissions From Transportation Under Three Scenarios for Economic Growth, 2021 to 2032
Billions of Metric Tons
2.0
Higher Growth
● 1.69
● 1.59
1.5 EIA’s Baseline Scenario 1.51
Lower Growth ●
Economic growth over the
next decade that was higher
1.0 or lower than projected
could increase or decrease
transportation emissions by
several percent.
0.5
0
2022 2024 2026 2028 2030 2032December 2022 EMISSIONS OF CARBON DIOXIDE IN THE TRANSPORTATION SECTOR 21
1. Environmental Protection Agency, “Greenhouse Gas Emissions From a Typical Passenger Vehicle,”
EPA-420-F-18-008, (March 2018), https://tinyurl.com/bwmm8a6s.
2. International Energy Agency, Global Energy Review: CO2 Emissions in 2021 (March 2022),
https://tinyurl.com/mpzxthcp.
3. To estimate energy-related emissions of CO2 and other greenhouse gases for 2021, CBO used information
from Energy Information Administration, Monthly Energy Review (September 2022), www.eia.gov/
totalenergy/data/monthly/previous.php; and Environmental Protection Agency, Inventory of U.S. Greenhouse
Gas Emissions and Sinks: 1990–2020, EPA 430-R-22-003 (April 2022), https://tinyurl.com/2p8mhpe9. To
estimate non-energy-related emissions, CBO used data from Energy Information Administration, Annual
Energy Outlook 2018 (February 2018), www.eia.gov/outlooks/archive/aeo18/, that agency’s most recent long-
term projections from which CBO could make projections of non-energy-related emissions.
4. The contribution to warming per physical unit of gas differs for the various greenhouse gases. For simplicity,
greenhouse gases are often measured in terms of metric tons of carbon dioxide equivalent, or MT CO2e—
quantities of emissions that, over a period of years (usually a century), contribute to the greenhouse effect
by as much as a metric ton of CO2. See Environmental Protection Agency, Inventory of U.S. Greenhouse Gas
Emissions and Sinks: 1990–2020, EPA 430-R-22-003 (April 2022), https://tinyurl.com/2p8mhpe9.
5. For more details about the estimated effects of this illustrative emissions tax, see Congressional Budget Office,
“Impose a Tax on Emissions of Greenhouse Gases,” in Options for Reducing the Deficit, 2023 to 2032—
Volume I: Larger Reductions (December 2022), www.cbo.gov/budget-options/58638.
6. One pound of carbon in a fuel, when burned, combines with oxygen to create 3.7 pounds of CO2. A gallon
of gasoline contains about 5.3 pounds of carbon, so burning that fuel releases 19.6 pounds of CO2.
7. David Schrank and others, 2021 Urban Mobility Report (Texas A&M Transportation Institute, 2021),
https://mobility.tamu.edu/umr/report/.
8. CBO calculated those values using data from Environmental Protection Agency, The 2021 EPA Automotive
Trends Report: Greenhouse Gas Emissions, Fuel Economy, and Technology Since 1975, EPA-420-R-21-023
(November 2021) www.epa.gov/automotive-trends.
9. Light-duty vehicles include all personal vehicles except motorcycles. Light-duty vehicles are subject to fuel
economy standards, but motorcycles are not.
10. Stacy C. Davis and Robert G. Boundy, Transportation Energy and Data Book: Edition 40 (prepared by
Oak Ridge National Laboratory for the Department of Energy, February 2022, updated June 2022),
http://tedb.ornl.gov.
11. Environmental Protection Agency, Revised 2023 and Later Model Year Light-Duty Vehicle
Greenhouse Gas Emissions Standards: Regulatory Update, EPA-420-F-21-077 (December 2021),
https://tinyurl.com/27caws5n (PDF).
12. Department of Energy, “Electric Vehicle Charging Station Locations” (accessed on September 6, 2022),
https://tinyurl.com/bd8f7rv.
13. NACS, “U.S. Convenience Store Count” (accessed on September 6, 2022), https://tinyurl.com/mrxvsjyz.
14. John M. DeCicco, Factor Analysis of Greenhouse Gas Emissions From Automobiles, Social Science Research
Network working paper (December 2012), https://doi.org/10.2139/ssrn.2205144. Making gasoline available
to users requires several steps: Oil must be removed from the earth, moved to a refinery, and refined into
gasoline, and that gasoline must then be distributed to gas stations.
15. The California subregion’s emissions are moderately low, and the Rockies subregion’s emissions are moderately
high; emissions can be lower or higher than those values. The California subregion of the Western Electricity
Coordinating Council does not include all of the state of California, so the state average differs from the
subregion average. Environmental Protection Agency, “Emissions & Generation Resource Integrated
Database (eGRID) Summary Data” (accessed on September 2, 2022), www.epa.gov/egrid/summary-data.
16. Department of Energy and Environmental Protection Agency, “Beyond Tailpipe Emissions Calculator”
(accessed on September 2, 2022), www.fueleconomy.gov/feg/Find.do?action=bt2. Those estimates include
losses from the transmission and distribution of electricity. Losses that occur when charging electric vehicle
batteries typically add an average of 12 percent to 15 percent to those amounts. See John Voelcker, “EVs
Explained: Charging Losses,” Car and Driver (April 10, 2021), https://tinyurl.com/bdhj83md.
17. Congressional Budget Office, Emissions of Carbon Dioxide in the Electric Power Sector (December 2022),
www.cbo.gov/publication/58419.Appendix A: Analytic Method
This appendix provides information about the method that sectors from 2020 to 2021.2 To project emissions for
the Congressional Budget Office used to analyze trends in 2021, CBO applied the percentage changes in EIA’s
energy-related emissions of carbon dioxide (CO2). estimates to EPA’s estimates for 2020.
The Environmental Protection Agency (EPA) provides For projections of energy-related emissions of CO2 in the
information about the amount and sources of emissions transportation sector from 2022 to 2032, CBO applied
of greenhouse gases in the United States.1 In its annual the annual percentage change in transportation emis-
inventory, EPA catalogs emissions of carbon dioxide, sions between 2020 and each of those years in EIA’s most
methane, nitrous oxide, and other greenhouse gases. recent long-term projections to EPA’s 2020 estimate.3
Because EPA’s 2022 inventory reports emissions through CBO then adjusted the resulting emissions to make them
2020, information about 2021 is not directly available. consistent with CBO’s projections of gasoline use, which
Although the Energy Information Administration (EIA) were revised to reflect the April 2022 change to the cor-
reports energy-related emissions of CO2 on a sectoral porate average fuel economy (CAFE) standards for 2024
basis through 2021, the agency does not publicly report to 2026 and to account for the reconciliation legislation
non-energy-related emissions of CO2 or emissions of enacted in 2022 (Public Law 117-169), neither of which
other greenhouse gases. Furthermore, EIA’s estimates of were reflected in EIA’s long-term projections. To estimate
annual energy-related emissions of CO2 in 2020 differ the effects of the law’s provisions, CBO relied on a set of
from those of EPA by about 5 percent; much of the studies that estimated the effects of the reconciliation act
difference is attributable to the estimates of emissions in on transportation emissions in 2030.4
the industrial sector.
2. Energy Information Administration, Monthly Energy Review
To describe trends in energy-related emissions of CO2
(September 2022), www.eia.gov/totalenergy/data/monthly/
through 2021, CBO began with EPA’s estimates of previous.php.
emissions through 2020 for each energy-using sector of
the economy—transportation, electric power, industrial, 3. Energy Information Administration, Annual Energy Outlook
2022 (March 2022), www.eia.gov/outlooks/aeo.
residential, and commercial. Using EIA’s estimates of
emissions, CBO then calculated the percentage increase 4. John Larsen and others, A Turning Point for U.S. Climate
or decrease in the estimate of emissions in each of those Progress: Assessing the Climate and Clean Energy Provisions in the
Inflation Reduction Act (Rhodium Group, August 2022), https://
tinyurl.com/2yddcr26; and Megan Mahajan and others, Updated
1. Environmental Protection Agency, Inventory of U.S. Greenhouse Inflation Reduction Act Modeling Using the Energy Policy Simulator
Gas Emissions and Sinks: 1990–2020, EPA 430-R-22-003 (April (Energy Innovation, August 2022), https://tinyurl.com/
2022), https://tinyurl.com/2p8mhpe9. yhcrc4n5.Appendix B: Data Sources for Figures Shares of Energy-Related Emissions of Carbon Dioxide, by Economic Sector, 2021 Congressional Budget Office, using data from Energy Information Administration, Monthly Energy Review (September 2022), www.eia.gov/totalenergy/data/monthly/previous.php; and Environmental Protection Agency, Inventory of U.S. Greenhouse Gas Emissions and Sinks: 1990–2020, EPA 430-R-22-003 (April 2022), https://tinyurl.com/2p8mhpe9. Energy-Related Emissions of Carbon Dioxide, by Economic Sector, 1975 to 2021 Congressional Budget Office, using data from Energy Information Administration, Monthly Energy Review (September 2022), www.eia.gov/totalenergy/data/monthly/previous.php; and Environmental Protection Agency, Inventory of U.S. Greenhouse Gas Emissions and Sinks: 1990–2020, EPA 430-R-22-003 (April 2022), https://tinyurl.com/2p8mhpe9. Estimated Effects of a $25-per-Ton Tax on Energy-Related Emissions of Carbon Dioxide That Grows at an Inflation-Adjusted Annual Rate of 5 Percent, by Economic Sector Ron Gecan, How Carbon Dioxide Emissions Would Respond to a Tax or Allowance Price: An Update, Working Paper 2021-16 (Congressional Budget Office, December 2021), www.cbo.gov/publication/57580. Shares of Transportation-Related Carbon Dioxide Emissions, by Mode of Transportation, 2019 Congressional Budget Office, using data from Environmental Protection Agency, Inventory of U.S. Greenhouse Gas Emissions and Sinks: 1990–2020, EPA 430-R-22-003 (April 2022), https://tinyurl.com/2p8mhpe9. Shares of Passenger-Miles Traveled, by Mode of Transportation, 2019 Congressional Budget Office, using data from Bureau of Transportation Statistics, National Transportation Statistics 2021 (November 2021), Table 1-40, www.bts.gov/topics/ national-transportation-statistics. Average Carbon Dioxide Emissions per Passenger-Mile, by Mode of Transportation, 2019 Congressional Budget Office, using data from Bureau of Transportation Statistics, National Transportation Statistics 2021 (November 2021), Table 1-40, www.bts.gov/topics/ national-transportation-statistics; Stacy C. Davis and Robert G. Boundy, Transportation Energy and Data Book: Edition 40 (prepared by Oak Ridge National Laboratory for the Department of Energy, February 2022, updated June 2022), http://tedb.ornl.gov; and Environmental Protection Agency, Inventory of U.S. Greenhouse Gas Emissions and Sinks: 1990–2020, EPA 430-R-22-003 (April 2022), https://tinyurl.com/2p8mhpe9.
26   EMISSIONS OF CARBON DIOXIDE IN THE TRANSPORTATION SECTOR                                     December 2022

     Emissions of Carbon Dioxide From Heavy-Rail Transit Systems, by Carbon
     Content of Electricity and Load Factor, 2019
     Congressional Budget Office, using data from Federal Transit Administration, “National
     Transit Database (NTD) Data,” (accessed on September 6, 2022), www.transit.dot.gov/ntd/
     ntd-data, and methods from Federal Transit Administration, Public Transportation’s Role in
     Responding to Climate Change (January 2010), https://rosap.ntl.bts.gov/view/dot/17277.

     Shares of Ton-Miles of Freight, by Mode of Transportation, 2019
     Congressional Budget Office, using data from Bureau of Transportation Statistics,
     National Transportation Statistics 2021 (November 2021), Table 1-50, www.bts.gov/topics/
     national-transportation-statistics.

     Average Carbon Dioxide Emissions per Ton-Mile of Freight, by Mode of
     Transportation, 2019
     Congressional Budget Office, using data from Bureau of Transportation Statistics,
     National Transportation Statistics 2021 (November 2021), Table 1-50, www.bts.gov/topics/
     national-transportation-statistics; and Environmental Protection Agency, Inventory of
     U.S. Greenhouse Gas Emissions and Sinks: 1990–2020, EPA 430-R-22-003 (April 2022),
     https://tinyurl.com/2p8mhpe9.

     Emissions of Carbon Dioxide in the Transportation Sector, Motor Vehicle Miles
     Traveled, and Emissions per Mile Traveled by Light-Duty Vehicles Measured as
     a Percentage of Their Value in 1975
     Congressional Budget Office, using data from Bureau of Transportation Statistics,
     National Transportation Statistics 2021 (November 2021), Table 1-35, www.bts.gov/topics/
     national-transportation-statistics; Energy Information Administration, Monthly Energy
     Review (September 2022), www.eia.gov/totalenergy/data/monthly/previous.php; and
     Environmental Protection Agency, Inventory of U.S. Greenhouse Gas Emissions and Sinks:
     1990–2020, EPA 430-R-22-003 (April 2022), https://tinyurl.com/2p8mhpe9, and The
     2021 EPA Automotive Trends Report: Greenhouse Gas Emissions, Fuel Economy, and Technology
     Since 1975, EPA-420-R-21-023 (November 2021), www.epa.gov/automotive-trends.

     Miles Traveled by Passenger and Freight Motor Vehicles, 1990 to 2020
     Congressional Budget Office, using data from Bureau of Transportation Statistics,
     National Transportation Statistics 2021 (November 2021), Table 1-35, www.bts.gov/topics/
     national-transportation-statistics.

     Real-World Fuel Economy of and Carbon Dioxide Emissions From New Light-
     Duty Vehicles, 1975 to 2021
     Congressional Budget Office, using data from Environmental Protection Agency, The
     2021 EPA Automotive Trends Report: Greenhouse Gas Emissions, Fuel Economy, and Technology
     Since 1975, EPA-420-R-21-023 (November 2021), www.epa.gov/automotive-trends.

     Carbon Dioxide Emissions From Transportation, 1975 to 2032
     Congressional Budget Office, using data from Energy Information Administration, Monthly
     Energy Review (September 2022), www.eia.gov/totalenergy/data/monthly/previous.php, and
     Annual Energy Outlook 2022 (March 2022), www.eia.gov/outlooks/aeo/; and Environmental
     Protection Agency, Inventory of U.S. Greenhouse Gas Emissions and Sinks: 1990–2020,
     EPA 430-R-22-003 (April 2022), https://tinyurl.com/2p8mhpe9.
APPENDIX B: DATA SOURCES FOR FIGURES EMISSIONS OF CARBON DIOXIDE IN THE TRANSPORTATION SECTOR 27 Projected Carbon Dioxide Emissions From Transportation Before and After the Changes in Fuel Economy Standards, Emissions Standards, and Incentives for Electric Vehicles That Were Adopted in 2021 and 2022 Congressional Budget Office, using data from Energy Information Administration, Monthly Energy Review (September 2022), www.eia.gov/totalenergy/data/monthly/previous.php, and Annual Energy Outlook 2022 (March 2022), www.eia.gov/outlooks/aeo/; Environmental Protection Agency, Inventory of U.S. Greenhouse Gas Emissions and Sinks: 1990–2020, EPA 430-R-22-003 (April 2022), https://tinyurl.com/2p8mhpe9; Corporate Average Fuel Economy Standards for Model Years 2024–2026 Passenger Cars and Light Trucks, 87 Fed. Reg. 25710 (May 2, 2022); John Larsen and others, A Turning Point for US Climate Progress: Assessing the Climate and Clean Energy Provisions in the Inflation Reduction Act (Rhodium Group, August 2022), https://tinyurl.com/2yddcr26; and Megan Mahajan and others, Updated Inflation Reduction Act Modeling Using The Energy Policy Simulator (Energy Innovation, August 2022), https://tinyurl.com/yhcrc4n5. CAFE Standards for and Estimated Fuel Economy of New Light-Duty Vehicles, 1978 to 2026 Congressional Budget Office, using data from National Highway Traffic Safety Administration, “MY 2011–2020 Compliance Overview and Credit Flexibility Report” (accessed on July 18, 2022), https://one.nhtsa.gov/cafe_pic/home/ldreports, “Fleet Fuel Economy Performance Report” (October 15, 2019), https://tinyurl.com/yckjt9b9, and “Summary of Fuel Economy Performance (Public Version)” (December 15, 2014), https:// tinyurl.com/c4dent4b (PDF); Corporate Average Fuel Economy Standards for Model Years 2024–2026 Passenger Cars and Light Trucks, 87 Fed. Reg. 25710 (May 2, 2022); The Safer Affordable Fuel-Efficient (SAFE) Vehicles Rule for Model Years 2021–2026 Passenger Cars and Light Trucks, 85 Fed. Reg. 24174 (April 30, 2020); and 2017 and Later Model Year Light-Duty Vehicle Greenhouse Gas Emissions and Corporate Average Fuel Economy Standards, 77 Fed. Reg. 62624 (October 15, 2012). Greenhouse Gas Emissions Standards and Estimated Emissions for New Light- Duty Vehicles, 2012 to 2026 Congressional Budget Office, using data from Environmental Protection Agency, Revised 2023 and Later Model Year Light-Duty Vehicle Greenhouse Gas Emissions Standards: Regulatory Update, EPA-420-F-21-077 (December 2021), https://tinyurl.com/27caws5n (PDF), and The 2021 EPA Automotive Trends Report: Greenhouse Gas Emissions, Fuel Economy, and Technology Since 1975, EPA-420-R-21-023 (November 2021), www.epa.gov/ automotive-trends. Electric Vehicles’ Share of New Light-Duty Vehicle Sales, 2011 to 2021 Congressional Budget Office, using data from Bureau of Transportation Statistics, National Transportation Statistics 2021 (November 2021), Table 1-17, www.bts.gov/topics/ national-transportation-statistics; and Department of Energy, “Light-Duty Plug-in Electric Vehicle Sales in the United States Nearly Doubled From 2020 to 2021,” Transportation Fact of the Week 1227 (February 28, 2022), https://tinyurl.com/2c3atdbp.
You can also read