Integrating climate risk into ship finance lending decisions - A preliminary guide
←
→
Page content transcription
If your browser does not render page correctly, please read the page content below
Integrating climate risk
into ship finance lending
decisions
A preliminary guide
 July 2020
Authors
Sophie Parker, Jean-Marc Bonello

Disclaimer
The information contained in this report is not an alternative to advice from an appropriately qualified
professional. If you have any specific questions about any financial or technical matters you should
consult an appropriately qualified professional. UMAS will not be liable for any business losses,
including without limitation loss of or damage to profits, income, revenue, use, production, anticipated
savings, business, contracts, commercial opportunities or goodwill.

About UMAS International Ltd.
UMAS undertakes research using models of the shipping system, shipping big data (including satellite
Automatic Identification System data), and qualitative and social science analysis of the policy and
commercial structure of the shipping system. Research and consultancy is centred on understanding
patterns of energy demand in shipping and how this knowledge can be applied to help shipping
transition to a low-carbon future. UMAS is world-leading on two key areas; using big data to understand
trends and drivers of shipping energy demand or emissions and using models to explore what-ifs for
future markets and policies. For more details visit www.u-mas.co.uk.

Contact person
If you require any further information on this report please contact:

Sophie Parker
Central House
14 Upper Woburn Place
London
WC1H 0NN
sophie.parker@u-mas.co.uk

Integrating climate risk into ship finance lending decisions
 1
Contents
Authors .................................................................................................................................................... 1
Disclaimer................................................................................................................................................ 1
About UMAS International Ltd. ............................................................................................................... 1
Contact person ........................................................................................................................................ 1
1 Executive summary.......................................................................................................................... 3
2 Mapping transition risk factors from climate change ....................................................................... 5
 2.1 Regulation context and implications ....................................................................................... 6
3 Measuring climate alignment ........................................................................................................... 8
4 Understanding the drivers of portfolio alignment ........................................................................... 11
5 Translating climate alignment into risk ........................................................................................... 12
 5.1 Incorporating climate risk into credit risk models .................................................................. 13
6 Solutions available for aligning portfolios ...................................................................................... 15

Integrating climate risk into ship finance lending decisions
 2
1 Executive summary
The IMO’s 2020 sulphur regulation has created a commercial conundrum for the shipping industry. The
response has been fragmented; some shipowners are fitting their ships with scrubbers, investing in
LNG-fuelled ships, switching to low-sulphur fuel oil or taking a mixed approach. Making matters more
complex is the linkage between investments made to address sulphur regulation and their implications
for meeting future GHG regulation.

The IMO’s Initial Strategy to tackle GHG emissions sets an absolute GHG emission reduction target by
2050 and a carbon intensity target as early as 2030. The Strategy’s absolute target translates into an
approximately 85% required reduction in intensity, with 100% reduction still on the cards. Several
leading shipowners have come out in support of the Strategy; Maersk, the world’s largest shipping
company, announced earlier this year that to achieve this goal, “carbon neutral vessels must be
commercially viable by 2030, and an acceleration in new innovations and adaption of new technology
is required.” Research into low carbon pathways by Lloyd’s Register and UMAS 1 also echoes this
timeline, due the long asset lifetime of ships and large reductions required for the sector. The increasing
momentum to prepare for climate resilience was evidenced by eleven financial institutions (representing
20 per cent of the $450bn global shipping market) signing up to the Poseidon Principles in June 2019.2
The initiative was established to assess and disclose the climate alignment of ship finance portfolios. It
is becoming increasingly clear that shipping companies and banks which take steps to prepare for this
new future will be more resilient to earnings and residual value risks which will affect the associated
financial institutions’ loan portfolios.

While there is growing policy momentum to deal with the carbon intensity of shipping, activity on the
part of listed shipping companies has been limited. A survey of 18 of the largest publicly listed shipping
companies showed that “only three are seriously working to develop technologies that can help
transform the industry for a low-carbon future”.3 This is a challenge for shipping companies and for their
lenders due to the emergence of zero emissions ships into the market that is expected to hit mid-way
or sooner into the existing fleet’s lifetime.

This report provides a preliminary guide for how financial institutions and investors could incorporate
climate risk into their lending and investing decisions and how they can take advantage of opportunities
to invest in more efficient tonnage. The report focuses on the risks that are being created by the IMO’s
GHG regulation and by the adoption of disruptive clean technology. The report has four
recommendations for banks to follow to incorporate climate risk into their portfolio risk management
practice:

 1. Measure and disclose the climate alignment of a ship finance portfolio.
 2. Assess why a portfolio was misaligned or aligned with the climate target for the
 reporting period.
 3. Assess the financial risks of misaligned vessels in a portfolio and the opportunities
 to align vessels to the climate target.
 4. Determine what solutions are available to align vessels to climate targets over
 their financing period.

The first recommendation is to improve transparency of the carbon footprint of the ship finance portfolio.
Disclosure of the carbon footprint of a ship finance portfolio raises the understanding on the part of ship

1 LR, UMAS (2018) Zero-Emission Vessels: Transition Pathways
2 As of June 2020, the number of signatories stood at 18.
3 Marcell, et. al. (2019) A sea change: which shipping companies are ready for the low-carbon transition? Available at:
https://bit.ly/2YQMULe (Accessed: January 24, 2020).
Integrating climate risk into ship finance lending decisions
 3
financiers and bank stakeholders to climate risk as a significant portfolio evaluation criterion. It provides
the impetus for making financing decisions which favour less carbon intensive investments and enables
banks to engage with their clients on emissions mitigation. The Poseidon Principles is the first sector-
specific initiative to measure alignment to climate targets of banking portfolios, providing a common
baseline for banks to measure their progress against climate targets over time.

 Recommendation 1.
 Measure and disclose the climate alignment of a ship finance portfolio.

Secondly, financial institutions should assess why their portfolio was aligned or misaligned with the
climate target for the reporting period. A portfolio can be misaligned as a result of a high volume of
misaligned ships, high loan values associated with misaligned ships, or some combination of these
factors. Analysis should provide insight into the sources of misalignment by ship characteristics (e.g.,
type and size) and if necessary, by individual vessel level.

Carbon intensity is sensitive to a number of parameters, which may not be stable over time, such as
speed, time spent in port, and the amount of cargo carried. Therefore, even if a portfolio is aligned in
the current reporting period, certain market conditions could tip it into misalignment later on. If possible,
it is therefore important to determine the drivers of the carbon intensity values and monitor carbon
intensity values over the year to avoid unexpected surprises.

 Recommendation 2.
 Assess why a portfolio was misaligned or aligned with the climate target for the reporting
 period.

Whether the existing vessels in a portfolio or vessels that are being considered for financing in the future
face a valuation risk depends on the earnings performance and residual value (second-hand value) risk
under different scenarios. While in most markets, zero carbon ships are still some years away from
entering the market, more efficient vessels ratchet down the margins achieved by less efficient vessels
as charterers bid for the lowest cost vessel which meets their criteria. The asset valuation of vessels
therefore depends on the fuel savings compared to the median vessel, the vessel’s future exposure to
a market with zero carbon emissions vessels and its ability to cost-effectively reduce its emissions to
compete with more efficient vessels. Typical valuation models use current market trends, useful life
expectations and simplified technical efficiency metrics to value ships. These models disregard the
potential impact that future policy and technology disruption have on future earnings and the residual
value. There is therefore a fundamental systemic failure in valuation at present which doesn’t address
the impact of longer-term (more than 5 years) environmental regulation and disruptive technological
risk on ship earnings and residual values.

Investment models should factor in the impact of longer-term GHG measures (e.g., a fuel levy) that
incentivise zero emissions vessels (ZEVs) to enter the market. Under a scenario in which ZEVs are
more profitable (due to lower GHG/carbon costs and higher revenues paid to zero carbon service
providers), the economic lifetime of a fossil-fuelled ship could be shortened significantly, and the
residual value would drop more sharply compared to a BAU scenario.

 Recommendation 3.
 Assess the financial risks of misaligned vessels in a portfolio and the opportunities to align
 vessels to the climate target.

Integrating climate risk into ship finance lending decisions
 4
The fourth recommendation is to determine what solutions are available to align vessels to climate
targets over their financing periods. Mitigation solutions should be targeted at vessels which have a
high carbon intensity, debt exposure and longer remaining financing period as the portfolio is most
sensitive to changes in these values. Vessels with a longer financing period should be targeted because
they have more years to payback the intervention. The type of solution will depend on the economic
years remaining on the asset and the time remaining on the loan. For example, for the ships which are
classified as targets, zero emission fuel compatibility could be investigated which would allow a ship to
meet longer term climate targets. If the ship is older and not currently technologically advanced, retrofit
solutions or speed reduction could be investigated. A bank could use this assessment in conjunction
with other financial risk criteria to determine if a ship should be re-financed. Innovative financing such
as green bonds should be considered to finance ships which are targeted for a technology investment.

 Recommendation 4.
 Determine what solutions are available to align vessels to climate targets over their
 financing period.

 .
This report is outlined as follows. Section 2 provides context on the climate risks that the report focuses
on, namely transition risks. It also discusses the current regulation and policies being considered at the
IMO and the risks associated with the policies being considered. The following sections discuss the
recommendations in the report.

2 Mapping transition risk factors from climate change
Climate-related risks are divided into transition risks – risks related to the transition to a low carbon
economy – and adaptation risks, related to the physical impacts of climate change. The Task Force on
Climate-Related Financial Disclosure (TCFD) identifies policy and legal, technology, market and
reputation as transition risks.4 Policy actions to mitigate climate change include implementing carbon-
pricing policies to reduce GHG emissions, shifting energy use toward lower emission sources, and
adopting energy-efficiency solutions. Technological changes that bring low-carbon technology/fuels to
the market such as renewable energy, battery storage, energy efficiency and carbon capture and
storage have the potential to displace existing systems and affect competitiveness of ships. Wider
market risks include risks to demand and supply as a result of demand destruction of fossil fuels and
the cost of fuel affecting the supply of transportation services. Reputational risks are also at stake, as
consumers and investors demand companies are taking actions to mitigate climate change and can
change the flow of funds from browner to greener companies or increase interest rates of browner
investments. Figure 1 provides a mapping of the key transition risk factors in the shipping sector, the
evidence that needs to be present for increased risk and the potential financial impacts that would result
in the shipping sector.

The focus of this paper is on supply side risks due to regulation and disruptive technology and fuels.
We do not address demand destruction of fossil fuels and their impact on the shipping industry,
however, literature on this topic shows that a 1.5°C scenario would negatively impact the tanker and
bulk markets due to their reliance on fossil fuels and will need to be factored in on top of the transition
risks that are described in this paper as inflection points become more discernible.5

4
 TCFD (2017) Recommendations of the Task Force on Climate Disclosures. Available at: https://bit.ly/2YTIB1N (Accessed:
August 23, 2019).
5
 MSI (2019) Carbon Carriers: Executive Summary. Available at: https://bit.ly/2YSVYza (Accessed: August 23, 2019).
Integrating climate risk into ship finance lending decisions
 5
Figure 1: Mapping Transition Risk Factors

2.1 Regulation context and implications
Shipping’s governing body, the International Maritime Organisation (IMO), reached an agreement in
April 2018 to reduce emissions generated by shipping activity, which represented a significant shift in
climate ambition for a sector that currently accounts for 2-3% of global carbon dioxide emissions. This
deal sets out three objectives, two of which require emission reduction targets.

First, carbon dioxide emissions have to be reduced by “at least” 50% compared to 2008 levels by 2050,
with a strong emphasis on increasing the cut towards 100%. Figure 2 shows the lower bound (50%
reduction), middle reduction scenario (70% reduction) and upper bound (100% reduction). The baseline
year is set to an abnormally high level because the global economy was still in a boom period until late
2008. Estimates of global emissions between 2008 and 2012 (the last officially recorded year of global
emissions in international shipping) show that emissions declined by 14%. Depending on the IMO’s
next GHG study (expected in late 2020/21), there could be a further decline, which would put pressure
to achieve a greater target than 50%, in addition to pressure from the United Nations.

Second, carbon intensity, defined as the amount of CO 2 emitted to provide 1 unit of transport work
(typically measured in tonne-nm), has to be reduced by at least 40% by 2030 based on 2008 levels, but
should pursue efforts towards 70% by 2050.6

Nations pledged in the 2015 Paris Agreement “to achieve a balance between anthropogenic emissions
by sources and removals by sinks of greenhouse gases in the second half of this century”. This means
getting to “net zero emissions” between 2050 and 2100. 2050 therefore represents a key milestone in
the Paris Agreement, which the IMO explicitly references in its Strategy.

6
 IMO (2018) MEPC.304(72).
Integrating climate risk into ship finance lending decisions
 6
Figure 2: Global fleet’s CO2 targets and trajectories under IMO targets (million tons of CO2)

The Strategy does not alone secure 1.5°C, but it increases the possibility of being able to keep global
average temperature increases within this limit. Immediate measures to implement the Strategy will be
required to urgently peak and reduce GHG emissions in line with 1.5°C. The Strategy will be reviewed
in light of the UN's IPCC 1.5°C report in September, which will likely be helpful for strengthening it.
Stabilisation of temperatures at 1.5°C would require 100% GHG reduction by 2050, the most ambitious
reduction goal.

The IMO’s Strategy includes proposed measures to enable the sector to meet the Strategy’s
decarbonisation goal. These global measures include short-term and longer-term policy measures with
current focus being on the former at the MEPC. At the GHG Intersessional Working Group in November
2019, short-term measures included technical efficiency measures and goal-based operational
efficiency targets. All proposals are still on the table, which could mandate a speed limit or be based on
improvements in operational efficiency (the latter would be most closely aligned with a carbon intensity
metric, the metric used in the Poseidon Principles). An operational efficiency target provides more
flexibility for shipowners, which can meet vessel operational efficiency targets by reducing vessel speed,
increasing utilisation, performing energy efficiency improvements through retrofits, switching to a lower
carbon fuel or a combination of these factors. Increasing utilisation is beneficial to shipowners, as well
as improvements in energy efficiency retrofits through its impact on lower operational costs which
payback the capital costs invested. The extent to which speed and utilisation can be improved is
dependent on the market segment. For example, the container sector has much more control over its
speed and utilisation than in the bulk shipping sector. If the IMO does not enact effective global
measures to reduce emissions from ships by 2023, the EU intends to include shipping in its emissions
trading system (ETS).

Over the medium term (2023-2030) and beyond 2030, the IMO will focus on the implementation of low
to zero emission fuels. Policies that are likely to be considered include a fuel standard (e.g. mandating
a lowering of the carbon content of fuels) and market-based mechanisms (e.g., a carbon tax or permit).
In order to enable the transition, these policies will make fossil-fuelled vessels uncompetitive and
unprofitable because of higher fuel costs compared to other ships in the fleet. This will then result in
either forcing early scrappage or an expensive retrofit, or in some circumstances continued operation
at current specification but whilst absorbing a large additional cost (driven by carbon pricing). The timing
of when policy and/or market (e.g. price premiums paid for zero emission services) forces might create
this commercial pressure is uncertain but will reduce in uncertainty over time.

Integrating climate risk into ship finance lending decisions
 7
Financial regulators are increasingly considering the inclusion of climate risk in their operations. Central
banks in England, France, the Netherlands and Singapore are implementing stress tests to understand
the financial resilience of the largest banks, insurers and the financial system. These signals coupled
with the push from the TCFD to measure and disclose climate risk provides increased transparency
whilst also becoming a tool for financial institutions to shift their portfolios to a more resilient mix of
investments.

3 Measuring climate alignment
At its most basic level, climate alignment is the degree to which a sector, vessel or portfolio of vessels
(the “unit”) is in line with a decarbonisation trajectory to meet a climate goal (e.g., the IMO’s absolute
reduction target). It can be measured as the percentage difference between the “unit” and the required
climate target measured at the same point in time.

While absolute emissions shine a light on the companies with the greatest impact on total emissions, it
does not measure the CO2 efficiency with which it conducts its business activities. The Climate
Disclosure Project recommends calculating and reporting transport emissions using both an absolute
figure and an intensity measurement.7 An intensity measurement is recommended because business
activities should be measured in relation to how much transport work it produces. In shipping, this can
be measured using carbon intensity, which represents the total operational emissions generated to
satisfy a supply of transport work (gCO 2/tonne-nm, the production unit). Carbon intensity is typically
quantified for multiple voyages over a period of time (e.g. a year).

Carbon intensity can be measured in a number of different ways.8 To provide the most accurate
representation of a vessel’s climate impact, the carbon intensity of a vessel should be measured from
its performance in real operating conditions instead of using a design specification metric (e.g. Energy
Efficiency Design Index or EEDI). The EEDI is not a reliable estimate of the carbon intensity because it
assumes that the ship sails at its design speed (full speed), is fully loaded and operates in calm sea
conditions, all of which are unrealistic assumptions. The EEDI optimises its design for a single set of
criteria (e.g., speed, draught, weather and direction) when in reality a ship operates in different
combinations of these factors. In general terms, improving the EEDI for a class of ships should lead to
overall lower emission ships across different operating conditions but it does not necessarily lead to the
most efficient/effective design. The most efficient design will be that which understands and caters for
the full spectrum of the vessel’s intended operating profile.

A common claim is that ships with a better EEDI will have better carbon intensities. Studies have shown
that vessels with the same EEDI can have widely different carbon intensity values. A study conducted
by UMAS examined carbon intensity data of eleven “identical” tanker ships over 2010 to 2015. 9 The
ships were built according to the same design, built by the same shipyard, operated by the same ship
management company and had similar systems for measuring and obtaining data. The study therefore
represents an ideal “controlled experiment” for understanding how carbon intensity can vary due to the
environmental conditions (e.g. sea state and the climate in which the ship operates), the commercial
conditions (e.g. nature of cargo, the calorific value of fuel used) and the maintenance and technical
specifics of the different ships (hull coating, cleaning, hull and propeller fouling, engine wear). Whilst
the shipowner has control over the maintenance and technical specifics, the commercial conditions are
dictated by the charterer, neither agent have control over environmental factors such as weather and
wind which influence fuel consumption.

7
 CDP (2018) “CDP Technical Note: Measuring emissions intensity of transport movements”
8
 Smith, T. W. P., O'Keeffe, E., Aldous, L., & Agnolucci, P. (2013). Assessment of Shipping's Efficiency Using Satellite AIS data
provide a number of different ways for measuring carbon intensity.
9
 O’Keeffe & Smith (2016) “A Case Study of Fuel Monitoring and Efficiency Indicators for INTERTANKO”
Integrating climate risk into ship finance lending decisions
 8
Figure 3 shows the wide variation in carbon intensity values for these ships over a five-year time period.

 Figure 3: Range of carbon intensity values for “identical” tanker ships

In IMO nomenclature, the carbon intensity is known as the Energy Efficiency Operational Indicator
(EEOI), represented as grams of CO2 per tonne nautical mile (gCO2/tonne-nm). The carbon emissions
are normalised by the transport work performed, a function of cargo carried and the distance travelled
whilst loaded. This is the ideal measure because it takes into account the actual transport work
performed. An alternative carbon intensity metric, proposed to the IMO by the Japanese delegate is the
Annual Efficiency Ratio (AER). AER is reported in unit grams of CO 2 per dwt-nautical mile:

 ∑
 = (1)
 ∑

The numerator of Equation 1 is the total carbon emissions for each voyage i over a year, ∑ , while
the denominator is the design deadweight and the total distance travelled for each voyage i over a
year ∑ . The carbon emissions are a function of the fuel consumption of each fuel type, multiplied by
the carbon factor.

A new IMO regulation requiring shipowners with ships of 5000 GT and above to collect data that enables
a carbon intensity metric called the Annual Efficiency Ratio (AER) to be calculated. Although the AER
is an imperfect measure because it provides a proxy for the transport work carried, it allows banks to
benchmark the carbon intensity of vessels trading globally in their portfolio against a climate target in
line with the IMO’s initial GHG strategy.

This metric is calculated using an approximation of the total annual transport work performed by a ship,
obtained from its total distance travelled and deadweight instead of laden distance travelled and actual
cargo loaded.10 The Poseidon Principles are based on AER because data is readily available as all
owners are obliged to report annual to the IMO’s Data Collection System (DCS) (whereas EEOI cannot
be calculated from DCS data). The DCS is a regulation that came into force in March 2018 and requires
shipowners to collect vessel data including the amount of fuel consumption for each type of fuel, design
deadweight and distance travelled over one year. The first collection period is for the calendar year
2019.

10
 For ferry and cruise ships which carry passengers, gross tonnage can be used as a proxy for passengers.
Integrating climate risk into ship finance lending decisions
 9
In practice, ships are not always fully utilized in terms of capacity and many ships (e.g., tankers and
bulkers) operate with ballast voyages where for several voyages a year they have no cargo.11 Ships
are at the mercy of their cargo owner, which is incentivised to maximise profits for each trade. In certain
market conditions, a tanker could be sent to a port to unload, but during the journey the oil price changes
unfavourably, causing the ship to be sent to another location to fetch a higher price. The extra distance
travelled would lower the AER but not EEOI. Consequently, this method will underestimate the actual
carbon intensity on average.

Figure 4 illustrates the carbon intensity of a sample of Suezmax tankers in 2016 against a
decarbonisation trajectory. Carbon intensity is estimated using an emissions model which estimates the
AER using AIS derived speed and draught with technical characteristics of the ships from a fleet
register.12 Using carbon intensity as the metric to measure alignment over time, a decarbonisation
trajectory is a representation of how many grams of CO 2 a single ship can emit to move one tonne of
goods one nautical mile (gCO2/t-nm) over a time horizon and still meet the climate target. Based on the
decarbonisation trajectory values, a Suezmax which is aligned in 2016 will need to reduce by 12% by
2021, 24% by 2026 and 80% by 2050.

Figure 4: Estimated carbon intensity of Suezmax vessels against a decarbonisation trajectory

The data points which lie on or below the decarbonisation trajectory (shown in blue) are climate aligned
(shown in green), while the points above the trajectory are misaligned (shown in red). The climate
alignment of each vessel is the percentage difference between each vessel’s carbon intensity and the
climate target for the same point in time (2016). Mathematically, this alignment delta is:

 ( − )
 ∆ = 100 (2)

For this particular subset of vessels, the alignment ranges from -13.5% (aligned) to 52.3% (misaligned).
Converting into a percentage difference against the peer group enables multiple ship type/size
categories to be aggregated to a single metric. Portfolio alignment is simply calculated as:

11
 IMO (2015) MEPC 68/INF.24.
12
 Model is based on the Third IMO GHG Study and FUSE model at UMAS.
Integrating climate risk into ship finance lending decisions
 10
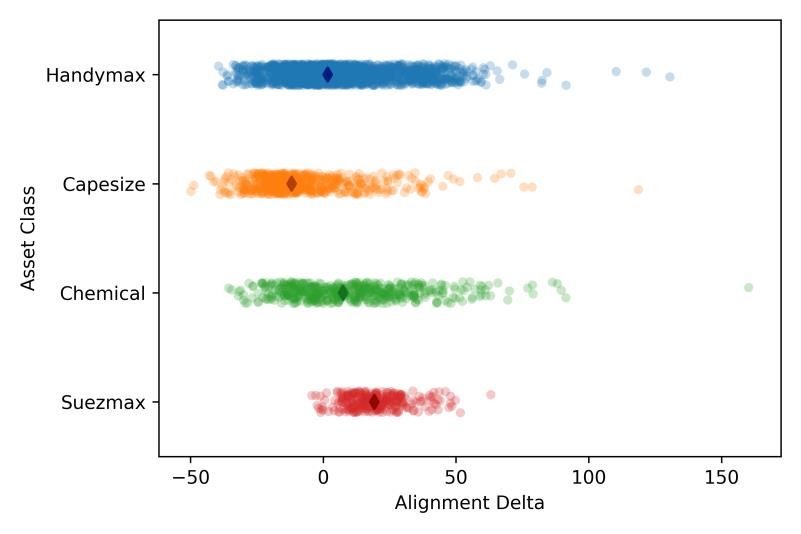
 ∆ = ∑ ∆ (3)

Where is the vessel debt outstanding as a share of total debt outstanding and ∆ is the vessel
alignment. For this simple example in which there are only Suezmax ships in the portfolio and assuming
the capital exposure is the same for each vessel, the portfolio score is 13%. Over time, vessels will
need to reduce their intensity to stay below the curve. After 2022, all of the aligned vessels will become
misaligned if they continue to operate with the same operational profile.

 Recommendation 1.
 Measure and disclose the climate alignment of a ship finance portfolio by benchmarking
 the carbon intensity of the vessels against the require climate target.

4 Understanding the drivers of portfolio alignment
The portfolio alignment score can be tipped to misalignment due to being overexposed to vessels with
high carbon intensity values. Analysis should provide insight into the sources of misalignment by ship
characteristics (e.g., type and size) and if necessary, by individual vessel level. Figure 5 illustrates the
spread of vessel alignment deltas that can be expected from a variety of vessel types and sizes using
estimated data from ship movements and fuel consumption modelling. Each diamond represents the
median alignment delta for each asset class.

Figure 5: Alignment range by asset class for fleet sample based on 2016 activity

Carbon intensity is sensitive to a number of parameters, some of which may not be stable over time.
Therefore, even if there is climate alignment, certain market conditions could cause it to become
misaligned over time.

Equation 1 showed that AER is simply carbon emissions divided by dwt-miles. Fuel consumption (and
hence emissions) is influenced by the type of fuel, the speed a ship travels, its engine efficiency and
retrofit technologies installed, the amount of cargo onboard and the condition of the hull (which affects
the drag). Clearly, a fuel with a zero-carbon factor has a carbon intensity of zero. But the majority of the
global fleet runs on HFO, the molasses of crude oil, such that understanding the different drivers of

Integrating climate risk into ship finance lending decisions
 11
carbon intensity is needed. Table 1 provides a summary of the constant (unchanging factors like
deadweight) and variable (e.g., operating speed) that influence a ship’s carbon intensity.

Table 1: Constant and variable drivers affecting AER

 Constant Variable
 Installed power Operating Speed
 Deadweight Port time
 Fuel carbon factor Cargo utilisation
 Specific fuel consumption characteristic Weather conditions
 Hull roughness

The variation in tonne-miles (for a ship) comes from miles travelled because design deadweight is
constant. Miles travelled is a function of the days the ship is at sea (rather than in port or laid-up) and
the speed it travels. Speed is given by nautical miles travelled per hour; distance travelled is simply the
sum of the speed over the time the ship spent at sea. Fuel consumption is normalised by total tonne-
miles (using deadweight as a proxy for cargo carried), but fuel consumption also includes fuel consumed
in port which increase total CO2 emissions. Ships which spend relatively less days in port and more
time sailing will have a better AER, controlling for other factors. The AER also does not normalise for
the cargo or passengers carried, which affects fuel consumption but is not represented in the
denominator (as most ships are not continuously full of cargos or passengers whilst sailing at sea).
Figure 6 presents a sensitivity analysis of alignment to operating speed and days at sea for Suezmax
vessels based on 2016 activity. The curves show the sensitivity of the alignment delta to operational
speed (left) and days at sea (right) controlling for other factors, while the blue area represents the
spread of historical values (up to 1 standard deviation). This simulation shows that the alignment delta
is highly sensitive to operational speed, given the nonlinearity between speed and fuel consumption,
showing the significant difference that even a knot in operating speed can make.

Figure 6: Sensitivity analysis of alignment delta to speed and days at sea

 Recommendation 2.
 Assess why a portfolio was misaligned or aligned with the climate target for the reporting
 period.

5 Translating climate alignment into risk
A vessel that is presently misaligned may not be misaligned in the future nor add significant overall risk
to a portfolio but does have a higher risk of future misalignment. Assessing whether the vessels in a

Integrating climate risk into ship finance lending decisions
 12
portfolio are at risk in the future requires thinking through how financial risk could manifest itself in
relation to a shipowner and hence a bank over the time period of the loan. There are two key questions
to ask:

 1. What are the earnings and residual value risk and how exposed is the bank to these risks?
 2. What are the most cost-effective solutions to reduce these risks and opportunities for green
 investments?

Aside from ensuring that the asset survives, there is a silver lining for early movers. Banks can capitalise
on new capital from new impact investors. Green and climate bonds is a nascent area within banking.
The Climate Bonds Initiative has created shipping criteria that ensure that certified bonds and loans are
consistent with the Paris Agreement.13 These climate bonds allow shipowners to pool funds from a
variety of investors to fund energy efficiency retrofits or ships designed to switch to a lower carbon fuel
in the future. In addition, investing in future marine fuels is an opportunity for investors to seize early
investment opportunities that have the potential to reap large rewards.

In the short-term, a ship’s operating pattern could be altered (e.g., speed and miles travelled) which
would allow it some breathing room to edge down the trajectory. Over the longer term in a future where
carbon is priced into fuel and biofuels were to become the dominant low carbon fuel, the ship could
switch to biofuel with no modifications to the engine. However, other alternative low carbon fuels like
ammonia and hydrogen will compete on price with biofuels which may make it uncompetitive with these
alternatives. A ship which does not have an ammonia or hydrogen ready engine would need to be
retrofitted, adding a capital cost that would need to be compensated by higher earnings. The younger
the age of the ship, the greater exposure to this uncertainty. But the older the ship, the greater the risk
that the ship is forced to retire early, greatly reducing its useful lifetime at a cost to the investor which
has to be written off.

In this paper we have focused on the risks that arise because of a ship’s technology/fuel specification.
However, in addition to the supply-side risks, there are demand-side risks related to anticipated
demand-destruction for fossil fuels created by broader decarbonisation policy. These risks are likely to
be more specific to certain ship types becoming oversupplied, rather than because of an individual
ship’s specifications. These risks can also be assessed with demand-scenarios for oil, coal and gas
representing a range of different rates of demand reduction to understand the potential exposure to this
risk for different ship types.

5.1 Incorporating climate risk into credit risk models
In shipping, the risk of changes in GHG regulation, technology and fuel prices have direct implications
for ship earnings and the residual value (second-hand value) of a ship. For example, a GHG regulation
that makes high carbon fuel more expensive will impact the operating cost of fossil fuel powered ships,
causing the supply to shift away from fossil-fuel ships to low carbon ships by pricing in carbon. Due to
the long life of shipping assets (20-30 years), a ship which is invested in now or later faces an
obsolescence risk mid-way or sooner into its lifetime once zero emissions ships start penetrating the
market due to earnings loss. This loss in earnings will directly impact the probability of a shipowner
defaulting on a loan, causing a loss to the bank. The loss depends on the residual value of the ship,
reflecting the ship’s earnings potential (future cash flow) for the remainder of the ship’s economic life.

Scenario analysis enables different future pathways to be mapped out and the tipping points where a
technology/fuel becomes dominant. This analysis combines the expertise of credit risk analysts with
shipping expertise of ship technology, regulation and shipping markets.

13 See https://www.climatebonds.net/low-carbon-shipping
Integrating climate risk into ship finance lending decisions
 13
Figure 8 illustrates how scenario analysis is performed to evaluate a shipping loan. Scenario inputs
include fuel and technology options, economic variables (freight rate, CAPEX and OPEX of alternative
technology options), and regulation (carbon price/fuel mandate and the timing of regulation). Figure 9
shows some examples of scenario inputs and regulation scenarios. These are illustrative to show that
different scenarios can be simulated using a distribution of fuel prices rather than single point estimates
to determine tipping points. Scenario-adjusted financials take into account the revenue, voyage costs
and capital expenditure under different scenarios. The borrower’s characteristics are also used as they
influence a company’s ability to stay solvent.

Under a scenario in which ZEVs are more profitable (due to lower GHG/carbon costs and higher
revenues paid to zero carbon service providers), the economic lifetime of a fossil-fuelled ship could be
shortened significantly, and the residual value (second-hand value) could drop more sharply than
currently anticipated. In particular this is a risk to the LNG propelled ships being considered today. 14

LNG propelled ships built today face competition during their lifetime from ZEVs (maybe in as few as
10 years). Under this competition, the LNG propelled ships may see residual values set by the wider
market (e.g. similar second-hand value to equivalent specification conventional fossil fuel ships), so
given the higher costs of these ships today, they are likely to see higher rates of depreciation than
conventionally-fuelled ships.

Figure 7: Scenario-based expected loss model

14
 Splash 24 (2019) “Volume uptake of gas as fuel awaits the conversion of LNG-ready tonnage”. Available at:
https://bit.ly/2AmrM5Y (Accessed: January 28th 2020).
Integrating climate risk into ship finance lending decisions
 14
Figure 8: Examples of scenario inputs

Associated with the competitiveness of LNG is which zero carbon fuels will be commercially viable (still
very uncertain). The different chemical composition of fuels means that not all fuels are compatible with
each other. For example, the LNG bunkering infrastructure and ship technology is most compatible with
synthetic gas or biogas. If synthetic gas or biogas are not competitively priced with other future
alternative fuels, the LNG ship would need to be retrofitted, but there is still uncertainty as to whether
fossil-fuelled ships could be converted to ZEVs at a cost that would be paid off over the remaining life
of the ship. Investment planning should therefore account for this likelihood of future ZEV competition,
under which fossil-fuelled ships may have a much shorter economic lifetime and consider all the risks
and opportunities under such scenarios.

 Recommendation 3.
 Assess the financial risks of misaligned vessels in a portfolio and the opportunities to align
 vessels to the climate target by incorporating climate scenarios into credit risk modelling.

6 Solutions available for aligning portfolios
Once a portfolio has been assessed for misalignment and financial risks and opportunities, solutions
can be sought to manage the risk of misalignment and opportunities sought to improve the carbon
intensity of vessels in future reporting periods. Mitigation solutions should be targeted at vessels which
have a high carbon intensity, exposure and longer remaining financing period as the portfolio is most
sensitive to changes in these values and the solution will payback over a longer period of time. Figure
9 illustrates the relationship between the weighted AER values (where each AER value is multiplied by
the share of the debt outstanding in the portfolio) and the loan period for a hypothetical portfolio that
has loan periods ranging from 0 to 12 years. Vessels which have a loan period greater than 0 should
be considered, although the vessels with higher loan periods have a greater chance of payback as they
will exist in the portfolio for longer.

Integrating climate risk into ship finance lending decisions
 15
Figure 9: Weighted AER value compared to loan period

Solutions for targeted vessels should be tailored based on the age of the vessel. In the short-term,
owners should look at improvements in energy efficiency, which reduce the amount of fuel required to
travel one nautical mile. Holding speed, cargo and hull condition constant, a ship which is more energy
efficient will have a better fuel consumption. Speed is an efficient lever to pull to decrease fuel
consumption. This is because there is a non-linear relationship between fuel consumption and speed.
The speed range therefore has a non-linear effect on fuel consumption. If a ship reduces its speed by,
for example, 20%, its emissions will come down by up to 34%.15 In the oversupplied market between
2010-2012, ships were slow steaming and thus lowering their fuel consumption and intensity. In a tight
market, ships will readjust their speed according to the profitability of taking on extra voyages at the
expense of higher voyage costs.

Beyond speed and utilisation, the energy efficiency could be improved on the ship. This includes
equipment which can improve the hull’s efficiency, the propulsion efficiency, or the efficiency of the
machinery used to convert fuel into propulsive or auxiliary power (e.g. main engine).

A study of the potential carbon intensity reduction solutions for a medium range tanker showed that
speed reductions and energy efficiency technology in combination with wind propulsion could reduce
carbon intensity by between 30% and 70% relative to its baseline design and operational specification
at an operational speed of 12.8 knots. 16 Table 2 shows reductions between 30% and 70% in yellow and
reductions greater than 70% in green. Achieving the higher reductions using speed reduction and
energy efficiency technologies alone requires a large reduction in operating speed which could be
undesirable for commercial and operational reasons.

Table 2: Carbon intensity indexed to the baseline (2010) specification

 Operating speed (knots) 8.9 9.7 11.3 11.7 11.9 12 12.8 14.3 15
 Baseline -41 -34 -20 -15 -13 -11 0 31 53
 Max. technology but no wind
 -44 -39 -27 -23 -21 -20 -11 10 26
 assistance/block
 Max. technology and wind
 -62 -58 -50 -47 -45 -45 -39 -25 -15
 assistance/block
 Max. technology, wind assistance/block
 -81 -79 -75 -73 -73 -72 -69 -62 -57
 and 50% carbon factor reduction
 Max. technology, wind assistance
 -91 -90 -87 -87 -86 -86 -85 -81 -79
 /block and 75% carbon factor reduction

15
 CE Delft, UMAS (2019) “Study on methods and considerations for the determination of greenhouse gas emission reduction
targets for international shipping. Final Report: Short-term Measures”. Prepared for the European Commission.
16
 Smith et al. (2016) “CO2 emissions from international shipping. Possible reduction targets and their associated pathways”.
Prepared by UMAS.
Integrating climate risk into ship finance lending decisions
 16
Solutions for the longer term should focus on compatibility with future fuels. A study by Lloyd’s Register
and UMAS on zero emissions vessels included three key primary energy sources that would allow zero-
carbon fuels to enter the shipping fuel market: renewable electricity, bio-energy and fossil fuels with
carbon capture and storage (CCS). 17 Renewable electricity-based marine fuels include methanol,
synthetic gas, hydrogen, ammonia and power batteries. It is still uncertain which primary energy source
will dominate. Batteries and hydrogen are already penetrating the market in short sea shipping, but
deep-sea shipping is still dependent on fossil fuel. However, the engine technology manufacturer MAN
estimate they will have a dual-fuel 2-stroke LPG and ammonia compatible engine on the market in 2
years, with ~3000 current in-service engines that could be low-cost ammonia retrofits. MAN views this
as “future-proofing” engines for future alternative fuels while the infrastructure and class approval of
ammonia is still being developed.18

 Recommendation 4.
 Determine what solutions are available to align vessels to climate targets over their
 financing period and opportunities for new green financings.

 .

17
 LR and UMAS (2018) “Zero-Emission Vessels: Transition Pathways”.
18
 Laursen (2018) “Ship Operation Using LPG and Ammonia as Fuel on MAN B&W Dual Fuel ME-LGIP Engines”. Presentation
given at 2018 AIChE Annual Meeting, Pittsburgh, PA.
Integrating climate risk into ship finance lending decisions
 17
You can also read