Dallas Fort Worth International Airport - JP Morgan Transportation and Utility Forum October 22-23, 2020
←
→
Page content transcription
If your browser does not render page correctly, please read the page content below
Dallas Fort Worth International Airport
JP Morgan Transportation and Utility Forum
October 22-23, 2020
Chris Poinsatte
Executive Vice President and Chief Financial Officer
Investor Disclaimer
    The Investor Presentation you are about to view is provided as of October 22, 2020. If you are viewing this
    presentation after that date, events may have occurred that have a material adverse effect on the financial
    information presented. The information presented is not warranted as to completeness or accuracy and is
    subject to change without notice. You agree not to duplicate, copy download, screen capture, electronically
    store, or record this presentation, nor to produce, publish or distribute this presentation in any form
    whatsoever.
    This Investor Presentation is provided for your information and convenience only. This Investor Presentation
    does not constitute a recommendation or an offer or solicitation for the purchase or sale of any security or
    other financial instrument or to adopt any investment strategy. Any offer or solicitation with respect to the
    Bonds will be made by means of a Preliminary Official Statement or Official Statement that will describe the
    actual terms of the Bonds. In no event shall the Issuers be liable for any use by any party of, any decision
    made or action taken by any party in reliance on, any inaccuracies or errors in, or any omissions from, the
    information contained herein and such information may not be relied upon by you in evaluating the merits of
    participating in any transaction mentioned herein. These materials may not be reproduced, disseminated,
    quoted or referred to, in whole or in part. These materials may not reflect information known to other
    professionals in other business areas of the Underwriters and their affiliates.

2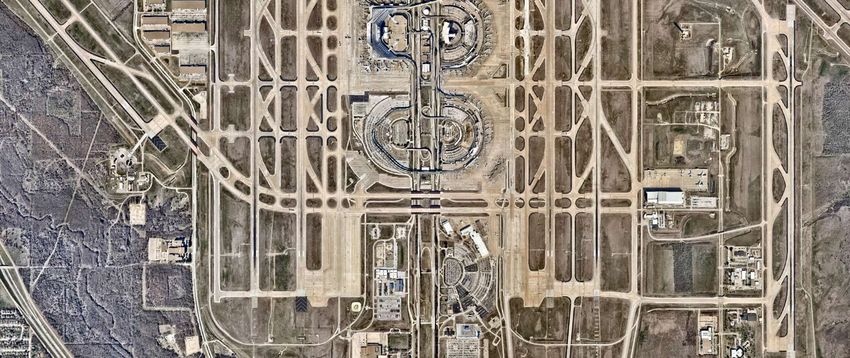
Note on Forward-Looking Statements
    Certain statements included or incorporated by reference in this Investor Presentation referenced herein may constitute
    “forward–looking statements” within the meaning of the United States Private Securities Litigation Reform Act of 1995,
    Section 21E of the United States Securities Exchange Act of 1934, as amended, and Section 27A of the United States
    Securities Act of 1933, as amended. Such statements are generally identifiable by the terminology used, such as “plan,”
    “project,” “forecast,” “expect,” “estimate,” “budget” or other similar words.
    The achievement of certain results or other expectations that may be contained in such forward–looking statements
    involve known and unknown risks, uncertainties and other factors which may cause actual results, performance or
    achievements described to be materially different from any future results, performance or achievements expressed or
    implied by such forward–looking statements. In addition, not all relevant events or conditions may have been considered
    preparing the forward-looking information and in developing any assumptions on which such forward looking information
    may be based. Accordingly, actual results will vary and the variations may be material.
    Prospective investors should understand the limitations inherent in forward–looking data and evaluate whether such data
    and any underlying assumptions are appropriate for their purposes. These materials may also contain historical market
    data; however, historical market trends are not reliable indicators of future market behavior. The Issuers may not issue
    any updates or revisions to those forward–looking statements if or when its expectations change, or events, conditions or
    circumstances on which such statements are based, occur.
    Neither the Issuers or their affiliates provide tax advice. Any statements contained herein as to tax matters were neither
    written nor intended to be used and cannot be used by any taxpayer for the purpose of avoiding tax penalties that may be
    imposed on such taxpayer.

3
Presentation Overview
    Airport Overview

    Air Service Update

    DFW Financial Update

    Capital Projects

    Debt Update

4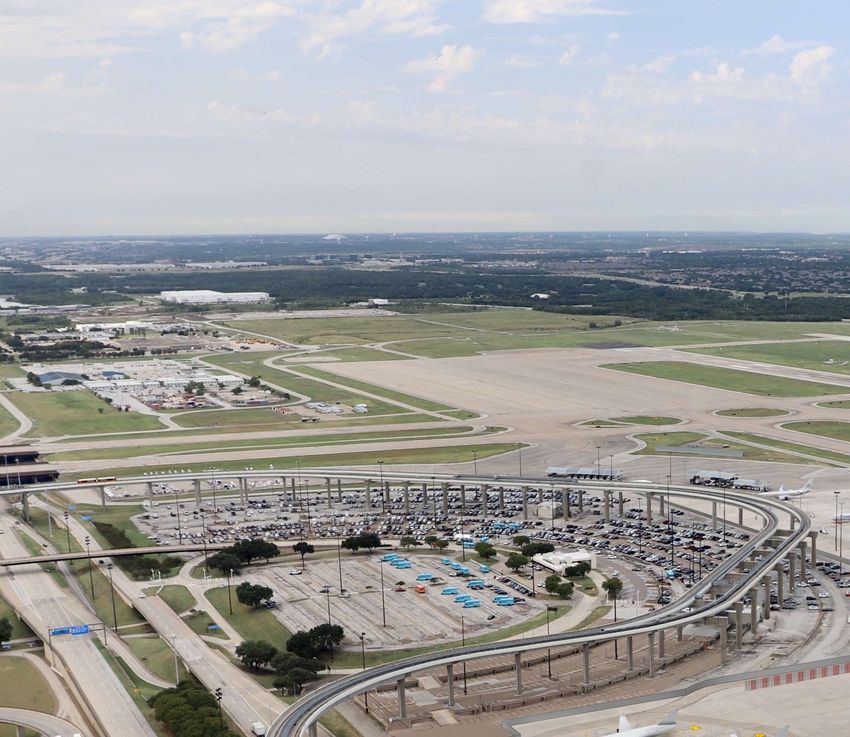
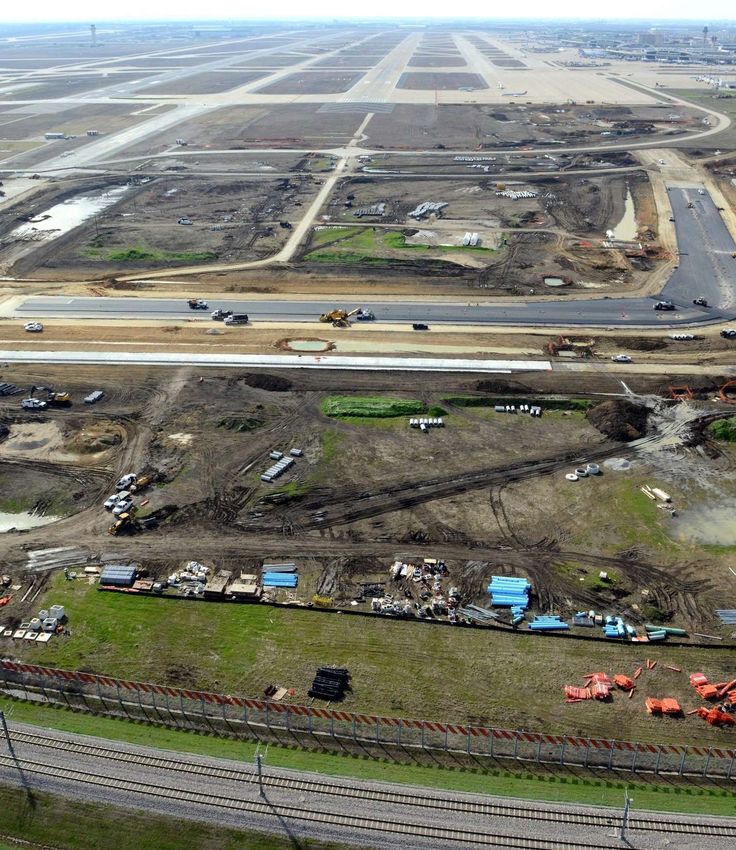
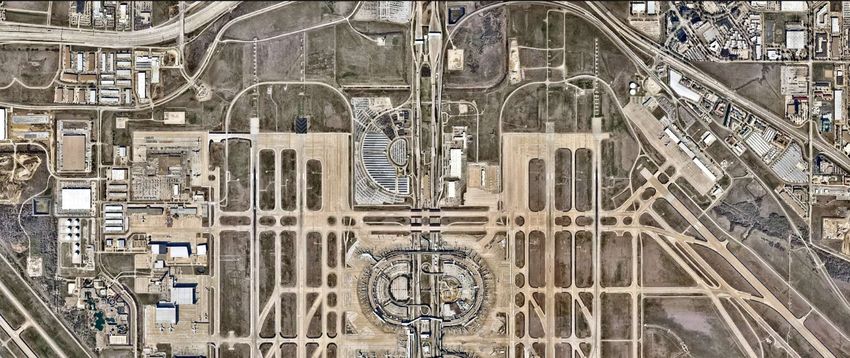
DFW is a Global
                 Super Hub

                                         164 gates
                                         in 5 terminals
                                         on 17,000+ Acres
                       Capable of 4
                       Simultaneous           7 Runways
                       Landings

                  3rd Busiest*        10th Busiest*
                   2019 Daily              2019
5   * In world
                  Departures           Passengers
Customer Experience & Digital Transformation
Industry Customer Service Award winner in 2016, 2018 and 2019.

DFW is the largest carbon neutral airport in world
          and has a net zero target by 2030.
                                   180,000
                                                                                          DFW Emissions
                                   160,000

                                   140,000
    CO2e Emissions (metric tons)

                                   120,000                                                                        IPCC* Milestone = 45%
                                                                                                                    Reduction by 2030
                                   100,000

                                    80,000

                                    60,000                                         DFW Net Zero                                      IPCC Net Zero
                                                                                      Target                                            Target
                                    40,000

                                    20,000        79% Reduction

                                          0

7
                                   * SOURCE: Intergovernmental Panel of Climate Change (IPCC) Special Report: Global Warming of 1.5oC Recommendation to Policymakers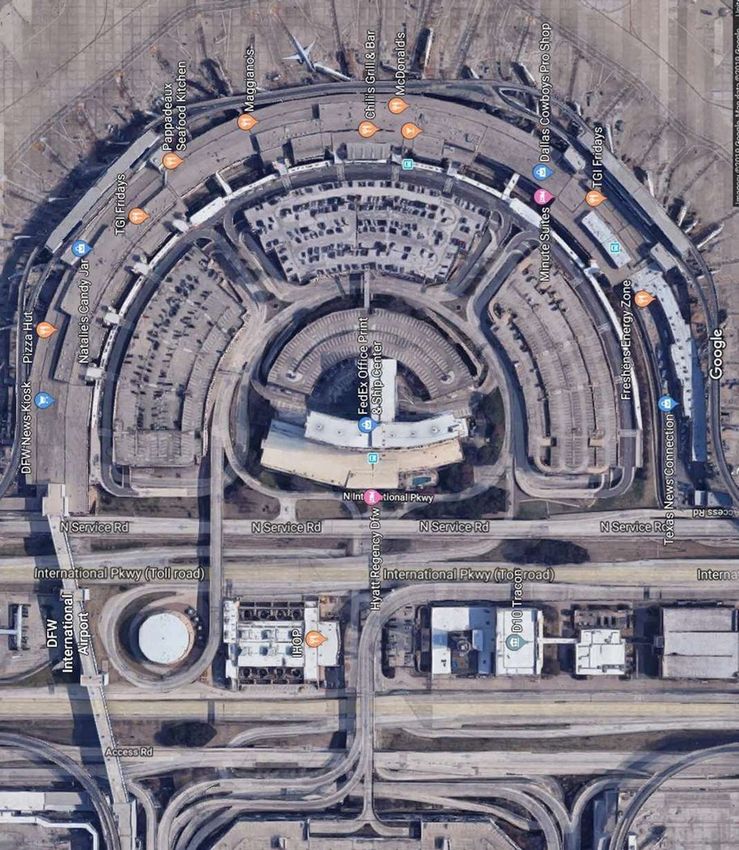
DFW region is faring better than US in COVID recovery.

                                       Source of charts - Dallas Morning News 10.04.20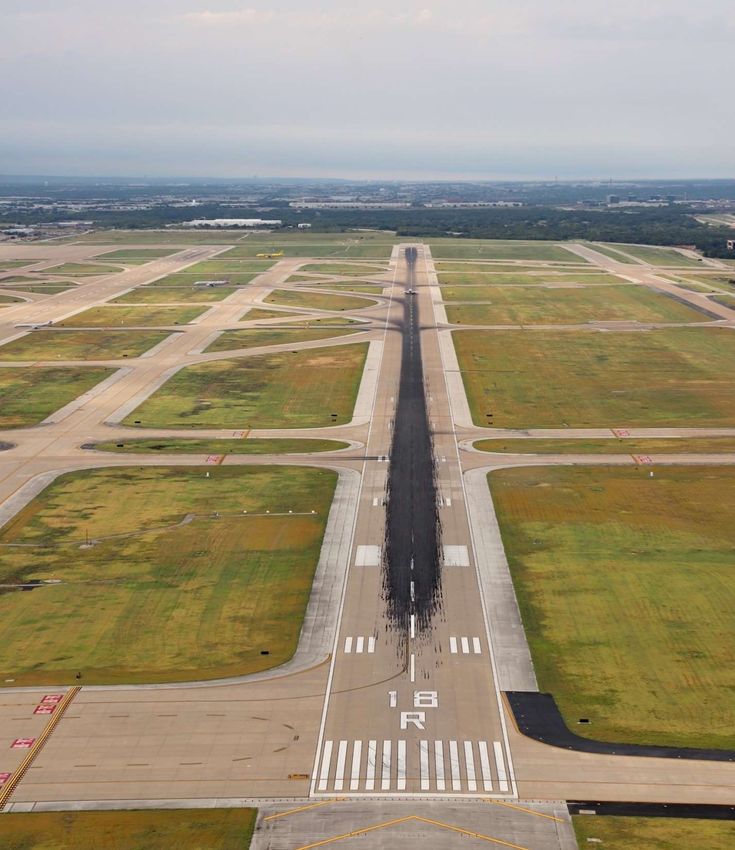
Air Service Update

9

Traffic has continued to increase steadily since
                                  bottoming out in April
                                                                               Passenger Trends
                6                                                                                                                                                   20%
                       5.6
     Millions

                               8.2%
                5                                                                                                                                                   0%

                4                                                                                                                                                   (20%)
Passengers

                                                                                                                                                                             YOY % Change
                                           3.3                                                                     3.2                 3.3              3.4
                3                                                                                                                                                   (40%)
                                                  (45.5%)                                                                                                     (44.8%)
                                                                                                   2.2                      (54.8%)
                                                                                                                                             (52.5%)
                2                                                                                                                                                   (60%)
                                                                                1.4                      (67.6%)

                1
                                                                                        (79.4%)                                                                     (80%)
                                                             0.5
                                                                     (91.9%)
                0                                                                                                                                                   (100%)
                      Feb-20             Mar-20             Apr-20             May-20             Jun-20           Jul-20             Aug-20           Sep-20
                                                                                 Passengers   YOY % change

                10     Source: Internal Statistics
Passenger and Cargo Airline Operations
Passenger airline operations recovery flattened after July 4th
weekend, down approximately 33% to 2019.
Passenger and Cargo Operations
30%
20%
July 4th Weekend shift
Labor Day Weekend shift
10%
0%
7 day avg. Ops YoY
(10%)
(20%)
(30%)
(40%)
(50%)
(60%)
(70%)
(80%)
7 day avg. YoY Passenger Ops 7 day avg. YoY Cargo Ops
11 Source: Internal StatisticsDFW's domestic route network is largely intact.
93% of DFW’s domestic network is operational today.
Flying in October 2020: 178 Resuming on/before June 2021: 8 Suspended: 6
12 Source: airline schedules per Diio.mi Schedules as of Sept 30, 2020. Caveat, airlines are frequently adjusting service.The majority of DFW's international network is operating
with more currently scheduled to fly by 12/31/20.*
Flying in October 2020: 36 Resuming on/before June 2021: 24 Suspended: 8
Source: Airline schedules per Diio.mi Schedules as of September 30, 2020 and Airline intel.
13 * Caveat, airlines are frequently adjusting service; see detailed list in appendix.DFW has retained more service than any other
American Airlines' hub.
YoY departure and destination change for major U.S. airports
0%
(10%)
(20%)
YOY % change
(30%)
(40%)
(50%)
(60%)
(70%)
(80%)
YOY Departures YOY Destinations
SLC DFW DEN SEA CLT PHX ATL MSP DTW LAS MCO IAD IAH ORD LAX MIA SFO EWR PHL JFK BOS DCA
Oct. 2020
#Destinations 82 214 175 98 147 91 154 98 96 108 80 108 136 192 126 119 88 99 87 126 96 49
Oct. 2020
Departures 8,262 21,057 18,718 12,169 15,502 10,106 22,126 9,291 9,437 9,273 7,075 5,217 9,269 17,896 11,271 5,231 7,377 7,151 5,699 6,399 6,169 3,088
14 Source: mi.diio.net, schedule data Oct 2020 vs. Oct 2019DFW is currently the 2nd busiest airport in the
world based on published schedules.*
45,000 Oct 2019 Scheduled Departures (Top 25) 25,000 Oct 2020 Scheduled Departures (Top 25)
40,000
20,000
35,000
30,000
Departures
Departures
15,000
25,000
20,000
10,000
15,000
10,000
5,000
5,000
0 0
= DFW = U.S. Airports = Int’l Airports = DFW = U.S. Airports = Int’l Airports
* DFW was busiest airport in the world in July; 2nd in April, June, August, and October; and 3rd in September
15 Source: Diio.mi Schedules Oct 2020 vs. Oct 2019 (schedule as of Oct 1, 2020);Forecasts assumed DFW demand fully recovers to 2019
levels 6-8 months after potential vaccine is deployed.
120% Pax as % of FY19
2019 levels
100%
Vaccine
80%
60% Vaccine
40%
For September, DFW was near the middle
of its Base and Optimistic forecasts.
20%
0%
BASE OPTIMISTIC
Note: Based on capacity updated to include AA’s most recent guidance, along with DFW estimates DFW is not predicting if or when an effective vaccine will be developed.
16Passengers comparison to post-COVID forecasts
DFW is running 15.8% above its Baseline Forecast and 5.1% below its Optimistic Forecast as
of 09/30/20. The Baseline was used for the FY20 Outlook and the FY 21 Budget.
Actual vs. Baseline Actual vs. Optimistic
FY20 FY20 Month Cumulativ Month Cumulativ
Month FY19 Actual Baseline Optimistic FY20 Actual Variance % e Variance % Variance % e Variance %
Oct 5,741,938 6,377,552 6,377,552 6,377,552 - - - - - -
Nov 5,609,222 6,001,075 6,001,075 6,001,075 - - - - -
Dec 5,620,106 6,394,228 6,394,228 6,394,228 - - - - -
Jan 5,492,062 5,783,847 5,783,847 5,783,847 - - - - -
Feb 5,137,190 5,557,975 5,557,975 5,557,975 - - - - -
Mar 6,104,021 3,327,669 3,327,669 3,327,669 - - - - -
Apr* 5,992,073 483,713 483,713 483,713 - - - - -
May* 6,556,592 1,272,682 1,291,682 1,353,656 80,974 6.4% 80,974 6.4% 61,974 4.8% 61,974 4.8%
Jun 6,839,573 1,916,108 2,120,483 2,213,443 297,335 15.5% 378,309 11.9% 92,960 4.4% 154,933 4.5%
Jul 7,152,230 2,488,726 2,902,841 3,235,548 746,822 30.0% 1,125,131 19.8% 332,707 11.5% 487,641 7.7%
Aug 6,873,067 2,887,645 3,883,541 3,266,754 379,109 13.1% 1,504,240 17.6% (616,787) -15.9% (129,146) -1.3%
Sep 6,147,293 3,064,235 3,988,846 3,392,680 328,445 10.7% 1,832,685 15.8% (596,166) -14.9% (725,312) -5.1%
73,265,367 45,555,455 48,113,452 47,388,140 1,832,685 n/a 1,832,685 n/a (725,312) n/a (725,312) n/a
* Note that Forecasts were completed in May 2020 after April results
17Financial Update 18
Financial Highlights
     To date, DFW’s metrics and financial performance
     for FY20 and FY21 are marginally better than the
     projections included in the Official Statement
     • Used $26 million less of CARES Act funds
       projected to be needed for FY20
     • FY20 Bond refundings were more successful
       than expected allowing for significant reductions
       in debt service between FY20 and FY22
     • Achieved flat airline rates and charges in FY20
       and FY21 Budget compared to FY20 Budget
     • Lowered the FY20 Airline True-Up Adjustment of $31 million (from reduced terminal rental rates for
       Q4) to an FY20 Outlook of approximately $20 million
     Of $68 million of April/May 2020 rent deferrals, $253,000 (0.4%) remains uncollected ($190,000 relates
     to RAC bankruptcies)
     DFW’s unrestricted cash position remains strong at $916 million as of 8/31/20 (9/30 available soon)

19   Use Agreement negotiations on hold until November 2020
Percent Change in Key Metrics (FY19 vs FY20)
October passengers through first 18 days are about 40% less than same period in 2019.
Percent Increase (Decrease) FY 2019 to FY 2020
Selected Information Oct to Feb March April May Jun Jul Aug Sep *
Total Passengers 9% (45%) (92%) (79%) (68%) (55%) (52%) (45%)
Total O&D Passengers 4% (42%) (92%) (87%) (77%) (68%) (65%) (58%)
Total Operations 8% (11%) (57%) (56%) (51%) (33%) (32%) (33%)
Total Landed Weights 8% (13%) (61%) (59%) (54%) (36%) (35%) (34%)
Landing Fees (10%) (25%) (56%) (57%) (47%) (33%) (33%) (30%)
Terminal Rents*** 7% 7% 7% 1% 0% 0% 1% 0%
Other Terminal Revenues** (1%) (31%) (71%) (69%) (66%) (61%) (57%) (57%)
DFWCC Revenues
Parking and Ground Transportation 3% (40%) (96%) (90%) (82%) (72%) (67%) (55%)
Concessions 5% (45%) (74%) (71%) (71%) (51%) (55%) (54%)
Rental Car** 7% (59%) (67%) (58%) (61%) (45%) (43%) (38%)
Commercial Development 10% 11% 9% 10% 6% 7% 10% 14%
Other 10% 3% (0%) (14%) (4%) (24%) (24%) (18%)
Total DFWCC Revenues 6% (32%) (65%) (64%) (60%) (50%) (49%) (42%)
* September 2020 numbers are outlook (except TUR info) versus last year's actuals. O&D info. is not yet available.
** Results corrected removing bad debt adjustments to more closely reflect activity.
. lowered terminal rentals by $10M per month in July, Aug, and Sep.
*** DFW
20Financial Summary – FY20 Projection** vs Y/E Estimates*
FY 20 Comparisons
Projection in Final
Official Y/E Increase
In millions, except ratios Statement Outlook* (Decrease)
Revenues
Airfield $ 168 $ 167 $ (2)
Terminal 389 374 (15)
DFW Cost Center 203 210 8
PFCs & Other 105 120 16
CARES 170 144 (26)
Total Revenue $ 1,035 $ 1,015 $ (20)
Expenditures
Operating Expenses $ 481 $ 462 $ (19)
Debt Service 473 472 (1)
Total Expenditures $ 954 $ 934 $ (20)
Airline Cost $ 450 $ 442 $ (9)
Cost per Enplanement $ 19.39 $ 17.28 $ (2.11)
DFWCC Net Revenues $ 164 $ 164 $ -
Transfer to DFW Capital $ 94 $ 94 $ -
Coverage Ratio 1.0x 1.17 1.17 -
Coverage Ratio 1.25x 1.45 1.45 -
*Outlook as of October 1, 2020
21
** Projections included in POS dated June 26, 2020, and 2020A, B and C investor presentations.Financial Summary – FY21 Projected* vs. FY21 Budget
FY 21 Comparisons
Projection in
Official Approved Increase
In millions, except ratios Statement Budget (Decrease)
Revenues
Airfield $ 177 $ 174 $ (3)
Terminal 395 395 -
DFW Cost Center 228 222 (6)
PFCS & Other 125 138 13
CARES 129 128 (1)
Total Revenue $ 1,054 $ 1,057 $ 3
Expenditures
Operating Expenses $ 508 $ 495 $ (13)
Debt Service 473 468 (5)
Total Expenditures $ 981 $ 963 $ (18)
Airline Cost $ 458 $ 469 $ 11
Cost per Enplanement $ 17.24 $ 17.28 $ 0.04
DFWCC Net Revenues $ 164 $ 164 $ -
Transfer to DFW Capital $ 94 $ 94 $ -
Coverage Ratio 1.0x 1.16 1.20 0.04
Coverage Ratio 1.25x 1.43 1.48 0.05
22 * Projection as included in June 26, 2020 Preliminary Official Statement and Investor Presentation for 2020A, B and C Bonds.Projected Unrestricted Cash Balances
Unrestricted cash was $916 million at 8/31/2020; in addition, DFW did not draw
down a planned $26 million of CARES funds because it was not needed.
Unrestricted cash
at 8/31/2020
$916 million, which
is 675 days cash
on hand based on
FY21 budget.
* Chart was included in Investor Presentation for 2020A, B and C Bonds.
23 .Capital Project Update 24
Capital Project Summary
     Terminal F is on hold.
     Terminal C Renovation will be 35% designed in
     November 2020
     DFW/Airlines to discuss next steps on these two
     projects once 35% design complete
     DFW deferred $100M of projects for COVID;
     most of which are still on hold
     10 Year ($2.5 billion) Infrastructure Capital
     Program has been respread over 15 years,
     lowering projected annual spend starting in FY23
     Total amount to be borrowed will be dependent
     on Use Agreement negotiations
     Forecasts do not include funding for Terminal C
     Renovation or new Terminal F
25
Major Project Summary
Project Budget Substantial Completion
High C Gate Replacement $225M to $250M Summer 2022
Terminal D South Extension (4 gates) $207M March 2021
Baggage System Replacement (5 terminals) $183M 3-5 years
Runway 18R-36L Rehabilitation $150M March 2021
Northeast End Around Taxiway $131M December 2021
Taxiway M South Rehabilitation $50M November 2020
High C Gates Terminal D South Baggage System 18R36L NE End Around Taxiway M
26Projected Capital Spend of Approved Program
Capital spend is likely to be slower than shown. DFW projects issuing approximately
$350M - $400M in CP and/or bonds each in FY21 and FY22 for financing. DFW
projects FAA grants of approximately $97M through FY22.
* Projected capital spend excludes suspended projects and funding for Terminal F and
post 35% design and construction of a Terminal C Renovation
.
27Debt Update 28
Conservative Fiscal Management
     Conservative practices provide significant financing flexibility in the future.

       Fixed-Rate                No Swaps               No Surety               Funded
         Bonds                                           Policies            Pension Plans
      Historically fixed rate   No swaps or other      Fully cash-funded     Employee Pension Plan
                                derivative exposure   debt service reserve      closed in 2010;
      CP added for interim                                    fund             DPS Plan Active
           financing
                                                                                  84.5% Funded
        $2.1B in bonds                                                         7.25% Discount Rate
       callable over next                                                    Fixed amortization period
           three years
       providing flexibility                                                 OPEB overfunded as of
                                                                                   01/01/20
29
2020 Bond Results
Incredible investor response to DFW’s three bond issues
During a 16-day period, DFW sold over $2 billion
of bonds in three separate transactions – two tax-
exempt and one taxable
• 183 unique investors
• 859 orders totaling $15.6 billion
• Over-subscribed 8.2x, 5.1x, and 8.3x
• Gross savings of $613 million
• NPV savings of $471 million
30DFW Airport Current Debt Profile
DFW’s debt profile provides flexibility for future principal placement.
Annual Debt Service
$500M
$450M
$400M
$350M
$300M
Debt Service Paid by Airline Rates Fees and Charges and PFIC
$250M
$200M
$150M
$100M
Debt Service Paid by Passenger Facility Charges
$50M CARES
Act
-
31 Source – DFW Treasury Department records, October 13, 2020Callable Bonds
DFW has approximately $2.1 billion of callable bonds to
refund for savings over the next three years.
$1.0B
$0.9B
$0.8B
$0.7B
Tax-Exempt
$0.6B $0.4B
Callable Par
$0.5B Tax-Exempt
$0.5B
$0.4B
$0.3B Tax-Exempt
Taxable $0.6B
$0.2B $0.5B
Taxable
$0.1B $0.3B
$0.0B
2021 2022 2023
Year of Planned Refunding
32 Source – DFW Treasury department records2021 Plan of Finance
DFW anticipates one taxable and up to two tax-exempt deals in
the summer of 2021
• Bond issuances may include refunding of existing bonds,
refunding of commercial paper (CP) and/or new money
• Taxable deal estimated between $600 million and $700 million
• Tax-exempt deals estimated to total between $450 million and
$550 million
CP program
• $750 million authorization; self liquidity currently provides about
$650 million of capacity; none currently outstanding
• Approximately $200 million of bond proceeds are available for
FY21 capital expenditures as of 10/1/2020
• DFW currently estimates new CP issuances totaling
approximately $350 million to $400 million in FY21
33Recent Investor Page Additions
DFW is reviewing and updating its Investor Web Page to make it more
helpful to investors. If you have thoughts, please let us know.
New disclosures recently added:
• Monthly liquidity reports
• Passenger levels compared to the
baseline and optimistic passenger
forecasts
Coming soon:
• Major capital projects summary for
approved projects over $50M that are in
progress
34Wrap Up
DFW has emerged from COVID 19 stronger relative to other
airports
• DFW was the busiest airport in the world in July 2020 and
largest in the US from May through July 2020
• Passengers through Sep 2020 are running better than DFW’s
conservative baseline projection used for its FY21 budget
DFW’s FY20 financial results and FY21 budget are marginally
better than projections included in the 06/26/20 Official Statement
and 2020 Investor Presentations
Congress approved CARES because Airports and Airlines provide
“Essential Services”
• DFW did not draw $26 million of planned CARES funds for
FY20, leaving a cushion for FY21 and beyond
• DFW has $155 million available for future
DFW had $916 million of unrestricted cash and investments at
8/31/20 and anticipate similar balances through FY21
DFW has numerous liquidity options, if necessary, beyond FY21
35Thank You 36
Appendix

37
Scheduled Service Dates for International Service
                                Destinations Scheduled to Return by 2Q 2021

        Montreal-PET, QC, CA           Nov 1, 2020          Buenos Aires, BA, AR   Dec 1, 2020    Not Yet Scheduled to Return
          Vancouver, BC, CA            Nov 1, 2020              Shanghai, CN       Dec 1, 2020
                                                                                                         Auckland, NZ
           Toronto, ON, CA             Nov 1, 2020             Hong Kong, HK       Dec 17, 2020
                                                                                                        Guayaquil, EC
             Mazatlán, MX              Nov 4, 2020                    Lima, PE     Dec 17, 2020
                                                                                                         Munich, DE
          Providenciales, TC          Nov 19, 2020                   La Paz, MX    Dec 19, 2020      San Pedro Sula, HN
          Grand Cayman, KY            Nov 21, 2020                   Loreto, MX    Dec 19, 2020        Tegucigalpa, HN

             Huatulco, MX             Nov 21, 2020                   Beijing, CN   Mar 27, 2021        Tel Aviv-Yafo, IL
                                                                                                          Quito, EC
              Nassau, BS              Nov 21, 2020               Santiago, CL      Mar 27, 2021
                                                                                                       Sydney, NS, AU
           Punta Cana, DO             Nov 21, 2020                   Dubai, AE     Mar 28, 2021

              Roatan, HN              Nov 21, 2020            Rome-Da Vinci, IT    Mar 28, 2021

       Ixtapa/Zihuatanejo, MX         Nov 21, 2020               St. Kitts, KN     May 22, 2021

            Belize City, BZ            Dec 1, 2020           Santo Domingo, DO     Jun 5, 2021

38   Source: Diio.mi Schedules through June 2021 and Airline Intel
FY21 baseline passenger forecast was estimated at
53.1M, with a more optimistic estimate of 63.6M.
Passengers (millions)
90.0
79.2
80.0 76.6 76.7 75.8
73.3
71.1
70.0
63.6
60.0
53.1
50.0 48.1
45.6
40.0
30.0
20.0
10.0
0.0
Note: DFW internal projections. OL = Outlook
3910-15 Year Infrastructure Capital Program (ICP)*
Estimated to be approximately $2.5B.* Spend varies by fiscal year between $200M -
$300M depending on assessed needs. DFW will fund the ICP with cash, grants and debt.
The amounts will be estimated when the Use Agreement negotiations are complete.
Airside 45% Landside 30% Facilities 25%
* The ICP is in addition to the Approved Capital Program shown on slide 27. DFW does not estimate
40 significant spend to begin on the $2.5 billion ICP until FY23.You can also read