Results for the six months to 30 September 2020 - 12 November 2020 - 3i Group
←
→
Page content transcription
If your browser does not render page correctly, please read the page content below

Results for the six months
to 30 September 2020
12 November 2020
Business review

Simon Borrows
Chief Executive

                  2
Resilient performance despite severe disruption from Covid-19
Six months to 30 September 2020

Group                                              Private Equity        Infrastructure
 Total return    Operating cash   First dividend   Gross investment       Gross investment
 on equity       profit           per share        return                 return

 15%             £14m             17.5p            19%                    12%
 NAV per share   Liquidity        Gearing          Proprietary capital    Cash income
                                                   invested

 905p            £1.1bn           3%               £231m                  £33m

                                                                                             3
Private Equity
Strong post-lockdown recovery and focused investment activity

 Good performance across the portfolio

 • 19% gross investment return
 • 85% of top 20 assets by value grew earnings in the period

 Disciplined investment approach, focus on buy-and-build

 • £64m new investment in GartenHaus, a platform business
 • £115m invested in transformational bolt-ons for Evernex and SaniSure

 Measured approach to realisations

 • Kinolt sold for proceeds of £81m
 • Strong balance sheet and no pressure to realise investments

                                                                          4
Private Equity
Good performance and resilience to Covid-19 across the portfolio

     Strong performance          Good recovery since the     Continued challenges
    throughout pandemic            lifting of lockdowns     (less than 5% of portfolio value)

                Tato

                     Themes and trends                         Themes and trends
• Value-for-money / recession   • Remote working           • Longer-term vulnerability
                                • Stay-at-home lifestyle     to the pandemic
• Shift to e-commerce
                                                           • Cyclical headwinds
• Focus on hygiene

                                                                                                5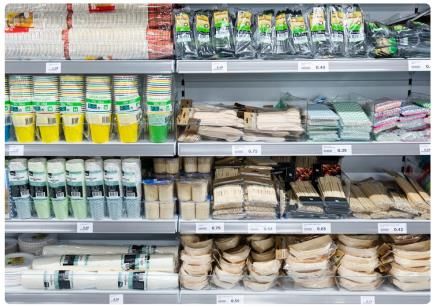
Private Equity
Portfolio earnings growth of top 20 PE investments1

           >40%         £584m                                                                                           3 companies

       20 - 40%            £785m                                                                                        3 companies

       10 - 19%                                                                £4,818m

          0 - 9%                £401m
Private Equity
Action – an impressive growth trajectory

                                                                    Net sales (€m)

                                                                                                                            5,114   +10%1

                                                                                                                                     4,373
                                                                                                                    4,216
                                                                                             28%
                                                                                            CAGR
                                                                                                            3,418

                                                                                                    2,675
                                                           Buyout
                                                                                            1,995
                                 21%                                                1,506
                                CAGR                                        1,155
                                                                      873
                                                    607     718
                                 426         515
   231       284       341

  2005      2006       2007      2008        2009   2010    2011     2012   2013    2014    2015    2016    2017    2018    2019     2020
                                                                                                                                    YTD P10

                                Action has shown impressive growth through 2020 P10 YTD
1 10% growth YTD P10 2020 vs YTD P10 2019.
                                                                                                                                              7
Private Equity
Action – trading has been strong since stores reopened

           Like for like sales growth by period

                                                            17%   • Strong performance weeks 1-11
                                          12%   13%   12%
                                    11%
 9%   7%                                                          • Over 900 stores closed in the
                                                                    peak of the crisis
                            (11%)                                 • All but two distribution centres
            (20%)                                                   closed or partially closed
                                                                  • Strong performance since P5 with
                                                                    double digit LFL growth
                                                                  • Stores in Netherlands open all
                    (61%)                                           year with c.9% LFL YTD P10
 P1   P2     P3       P4     P5     P6    P7    P8    P9    P10

                                                                                                       8
Private Equity
Action – strong growth in all geographies and categories

                  LFLs by country (week 20-43)1                                 Top performing category LFL growth (Q3 2020)

        Netherlands                           c.9%                                   Garden & Outdoor                      c.34%

        Belgium                                         c.14%
                                                                                     Household Goods               c.21%

        Germany                                                       c.20%
                                                                                     Sports                       c.20%

        France                                            c.15%
                                                                                     Decoration                   c.20%
        Austria                                                         c.22%
                                                                                     Linen                    c.19%
        Poland                                                c.16%

                                                                                     DIY                  c.13%
        Total                                           c.14%

1 All shops across all geographies were open as of week 20.
                                                                                                                                   9
Private Equity
Action – strong current trading and operational performance

                                     YTD P9 (P1-9)                       P10

                            Actual       Last year   Variance   Actual   Last year    Variance

Net sales (€m)              3,833            3,550      +8%       540          417       +29%

Operating EBITDA (€m)         376             338      +11%        75          46        +63%

as % of sales                9.8%            9.5%     +30bps    13.8%      11.1%      +270bps

New stores                     93             129         -36      22          22    No change

                        P10 LTM EBITDA: €608m (2019: €519m) +17%

                                                                                                 10
Private Equity
Action – store network continues to expand
+7
394 +27
84
+33
+4
380
186 +5
+1
5
9
+10
+28 64
545
# Stores open at end of P10 2020
# Additions in 2020 (to P10)
11Private Equity
Action – DC network has demonstrated resilience and flexibility
Wrocław, PL (Hub, 2020)
DC Verrières, FR (2020)
• 9th distribution centre in
Inbound operations have Verrières, France, has
started. Construction of
DC Verrières was
started inbound
delayed around 3 operations
months as a result of
Covid-19 restrictions
DC Bieruń, PL (2021)
• Opened Action’s 2nd hub
in Wrocław, Poland
DC Bratislava, SL (2021)
DC Ensuès, FR (2022) • DC network continues
Opening DC Bratislava to allow for planned
delayed to 2021 growth
DCs to open in ≥2020 DCs/Hubs opened in 2020 DCs/Hubs openedPrivate Equity
Action – all countries continue to operate within new Covid-19 restrictions
As at 10th November YTD stores / DCs Stores / DCs open Full assortment
Netherlands 394 All open ✓
Belgium 188 All open Essentials only
Luxembourg 9 All open ✓
France 547 All open Essentials only
Germany 382 All open ✓
Austria 65 All open ✓
Poland 87 All open ✓
Stores now closed on
Czech Republic 5 All open
Sundays
Total 1,677 1,677
DCs1 9 9 n/a
Note: Situation as at COB 10 November.
1 Of which eight fully operational; DC 9 in Verrières, currently taking inbound inventory, will start outbound operations on Monday 16 November. 13Private Equity
Action – business plan remains on track
2011 2019 2023
The fastest growing non-food discounter
in Europe Sales €0.7bn 7.3x €5.1bn c.€9.0bn
Exceptional track record of growth and
attractive returns EBITDA €86m 6.3x €541m >€1bn
Further European white space potential
of c.5,000 stores # Stores 269 5.8x 1,552 c.2,750
First class senior management team # Countries 3 7 >12
A discount platform primed to deliver
outstanding growth for the long term # DCs 1 8 c.15
14Private Equity
Portfolio value growth of £1.1bn supported by robust performance
Largest value increases (>£20m) Largest value declines (>£20m)
Value Value at Value Value at
Portfolio growth 30 Sep Key driver of value Portfolio decline 30 Sep Key driver of value
company (excl FX) 2020 movement company (excl FX) 2020 movement
Action £644m £4,269m Performance Audley £(52)m £72m Performance
Royal Sanders £91m £294m Performance Formel D £(35)m £110m Performance
Cirtec £86m £374m Performance
Multiple
Luqom £85m £228m Performance
Tato £50m £247m Performance
Multiple
Hans Anders £48m £272m Performance
Havea £40m £253m Performance
SaniSure £28m £165m Multiple
Performance
Evernex £27m £296m Performance
Multiple
Note: Unquoted assets only. 15Private Equity
Attractive growth in an online niche market: GartenHaus
£64m new investment1
• Online leader in garden buildings, sheds, saunas, and
related products in the DACH region
• Differentiated through own product development,
excellent customer service, management of complex
logistics and on-site assembly services
• Attractive market with double-digit growth
• Key focus on internationalisation and expansion into
adjacent product categories organically and through M&A
Germany Consumer
1 Post 30 September 2020, GartenHaus returned £3 million of overfunding, reducing 3i’s proprietary capital investment to £61 million.
16Private Equity
Expansion of our global bioprocessing consumables platform: SaniSure
Bioprocessing platform acquires Sani-Tech West and
rebrands as SaniSure
• Transformational acquisition delivers immediate scale and
global reach, and enhances product offering and
capabilities in high value therapeutic applications,
including biologics and cell & gene therapies
• Growth opportunities from high cross-selling potential and
further internationalisation
• Combination of the two businesses enhances ability to
serve Covid-19 related vaccine and therapeutic production
US/Europe Healthcare
Note: The total 3i investment in the SaniSure platform is £135 million.
17Private Equity
Creating a global leader in data centre equipment maintenance: Evernex
Evernex acquires Technogroup with 3i funding of £41m
• Leading provider of third-party maintenance of critical IT
infrastructure in DACH region and Poland
• 5,200+ customers in Central Europe; quadrupled in size
over the past ten years organically and through
acquisitions
• Combined group provides single point of contact for
customers on a truly global basis
France/Germany Business & Technology Services
18Infrastructure
Resilient performance and good cash contribution to the Group
Good performance across portfolios
• 12% gross investment return
• Good contribution from 3iN, with 17% share price appreciation and £12m of dividend income
in the period
Strong contribution to operating cash profit
• £33m of cash income through management fees and portfolio income
• AUM of £4.9bn, up from £4.4bn at the end of March
Progress in AUM development
• 3i European operational projects fund now c.60% invested
• Established a new 3i-managed vehicle to co-invest alongside 3iN, with €400m contribution
from Industriens Pension of Denmark
19Infrastructure
Strong recovery in the share price driven by robust portfolio performance
3iN relative share price performance since 1 April 2020 HY2021 highlights
(rebased to 3iN, pence per share)
• 19% TSR and 4% total return
• Focused investment in existing
portfolio
• Good portfolio income
• On track to deliver 9.8p dividend
target for the year
Source: Bloomberg
* Basket includes: HICL, BBGI and INPP 20Scandlines
Solid despite significant disruption to traffic from Covid-19
• Gross investment return of £15m, or 3% of
opening portfolio
• Solid performance through the pandemic
– freight volumes >90% of prior-year levels
– good recovery in passenger traffic once travel
restrictions lifted
• Denmark again subject to selected travel restrictions
• Well positioned to manage further uncertainties
ensuing from the pandemic
21Financial review
Julia Wilson
Group Finance Director
23NAV per share up 13% to 905 pence demonstrating portfolio
resilience
NAV per share (pence)
950
124 (7)
(12) 4 9 (17)
905
900
850
804
800
750
700
31-Mar-20 Value growth Net carry Pension Other 1 FX Dividends 30-Sep-20
payable
1 Other includes portfolio income, third party fee income and operating costs.
24Strong value growth of £1,210 million
Value movement by basis (£ million)
644 Action
546 PE increases
(119) PE reductions
127 Infrastructure
12 Scandlines
25Private Equity
Good performance and resilience reflected in valuation approach
Strong performance Good recovery since the Continued challenges
throughout pandemic lifting of lockdowns (less than 5% of portfolio value)
Tato
• Substantially all valued on June LTM • Maintainable or forecast
• Some normalisations to deal with lockdown period earnings approach; or
• Small number of multiple increases consistent with strong • DCF
performance
26Private Equity
£1,071 million value increase
Value movement by basis (£ million)
644 Action performance
1
392 Performance increases
1
(154) Performance decreases
211 Multiples
(60) DCF
(1) Other
11 Imminent sales
28 Quoted
1 Performance includes value movements relating to earnings and net debt movements in the period.
27Private Equity
Action – approach to valuation
Enterprise value (post discount)
€10.80bn • March 20 valuation consistent with EFV
€10.25bn €10.25bn
transaction value; reverted to run rate basis
in Q1
Sep-19 1 Dec-19 EV Mar-20
Transaction EV Fair value EV
1 The September 2019 valuation was based on run rate earnings.
28Private Equity
Action continues to compare well to peers
EV/ LTM EBITDA
40x
Five Below, 39.0x
35x
30x
25x Costco, 21.8x
Average, 21.1x
20x Ollie’s, 21.0x
Grocery Outlet, 20.0x
Dollarama, 19.5x
15x Dollar General, 14.8x
B&M, 11.6x
10x
5x
0x
Mar-20 Apr-20 May-20 Jun-20 Jul-20 Aug-20 Sep-20
Source: CAPIQ (pre-IFRS 16)
29Private Equity
Action – approach to valuation
Enterprise value (post discount)
€11.26bn
€10.80bn • Run rate earnings of €626m
€10.25bn €10.25bn
• 18.0x multiple post discount
• Triangulation against peer group and
DCF model
• March 20 valuation consistent with EFV
transaction value; reverted to run rate basis
in Q1
Sep-19 1 Dec-19 EV Mar-20 Sep-20
Transaction EV Fair value EV
Valuation at 30 September 2020 £4,269m
1 The September 2019 valuation was based on run rate earnings.
30Private Equity
Strong performance from the Private Equity Portfolio
Six months to 30 September
£ million 2020 2019
Gross investment return 1,245 666
% of opening portfolio 19% 11%
Realisations1 82 1
Cash investment2 231 221
Six months to 30 September
£ million 2020 2019
New investment 64 139
Further investment 52 82
Bolt-on investment 115 -
Total cash investment2 231 221
1 Realised proceeds may differ from cash proceeds due to timing of receipts. During the period 3i received £105 million of cash proceeds which were recognised as realised
proceeds in FY2020.
2 Investment is different to cash investment per the cash flow due to £31 million of syndication which was recognised in FY2020 and received in FY2021. 31Infrastructure
Strong performance from 3iN
Six months to 30 September
£ million 2020 2019
3iN 113 53
Smarte Carte (5) 3
Regional Rail 12 1
Other funds 7 2
Portfolio revaluation 127 59
Dividend, interest income and FX 7 29
Gross investment return 134 88
% of opening portfolio 12% 9%
32Scandlines
Solid performance
Six months to 30 September
£ million 2020 2019
Gross investment return 15 44
% of opening portfolio 3% 8%
30 September 31 March
£ million 2020 2020
Valuation 452 429
33Operating cash profit provides resilience
Six months to 30 September
£ million 2020 2019
Private Equity 50 13
Infrastructure 33 37
Scandlines − 27
Cash income 83 77
Operating cash expenses1 (69) (79)
Operating cash profit/(loss) 14 (2)
Objective is to at least break even
1 Operating cash expenses includes leases paid.
34Pension buy-in
One-off impact on NAV of 12 pence
• Trustees of UK defined benefit plan executed a £650m buy-in contract
• No financial contribution required from 3i
• IAS19 accounting write-down of £118m
Good outcome for plan members and 3i
35Simple balance sheet and conservative capital management
£9,578m • High quality, defensive portfolio
£687m • Gross cash held centrally with no material restrictions
• Gross debt made up of 2023, 2032 and the new £400m bond expiring
£975m
in 2040
£400m • Undrawn RCF expiring in March 2025
£1.1bn liquidity at 30 September 2020
36Q&A
Sustainability
Sustainability
Our sustainability strategy is defined by three key priorities

  1. Invest responsibly

  2. Recruit and develop a diverse pool of talent

                                                        For more information:
                                                        3i.com/sustainability/sustainability-reports-
  3. Act as a good corporate citizen                    library/2020/

                                                                                                        40
Sustainability
Our values are at the core of how we operate
Ambition Rigour and energy
Focus on generating value for all our Clarity of vision supported by practical execution
stakeholders
Thorough analysis leading to clear decision-
Strive for excellence and continuous making and effective implementation
improvement
High levels of energy, strong work ethic and
effective team working
Accountability Integrity
Personal & collective responsibility for protecting Doing the “right thing” even when difficult
and enhancing 3i’s assets and reputation
Relationships built on trust, candour and respect
An ownership mentality in managing costs,
resources and investments
An aversion to building hierarchy
41Sustainability
Our Responsible Investment policy has been in place for over a decade
Our RI policy applies to all investments. We invest
only in businesses which are committed to:
Fair and safe
The environment
working conditions
Business integrity Good governance
Specific exclusion list for “no go” sectors. Referral list
for further IC consideration. For more information:
3i.com/sustainability/sustainability-policies/
42Sustainability
Action has launched multiple initiatives to make its business more sustainable
Sustainable cotton increased to Sustainable timber increased to
DC BREEAM certifications Replaced disposables
71% (Q2 2020) 57% (Q2 2020)
sustainability
assessment
method
Partnership with SOS Children’s Support Lesbos refugees with Embedded ASR in campaign
Supplier and packaging policies
Villages extended for 3 years consumables activities
43Sustainability
Transparency and disclosure are important to our approach
Disclosures since 2017 Disclosures since 2006
Rated ‘B’ in 2019 assessment
Signatories since 2011 Member of several sustainability indices
Rated ‘A’ in the 2020 assessment
44Additional information
Our business model
Delivering sustainable returns over the cycle

   What we offer                      Value creation                 Who benefits
                           ➔ Conservative balance sheet management
                           ➔ Tight grip on operating costs
   Expertise               ➔ Operating cash profit
   Access to capital
   BLN                                       1                         Shareholders
                                           Invest
   Active partnership
                                                                         Portfolio
   Reputation                                                           companies
   Institutional culture
                                   3                 2
   Strong corporate              Realise            Grow                Employees
   governance
   Responsible approach

                                                                                      46
The portfolio has defensive underlying exposures
Portfolio value as at 30 September 2020 Examples
Value-for-money Action, Hans Anders, Basic-Fit
10%
4% 3iN, Scandlines,
Infrastructure
Regional Rail, Smarte Carte
11%
Healthcare Cirtec, Q Holding, SaniSure
49%
8% Exposure to consumer
WP, Royal Sanders, Havea, Tato
staples / essentials
18% B2B Services Evernex, Magnitude
Other
47Q2 NAV increased from 858 pence to 905 pence
NAV per share (pence)
950
81 (5)
(10)
5 (7)
(17)
905
900
858
850
800
1
30-Jun-20 Value growth Net carry Pension Other FX Dividends 30-Sep-20
payable
1 Other includes portfolio income, third party fee income, operating costs and the fair value movement on FX hedging derivatives. 483i Group
20 large investments
Investment Business description Valuation Valuation
Sep 20 (£m) Mar 20 (£m)
Action General merchandise discount retailer 4,269 3,536
3i Infrastructure plc Quoted investment company, investing in infrastructure 778 665
Scandlines Ferry operator between Denmark and Germany 452 429
Cirtec Medical Outsourced medical device manufacturing 374 302
Evernex Provider of third-party maintenance services for data centre infrastructure 296 217
Royal Sanders Private label and contract manufacturing producer of personal care products 294 198
Hans Anders Value-for-money optical retailer 272 196
WP Supplier of plastic packaging solutions 260 244
Havea Manufacturer of natural healthcare cosmetics 253 182
Tato Manufacturer and seller of speciality chemicals 247 196
Luqom (Lampenwelt) Online lighting specialist retailer 228 144
Q Holding Manufacturer of precision engineered elastomeric components 203 222
Regional Rail Owns and operates short-line freight railroads and rail-related businesses 199 195
AES Engineering Manufacturer of mechanical seals and support systems 175 158
Sanisure (Bioprocesing platform) Manufacturer, distributor and integrator of single-use bioprocessing systems and components 165 64
Smarte Carte Provider of self-serve vended luggage carts, electronic lockers and concession carts 165 172
Basic-Fit Discount gyms operator 141 93
BoConcept Urban living designer 130 119
Magnitude Software Leading provider of unified application data management solutions 116 121
Formel D Quality assurance provider for the automotive industry 110 141
49Group investment portfolio
Portfolio value at 30 September 2020 (£m) Portfolio value at 31 March 2020 (£m)
472 394
452 429
458 452
778 665
4,269 3,536
523 281
1,850 1,472
776 869
Action 2013-2016 Private Equity Action 2013-2016 Private Equity
2016-2019 Private Equity 2019-2022 Private Equity 2016-2019 Private Equity 2019-2022 Private Equity
3iN Scandlines reinvestment 3iN Scandlines reinvestment
Other Infrastructure Other Other Infrastructure Other
Note: The 2013 further Scandlines investment is not allocated to the 2013-2016 vintage for the purposes of this analysis.
50Net asset exposure by currency
2%
Change Change
Currency Net assets
YTD £m
15%
15%
Sterling £1,268m n/a n/a
Euro1 £5,954m (2.5%) £130m
US dollar1 £1,347m 4.3% £(53)m
Danish krone £130m (2.7%) £3m
68%
Other2 £42m n/a n/a
Sterling/non-revaluing Euro Total £8,741m £80m
US dollar Danish krone & other
1% movement in euro = £59 million, 1% in US dollar = £13 million
1 Net of impact of FX hedging derivatives.
2 Other mainly includes Indian rupee. 51Private Equity portfolio by value
By office location (%) By sector (%) By vintage (%)
1% 1%
5% 7%
13% 13%
6% 8%
12%
9% 9%
65% 54% 5% 60%
7%
16% 4%
4%
2%
Netherlands France Action (Consumer) Consumer Pre 2014 2014 2015
Germany UK Industrials B&TS* 2016 2017 2018
US Others 2019 2020 2021
Healthcare
Portfolio of 32 investments (31 March 2020: 32)
* Business and Technology Services. 52Private Equity
Increase in portfolio value driven by strong performance
£ million
8,500
1,071 (80) 116 7,890
8,000
7,500
7,000 231
6,552
6,500
6,000
5,500
5,000
4,500
4,000 1
Portfolio value as at Cash investment Value growth Divestment value FX / Other Portfolio value as at 30
31 March 2020 September 2020
1 Includes capitalised and other non-cash investment.
53Private Equity
Top 20 assets continue to show good earnings growth
3i carrying value at 30 September 2020
(£ million)
Number of
companies: 3
4,818
9
3 3
2
1,204
401 785 584
40%
Last 12 months’ earnings growth1
1 This represents 99% of the Private Equity portfolio by value (31 March 2020: 98%)
54Private Equity
Portfolio leverage
Ratio of total net debt to earnings by 3i carrying value at 30 September 20201
(£ million)
4,643
839 898
228 130 317Private Equity
Proprietary capital and external funds
Vintage1 Proprietary capital value at 30 September 2020 Vintage money multiple at 30 September 2020 2
Buyouts 2010-2012 £1,470m 10.0x
Growth 2010-2012 £19m 2.1x
2013-2016 £776m 2.2x
2016-2019 £1,850m 1.3x
2019-2022 £523m 1.2x
Other3 £3,252m n/a
Total proprietary capital value £7,890m
External capital value as at 30 Gross money multiple Fee income received in the
External capital September 2020 at 30 September 20204 year
3i Eurofund V £21m 3.0x -
3i Growth Capital Fund £8m 1.2x -
Other £2,602m n/a £1m
Total external £2,631m £1m
1 Assets in these vintages are disclosed on glossary section of the Half-year report.
2 Vintage money multiple includes unrealised value.
3 Includes value of £2,799 million (31 March 2020: £1,913 million) held in Action through the 2020 Co-investment vehicles and 3i.
4 Gross money multiple of the fund in external fund currency. 56Private Equity
Carried interest payable reduction a result of carry paid in the period
Six months to 30 September
2020 2019
£ million
Income statement
Carried interest receivable (2) 81
Carried interest payable (61) (63)
Net total (expense)/return (63) 18
30 September 31 March
£ million
2020 2020
Balance sheet
Carried interest receivable 9 11
Carried interest payable (564) (998)
Net total payable (555) (987)
57Infrastructure
AUM of £4.9 billion at 30 September 2020
AUM by fund or strategy (%)
7
3i Infrastructure plc
2 7
3i Managed Infrastructure Acquisitions LP
10 3i European Operational Projects Fund
53 BIIF
5
3i India Infrastructure Fund
3i Managed accounts
16
US Infrastructure
AUM increased by £452m in the first half
58Infrastructure
Assets under management
Fee income
3i commitment/ Remaining 3i % invested at received
Close date Fund size share commitment September 2020 AUM1 in the period
3iN1 Mar 07 n/a £778m n/a n/a £2,576m £12m
3i Managed Infrastructure
Jun 17 £698m £35m £5m 86% £784m £3m
Acquisitions LP
3i European Operational Projects
Apr 18 €456m €40m €16m 59% £244m £1m
Fund
BIIF May 08 £680m n/a n/a 90% £477m £2m
US$1,195
3i India Infrastructure Fund Mar 08 US$250m US$35m 73% £119m -
m
3i managed accounts various n/a n/a n/a n/a £326m £1m
US Infrastructure various n/a n/a n/a n/a £367m -
Total Infrastructure AUM £4,893m £19m
1 3iN AUM is based on share price at 30 September 2020.
59You can also read