Daniel Klocke Hans Ertle Center for Weather Research, Deutscher Wetterdienst Hohenegger, Wahl, Schlemmer, Schmidli, Göber, Rust, Löhnert, Ament ...
←
→
Page content transcription
If your browser does not render page correctly, please read the page content below
Daniel Klocke
Hans Ertle Center for Weather Research, Deutscher Wetterdienst
Hohenegger, Wahl, Schlemmer, Schmidli, Göber, Rust, Löhnert,
Ament, Kirsch, Beyrich, Weissmann, Schomburg
Hans Ertle Centre for weather research (HErZ)

                                        Five research areas:
                 Hamburg
                                        1. Atmospheric dynamics and predictability
                                            Munich

                                        2. Data assimilation
                               Berlin       Munich
Cologne/Bonn
                                        3. Model development
                                            Hamburg, Frankfurt
                         DWD            4. Climate monitoring and diagnostic
    Frankfurt
                                            Bonn/Cologne

                                        5. Optimal use of information from weather forecasts and climate
                                           monitoring for the benefit of societyBerlin
                      Munich
                                        And a cross-cutting theme:

                                        The optimal use of appropriate observing systems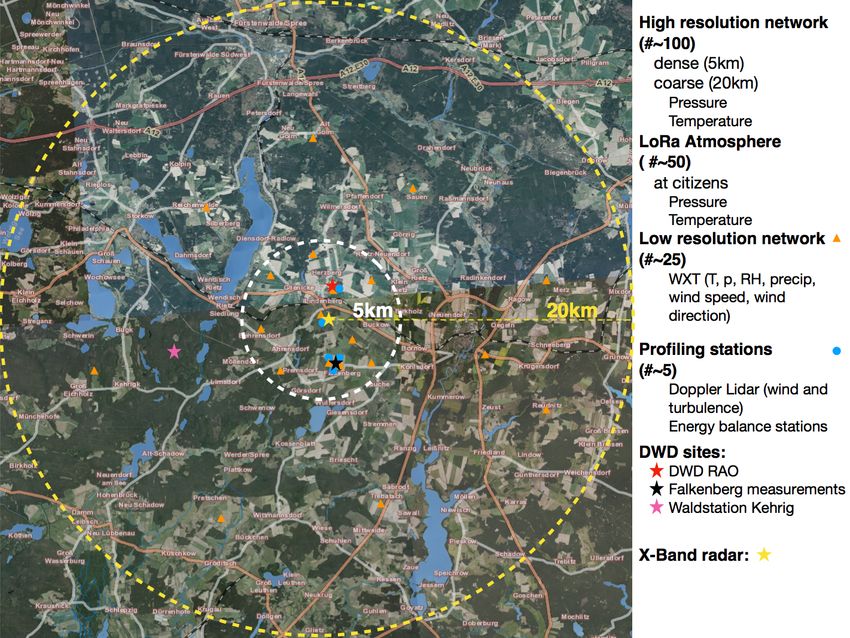
Meteorologische Observatorium Lindenberg – Richard-Aßmann-Observatorium ( MOL-RAO )
DWD measurement network

                                        OpenStreetMap

         Lindenberg
         Observatory

           DWD
    measurement network

Measurement stations:            25km
About 25 km resolution

                          5 km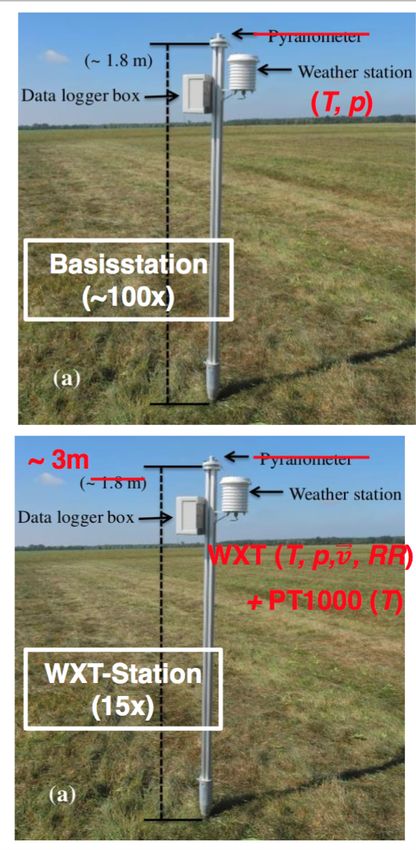
Convection-permitting scales not well observed…

                                                    OpenStreetMap

         Lindenberg
         Observatory

           DWD
    measurement network

Measurement stations:
About 25 km resolution
COSMO-model
2.2 km resolution         5 km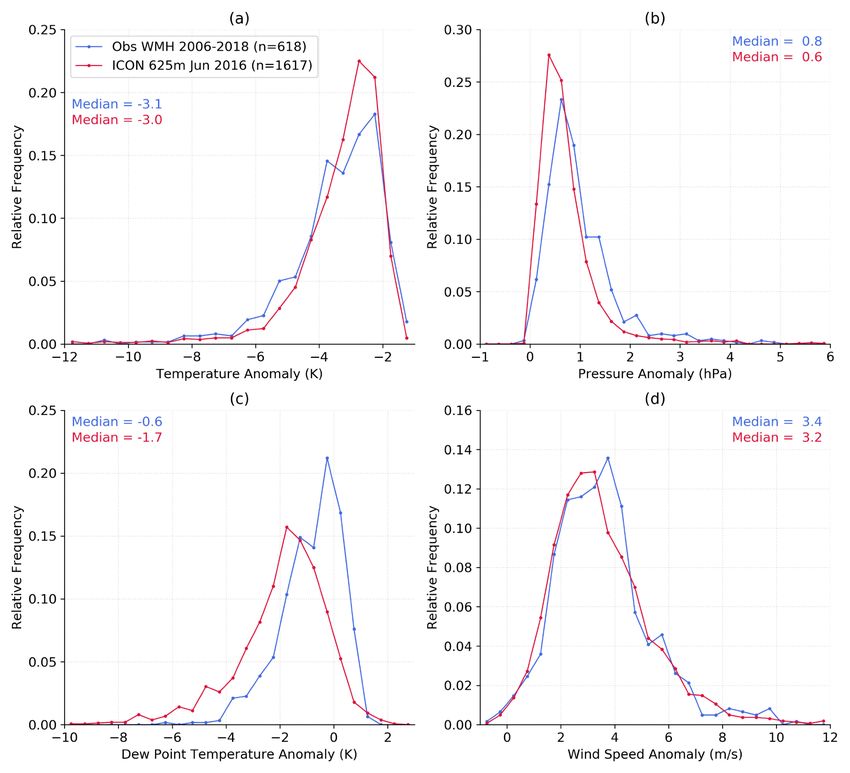
… relevant processes remain under-resolved

                                             Rasp, Selz and Craig, 2018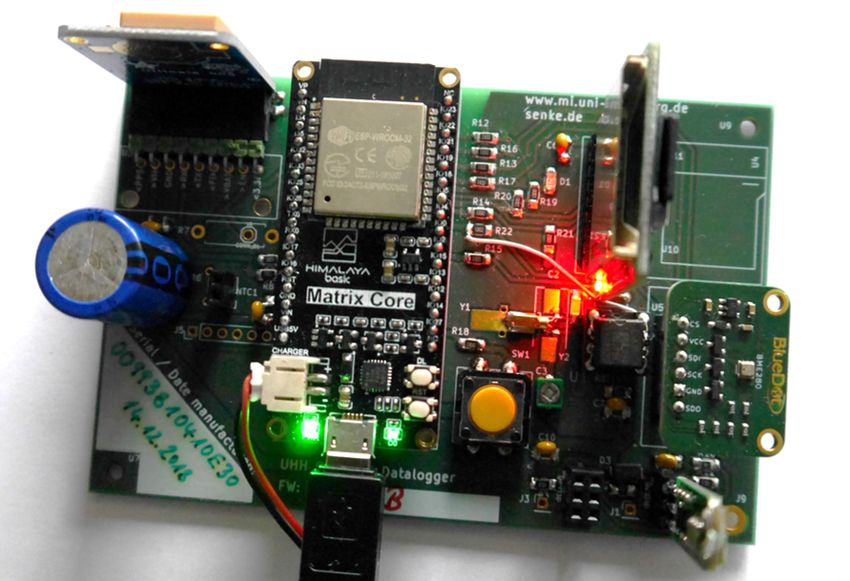
What if we measure every 100m?

                                   OpenStreetMap

         Lindenberg
         Observatory

           DWD
    measurement network

Measurement stations:
About 25 km resolution
COSMO-model
2.2 km resolution         5 km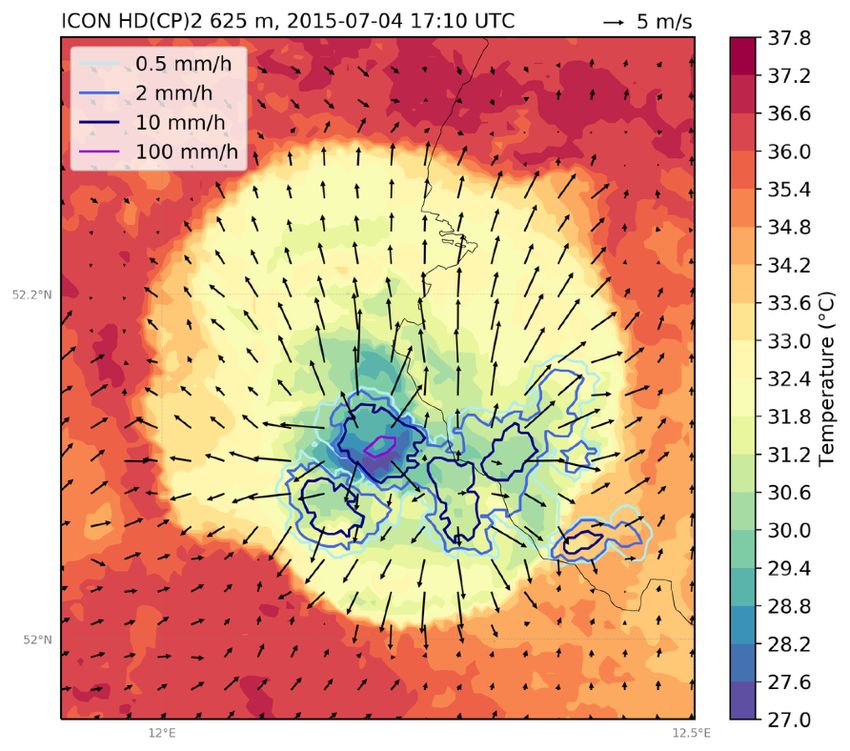
Focus
➡ measure sub-mesoscale variability: 100 m to 10 km

Goal
➡ How to measure sub-mesoscale variability?

➡ Do NWP models capture correctly sub-mesoscale variability?

➡ Process understanding: do observations support hypotheses derived from
 models?
Expressions or sources of sub-mesoscale variability

    Focus

    1. Sub-mesoscale boundary layer patterns

    2. Cold pools

    3. Wind gusts

    4. Using citizen observations
1. Sub-mesoscale boundary layer pattern

•   Characterize sub-mesoscale boundary layer patterns !                       using lidars and further
    instruments

•   Evaluate ICON-SCM with different boundary layer schemes !                           against profiles of
    mean observations and of turbulent quantities

•   Process understanding !              identification of processes causing sub-mesoscale
    variability

•   Turbulent characteristics of typical summertime boundary layers (clear, cloud-topped, with cold pools)
     • diurnal evolution (CBL and SBL)
     • day-to-day variability (dry, cloudy, with cold pools)
•   Dominant scales of turbulent & sub-mesoscale motions, the processes promoting these motions, and how well
    they can be identified
     • diurnal evolution, day-to-day variability (dry, cloudy, cold pools)
•   Evaluate boundary layer parameterizations (typical summertime ABL regimes and transition between the regimes)
2. Cold pools
• Measure the two-dimensional structure of cold pools using a high-density surface
network made of many new (and cheap) sensors
• Compare simulated cold pool statistics (size, temperature depression) to
observations
• Process understanding: Test some of the following hypotheses:
➔ Larger cold pools lead to larger clouds (Schlemmer and Hohenegger 2014)
➔ Larger cold pools have stronger temperature perturbations (Schlemmer and Hohenegger 2014)
➔ Cold pool properties are drastically impacted by the surface fluxes (Gentine et al. 2016)
➔ Stronger sensible heat fluxes lead to a faster dissipation of cold pools (Grant and van den Heever 2016)
➔ Recovery of the sensible heat flux is fast
What we know about cold pools is based on models (micr-physics!) or point measurements (size!).
What are the 2(3)d characteristics of cold pools?3. Wind gust
• Use of doppler lidars to measure wind gusts
• Evaluate simulated wind gusts and develop new wind gust diagnostic
• Process understanding: Study the effect of the environment on wind gusts at different
heights
How representative is a simulated wind gust in a 2 x 2 km2 cell at a given height?4. Citizen network
• Build low coast weather stations in dedicated workshops
• Statistical post-processing of the data to integrate it in measurement network
• To what extent does the involvement of citizen raise the interest in weather?
• Are citizen observations useful relative to the network installed by ‚experts‘?
How useful are low cost sensors built by citizen and for what?Measurement strategy
Number of days with thunderstorm
Why Lindenberg?
• Land
Lindenberg • Flat
• convective activity larger than flat regions in northern
Germany
• sparsely populated
• Extensive atmospheric measurements
• Experience with measurement campaigns (eg LITFASS)
• Support through observatory
Wapler, K., James, P., 2015:Measurement strategy
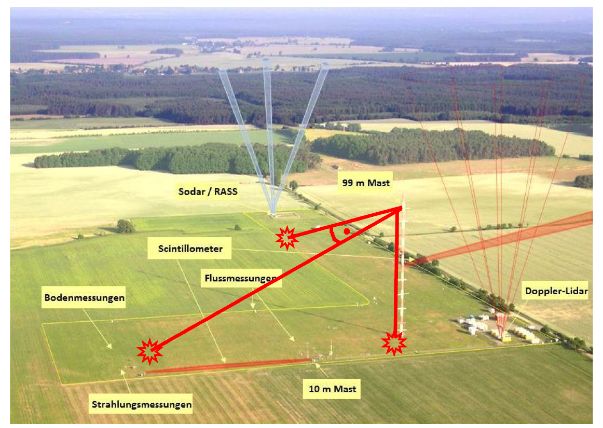
Super sites
Lindenberg
Falkenberg
Forest station
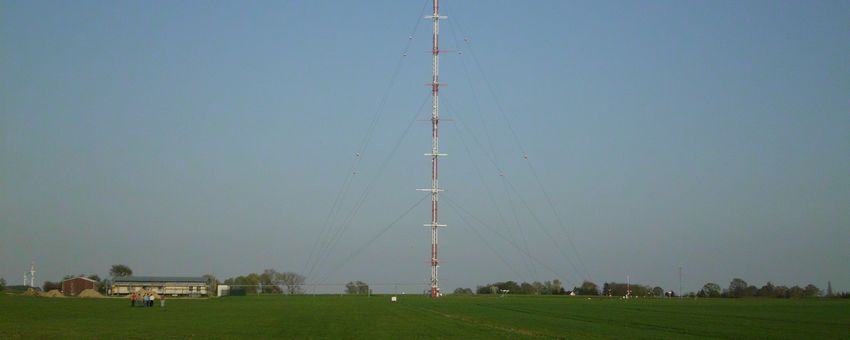
X-Band radar
Profiling stations
Doppler lidar (#5)
5 km 20 km DIAL water vapor lidar
Energy balance stations
Low-resolution network
WXT (#25)
High-resolution network
Polls (#100)
Citizen network
Low cost stations (#100)Doppler lidar
➔ To measure mean wind, turbulence quantities and wind gusts
➔ At least 3 Doppler lidar close together, plus at least two different sites
➔ Test in 2019 to determine the optimal scanning strategy
➔ For 3D wind and TKE, strategy made of a vertical stare followed by about 5
scans at different azimuth angles with fixed elevation
Virtual tower Lindenberg Doppler lidarWXTs and poles
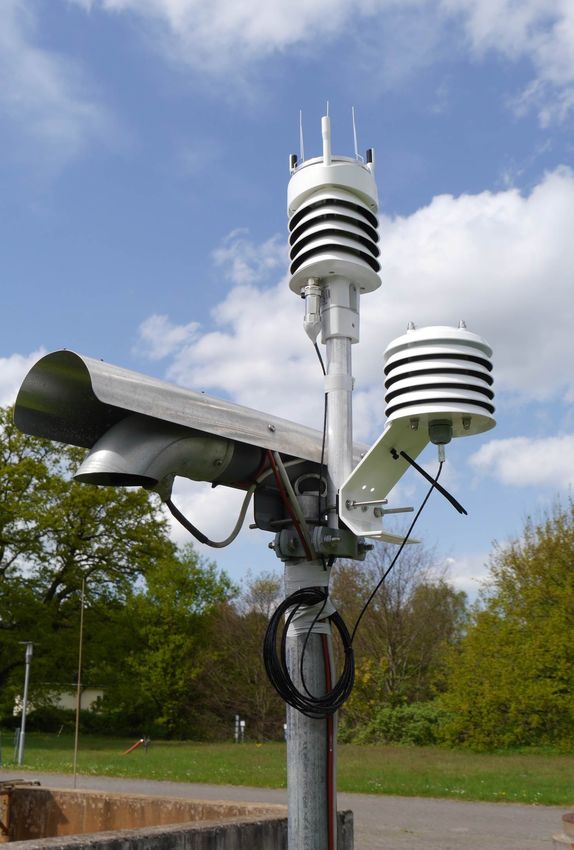
➔ To measure cold pools and wind gusts
➔ WXT stations (t, p, RH, precip, wind)
➔ Pole with a temperature and pressure sensor
Hamburg City Hamburg City
Lindenberg Lindenberg
Hamburg Airport Hamburg Airport
- NTC temperature 1s
- BME280 pressures 1s
- Cheap
- Low energy consumption
~ 0.5 – 1 hPa ~ -4K
B. Kirsch, Uni HamburgCitizen network
➔ Low-cost sensors for temperature,
humidity, pressure and radiation with
housing 3D-printed (Rust et al. 2018)
➔ Data communication based on
LoRaWAN, a long-range wireless data
communication protocol with low
power consumption
➔ Instruments built with citizen in
workshopsModeling - evaluation and development
ICON-LES ICON-SCM Model point output
600m
300m
150m
75m
Test the new now-to-short-range system SINFONYOutlook and summary
FESSTVaL will take place next summer (May - September) in Lindenberg
Measurement strategy will be finalized after tests this summer
Several foci related to sub-mesoscale variability
Test hypotheses, did we learn the right things from models?
Test and improve the models
Summer school in 2020
Website: fesstval.deOutlook and summary
FESSTVaL will take place next summer (May - September) in Lindenberg
Measurement strategy will be finalized after tests this summer
Several foci related to sub-mesoscale variability
Test hypotheses, did we learn the right things from models?
Test and improve the models
Summer school in 2020
Website: fesstval.de
Should modelers be allowed to the field?Status - CP-Logger
Data logger basierend auf ESP32 Microkontroller entwickelt von Uni. Hamburg
• NTC Temperatur- und BME280 Drucksensor mit 1s Messrate
• Niedriger Energieverbrauch (autonom für 2-4 Wochen - noch keine Dauertests)
• GPS Synchronisierung (Stündlich)
• Datenspeicher auf SD-Karten (ca. 2 MB pro Tag)
• Datendownload via WiFi
• Monitoring mit LoRa (noch nicht integriert)
5 Prototypen im Test
R. Senke, UniHHStatus - Cold pool detection
Beobachtungen und
Modelle zeigen konsistent:
∆T > 2 K
∆p > 0.5 hPa
∆Td > 1 K
∆FF > 1 m/s
Temperatur Anomalie (K) Druck Anomalie (hPa)
Model 625m: Juni 2016 (n=1617)
Wettermast Hamburg 2006-2018 (n=618)
Taupunkt Temperatur Anomalie (K) Windgeschwindigkeit Anomalie (m/s) B. Kirsch, UniHHStatus - Sensor Charakteristik
Strahlungsfehler und Windeinfluss
B. Kirsch, UniHHSommer 2019
HErZ-HH Instrumente:
⁃ ca. 20 CP-Stagen werden aufgebaut
⁃ ca. 10 WXT (ab Mai schon ein paar)
⁃ Fokus Falkenberg, aber auch ein bisschen Fläche abdecken.
• Falkenberg ca 5, Holzlager, Strasse zwischen Falkenberg und Lindenberg, Lindenberg, bei
Mitarbeitern, Wald, verschiedene Bodentypen
Zusätzliche Daten:
⁃ Scintilometer, Energiebilanz, Wolkenradar (was auch immer da ist), Turbulenz, Regenradar
(Prötzel), Satellite (um Grösse abzuschätzen)
⁃ Standart Meteorologie (T, u, v, P_surf) minütlich? 600m
⁃ Wie oft werden die Daten gespeichert und Verfügbarkeit?
350mYou can also read