Study on the stability of highway slope in cold region under freeze-thaw cycles
←
→
Page content transcription
If your browser does not render page correctly, please read the page content below
E3S Web of Conferences 248, 03046 (2021)                                                                https://doi.org/10.1051/e3sconf/202124803046
CAES 2021

         Study on the stability of highway slope in cold region under
         freeze-thaw cycles
         Hongyu Chen1,*, Xizhong Yuan1, and Wenbo Liu1
         1Chang’an   University, Highway College, 710064 Xi’an, China

                       Abstract. Based on thermo-mechanical coupling and elastoplastic theory, a finite element (FE) numerical
                       simulation was adopted to study the stability of slopes in cold regions under freeze-thaw cycles. And the
                       prediction of slope landslide was also studied through the calculation of strength reduction coefficients
                       combination. The result shows that the development of the slope vertical displacement under freeze-thaw
                       cycles can be divided into two stages: rapid stage and stable stage. After combining the two reduction
                       coefficients of cohesion and internal friction of the soil, the maximum vertical displacement on the top of the
                       slope in this region can be calculated as a reference for predicting the slope landslides. Meanwhile, the
                       corresponding safety factor of the slope in the cold region can be obtained according to the reduction
                       coefficients. .

       1 Introduction                                                         the alternating temperature of cold and warm year after
                                                                              year. In warm seasons, the slope begins to melt and the
       With the global warming, the instability and landslides of             moisture content increases as the temperature rises, which
       slopes in cold regions are gradually increasing [1].                   reduces the shear strength of the sliding surface, resulting
       Therefore, the research on the stability of frozen soil                in a sharp decline in the stability of the slope. Under
       slopes in cold regions has become more and more                        repeated freezing and thawing, the moisture content of the
       important. The positive freezing landslides, positive                  soil increases. When the voids between the soil particles
       thawing landslides, and freezing-thaw landslides are the               are completely filled with water, the stress between the
       main types of instability to slopes in cold regions, and               soil particles decreases, thus reducing the cohesion and
       thermal thawing is a common cause of slope landslides in               shear strength of the soil.
       cold regions [2,3]. Fujun Liu studied the development and                  Under the action of long-term freeze-thaw cycles, the
       deformation characteristics of landslides based on the                 mechanical parameters of soil change to varying degrees.
       engineering examples of slope thermal melt landslides in               Researchers found through laboratory experiments that
       permafrost regions of the Qinghai-Tibet Plateau, and                   the soil cohesion and internal friction angle damage
       summarized the causes of slope landslides as external                  coefficients would gradually decrease with the increasing
       factors (man-made excavation, water flow, erosion) and                 number of freeze-thaw cycles. After 10 freeze-thaw cycles,
       internal factors (melting ice at the freeze-thaw interface)            the damage coefficient and the shear strength of the soil
       [4,5].                                                                 both tend to be stable [6].
           The soil slopes in cold regions are subjected to the
       effects of repeated thawing settlement and frost heave
       under the temperature cycle, so that the strength of the               3 Models
       slope soil is reduced and ultimately leads to instability
       [6,7]. Freeze-thaw in the temperature cycle only occurs in             3.1 Geometric model and parameters
       the soil in the seasonal active layer, for which the
       traditional slope stability analysis method is not suitable.           Comprehensively considering the relationships among
       Aiming at the highway slope in the frozen soil area of the             strength parameters, time and temperature, a FE thermal-
       Greater Khingan Mountains, a finite element (FE)                       mechanical coupling model of frozen soil slope is
       multiphysics simulation software was used to establish an              established to study the instability process caused by the
       elastic-plastic thermo-mechanical coupled slope model.                 decline in strength of the slope after freezing and thawing
       The displacement field of the slope under freeze-thaw                  cycles.
       cycles was analysed, and its sliding process was discussed.                The geometric model is shown in Figure 1, where the
                                                                              gradient of the slope is 1.
       2 Theory
       The moisture in the frozen soil slopes will transfer under

         *   Corresponding author: 2018121150@chd.edu.cn

  © The Authors, published by EDP Sciences. This is an open access article distributed under the terms of the Creative Commons Attribution License 4.0
  (http://creativecommons.org/licenses/by/4.0/).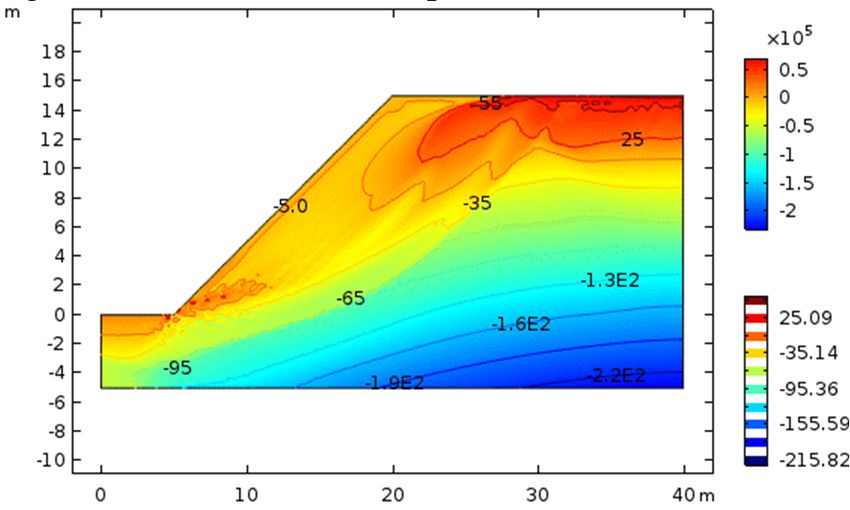
E3S Web of Conferences 248, 03046 (2021) https://doi.org/10.1051/e3sconf/202124803046
CAES 2021
3.2 Boundary conditions
The annual average air temperature in the Greater Khingan
Mountains is -5℃ to 0℃. In this paper, considering that
the annual average temperature in the northeast of China
is increasing year by year, the temperature and surface
temperature are calculated with the following function
[11-14]:
Ta = TM + A/2sin(2πt/365) + 0.05t/360 (6)
Ts = 1.1939Ta + 1.3182 (7)
Fig. 1. Slope geometry. where Ta presents the air temperature; TM presents
annual average temperature; t presents the time in days; A
The relationship between mechanical parameters of presents the range of temperature throughout the year; Ts
frozen soil and temperature in cold area is defined as [8]: presents the surface temperature of the slope.
E = a1+b1T0.6 (1)
ν = a2+b2T (2) 4 Results and discussion
c = a3+b3T (3)
4.1 Slope stability
φ = a4+b4T (4)
where E presents the modulus; ν presents Poisson's Slope landslide is affected by many factors, such as the
ratio; c presents the cohesion; φ presents the angle of moisture content of the soil, the shear strength and the
internal friction; ai and bi are the test parameter, and the cohesion of the soil, the grade of the slope, etc. First of all,
values of each number in the model is shown in Table 1. assuming that the moisture content of the soil is 15%, the
process and causes of the slope landslide are analysed
Table 1. Mechanical parameters of the soil. from the results of the stress field through FE numerical
calculation.
a1 b1 a2 b2 a3 b3 a4 b4 When the FE numerical simulation analysis is not
convergent, it is deemed that the slope has been slumped
20 27 0.3 -0.008 0.024 0.09 12.5 0.6 under this condition. Figure 2 and Figure 3 respectively
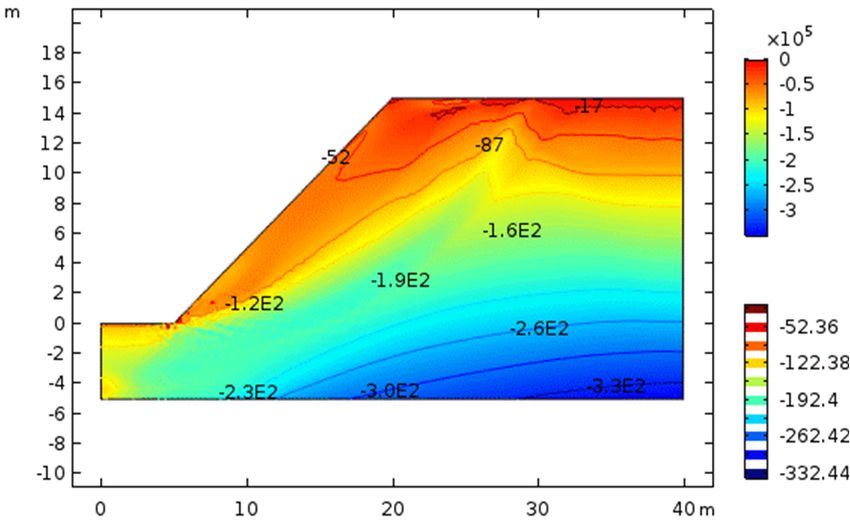
show the slope stress distribution when the slope is unstable.
The maximum tensile stress on the top of the slope is
The relationship between initial moisture content and 55 kPa, while the maximum compressive stress inside the
soil strength is [9]: slope is 330 kPa, which is at the lower part of the slope.
Figure 4 shows the effective plastic strain distribution.
C = A+B w c (5)
In the formula (5), A, B and c all present experimental
parameters, and in the model of this paper, A = 0.0208, B
= 1.2054E-11, and c = 7.5578. The thermophysical
parameters of the soil in different water comtent are shown
in Table 2 [10].
Table 2. Thermophysical parameters of the soil in different
moisture content.
w(%) ρd Cu Cf λu λf
15 1830 2200 1880 0.94 0.95 Fig. 2. Maximum principal stress distribution.
17 1800 2320 1950 1.01 1.07
19 1890 2500 2020 1.09 1.20
where w presents the soil moisture content; ρd presents
the dry density of soil; Cf represents the heat capacity of
the soil at positive temperature; Cu represents the heat
capacity of the frozen soil; λu represents the heat transfer
coefficient of the soil at positive temperature; λf represents
the heat transfer coefficient of the frozen soil.
Fig. 3. Minimum principal stress distribution.
2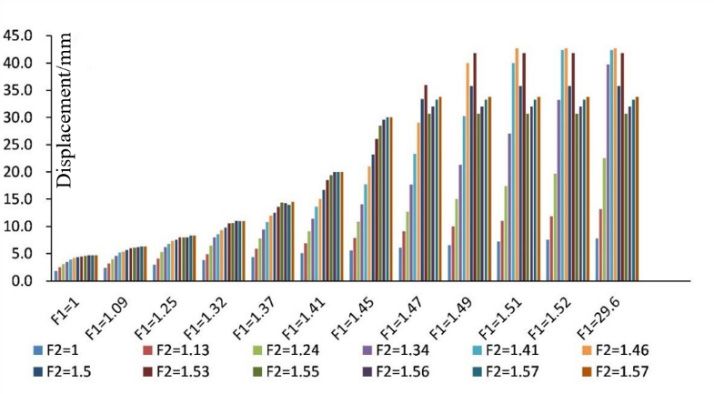
E3S Web of Conferences 248, 03046 (2021)                                                            https://doi.org/10.1051/e3sconf/202124803046
CAES 2021

                                                                             Fig. 6. Vertical displacement with a moisture content of 17%.
                 Fig. 4. Effective plastic strain distribution.

           Figure 5 shows the vertical displacement of the point
       A (on the top of the slope) and the point B (on the surface
       of the slope) over time. The changing trend of the vertical
       displacement of point A and point B in a freeze-thaw cycle
       is basically the same, which can be divided into a rapid
       stage and a stable stage. Specifically, as the temperature
       gradually rises, the seasonal active layer will gradually
       melt and the moisture content of the soil will increase,
       resulting in a sharp drop in the strength of the soil, which
       is the cause of the rapid development of the vertical
       displacement of point A and B. After entering the cold
       season, the active layer of the slope gradually freezes, and          Fig. 7. Vertical displacement with a moisture content of 19%.
       the shear strength of the soil increases significantly with
       the decrease in temperature. During this period, the                 4.2 Slope stability prediction
       development of the vertical displacement at points A and
       B slow down.                                                         The strength reduction method is mainly used to judge
                                                                            whether the slope has slide based on two aspects: the
                                                                            change of the vertical displacement, the extent of the
                                                                            plastic zone. First, set an initial strength reduction factor
                                                                            and bring it into the model for calculation. If the
                                                                            calculation result shows that the slope is still in a stable
                                                                            state, increase the strength reduction factor and recalculate.
                                                                            When the reduction factor increases to a certain value, the
                                                                            slope begins to slide, so the reduction factor at this time
                                                                            can be regarded as the safety factor of the slope. The
                                                                            strength after reduction is expressed as:
                                                                                                     CF = C/F1                         (8)
                                                                                                         -1
                                                                                                φF = tan [tan(φ/ F2)]                  (9)
        Fig. 5. Vertical displacement with a moisture content of 15%.           where CF presents the cohesion of the soil after
                                                                            reduction; C presents the initial cohesion; φF presents the
           In addition, the influence of different water content of         internal friction angle of the soil after reduction; φ
       the two soil bodies is also analysed. Figure 6 and Figure 7          represents the internal friction angle; F1 presents the
       show the vertical displacement of points A and B when the            reduction coefficient of cohesion, and F2 represents the
       soil moisture content is 17% and 19%, respectively. For a            reduction coefficient of internal friction angle.
       slope with a soil moisture content of 17%, it eventually                 F1 was selected to 12 different values at equal intervals
       landslide after 8 repeated freezing and thawing. For a               from 1 to 1.52. F2 was selected to 12 different values at
       slope with a soil moisture content of 19%, it can maintain           equal intervals from 1 to 1.57. Then combine different F1
       long-term stability.                                                 and F2 into 114 different strength reduction coefficients
                                                                            combinations, and then bring each combination into the
                                                                            model for calculation.
                                                                                Figure 8 shows the vertical displacement of the point
                                                                            A calculated by 114 combinations of reduction
                                                                            coefficients. It can be seen from the figure that before F1
                                                                            increases to 1.45, the vertical displacement continues to

                                                                        3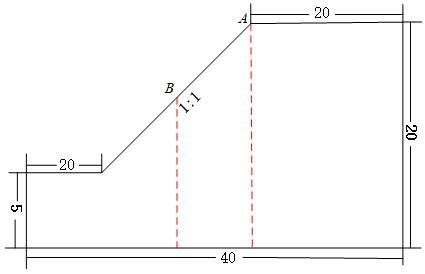
E3S Web of Conferences 248, 03046 (2021)                                                            https://doi.org/10.1051/e3sconf/202124803046
CAES 2021

       increase with the increasement of F1 and F2. After F1 =                   Geotech. Eng 26 (3), 402-406 (2004)
       1.47 and F2 = 1.55, the displacement does not continue to           4.    Niu, F.J. Luo, J. Lin, Z. Cold Reg. Sci. Technol. 83-
       increase, because the calculation of the model does not                   84 (15), 131-138 (2012)
       converge, and the slope begins to landslide. At this time,
                                                                           5.    Niu, F.J. Luo, J. Lin, Z. Jpn. Landslide Soc. 13 (1), 1-
       the maximum vertical displacement is 42.68 mm.
                                                                                 11 (2016)
       Therefore, it can be considered that when the vertical
       displacement of point A is less than or equal to 42.68 mm,          6.    Gao, Q. Wen, Z. Wang, D.Y. Niu, F.J. Xie, Y.L. Gou,
       the slope is safe, and 42.68 mm is the displacement at                    Y.T. Rock Soil Mech. 39 (08), 2814-2822 (2018)
       which the slope is in a critical state of landslide.                7.    Srikrishnan, S.S. Tatsuya, I. Tetsuya, T. Eng. Geol.
                                                                                 221, 154-169 (2017)
                                                                           8.    Yu, L.L. Xu, X.Y. Qiu, M.G. Yan, Z.L. Li, P.H. Rock
                                                                                 Soil Mech. 31 (08), 2448-2452(2010)
                                                                           9.    Lu, Z. Xian, S.H. Yao, H.L. Fang, R. She, J.B. Cold
                                                                                 Reg. Sci. Technol. 157, 42-52 (2019)
                                                                           10.   Xin, L.C. Ma, W. Xu, Z.L. Xu, X.Y. Wang, J.L. Code
                                                                                 for engineering geological investigation of frozen
                                                                                 ground (China Planning Press, Beijing, 2014)
                                                                           11.   Li, S.Y. Zhang, M.Y. Zhang, S.J. Huang Z.J. J.
                                                                                 Glacio.`Geocry. 5, 860-867 (2008)
            Fig. 8. Vertical displacement of point A under different
                                                                           12.   Yang, Y. Liu, H.P. Wang, Z.G. Yin, W.C. Zang, W.L.Y.
                    combinations of reduction coefficients.
                                                                                 Ge, Q. Heilongjiang Gongcheng Xueyuan Xuebao,
                                                                                 Ziran Kexueban. 31 (01),15-18 (2017)
                                                                           13.   Zhao, S.C. Luo, Y. J. Meteo. Env. 23 (3), 1-4 (2016)
       5 Conclusion                                                        14.   Yuan, X.Z. Li, N. Zhao, X.Y. Rock Soil Mech. 31 (10),
       Aimed at the stability of slopes in cold areas, this paper                3265-3273 (2010)
       used FE multiphysics simulation software to establish an
       elastic-plastic thermo-mechanical coupled slope model,
       and analysed the displacement under several freeze-thaw
       cycles, and use the combination of reduction coefficients
       to obtain the maximum displacement before the slope
       failure.
           Through the calculation results, the full article can be
       summarized as follows:
           • Under the freeze-thaw cycles, the vertical
       displacement curve of the slope in the cold area with time
       is like a step, which can be divided into a rapid
       development stage and another stable development stage.
           • The FE numerical calculation shows that the moisture
       content of the slope soil has a great influence on the
       stability of the slope.
           • By combining the reduction coefficients of cohesion
       and internal friction angle into the FE model for
       calculation, the maximum vertical displacement before the
       slope landslide can be obtained, which can be used to
       predict the landslide.

       Acknowledgments
       Authors are very grateful to Penghui Chen and Yaguang
       Yuan for their help and valuable discussions in the method
       of this paper.

       References
       1.   Li, D.S. Wen, Z. Luo, J. Zhang, M.L. Chen, B. Sci.
            Total Environ. 694, 133547 (2019)
       2.   Kumsar, H.A. Mec. Roches 33 (1), 31-51 (2000)
       3.   Niu, F.J. Cheng, G.D. Lai, Y.M. Jin, D.W. Chin, J.

                                                                       4
You can also read


