2021 Monsoon Outlook - National Weather Service
←
→
Page content transcription
If your browser does not render page correctly, please read the page content below
2021 Monsoon Outlook                                                                           Albuquerque
For Central & Northern New Mexico                                                                     WEATHER FORECAST OFFICE

  *Updated
  6/10/21

                                                                                                                   Courtesy: Stu Ostro

  Courtesy: Randall Hergert

Courtesy: Derrick Neill                                   Courtesy: Tim Fitzharris/Minden Picture   Courtesy: William Stone Photography

    Will this year’s North American Monsoon (NAM) show up? After the end of La Niña, it looks like it just might.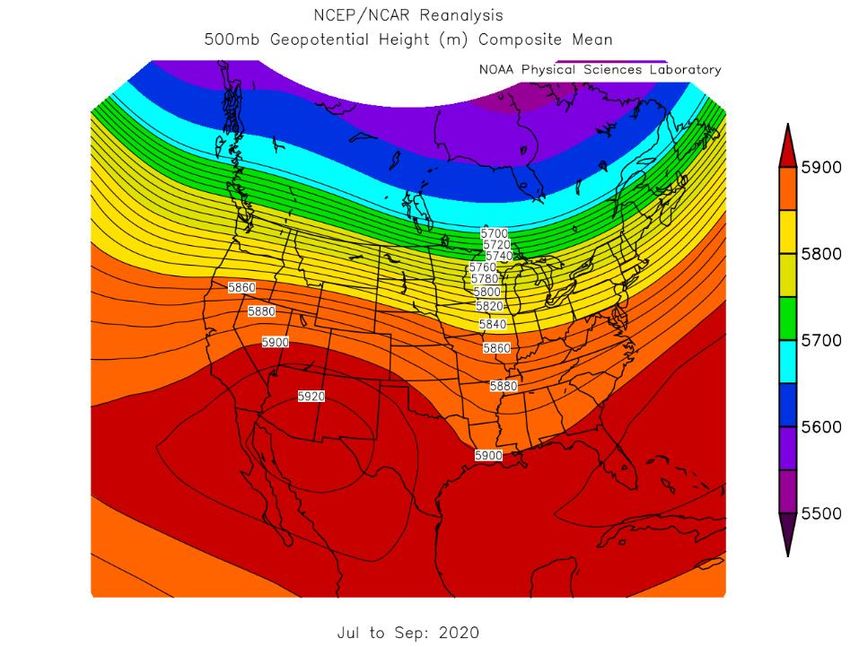
2021 Monsoon Outlook                                                                            Albuquerque
                                                                                                     WEATHER FORECAST OFFICE

*Updated
6/10/21

Figure 1. May 2021 sea surface temperature departure from the 1981-2010 average showing a neutral central and eastern
equatorial Pacific Ocean.
2021 Monsoon Outlook                                                                                 Albuquerque
Current Sea Surface Temperatures (SSTs)                                                                   WEATHER FORECAST OFFICE

*Updated                                                                                ➢ Multivariate ENSO Index
6/10/21                                                                                 (MEI) for APR-MAY 2021: -1.1

                                                                                        ➢ Pacific Decadal Oscillation
                                                                                        (PDO) for APR 2021: -0.91
*SSTs are what
drive tropical &                                                                        ➢ Atlantic Multidecadal
sub-tropical                                                                            Oscillation (AMO) for MAY
thunderstorms.                                                                          2021: -2.29
It’s these
thunderstorms                                                                           ➢Pacific Meridional Mode
that drive global                                                                       (PMM) for MAY 2021: -2.11
weather & climate.
                                                                                        ➢Oceanic Niño Index (ONI)
                                                                                        (uses Niño 3.4 region - inner
                                                                                        rectangle) for MAM 2021: -0.7

                     Figure 2. SST Anomalies in the Equatorial Pacific Ocean in early
                     June 2021 showing that La Niña has ended and neutral conditions
                     have developed.
2021 Monsoon Outlook                                                                            Albuquerque
 Sub-surface Temperatures                                                                           WEATHER FORECAST OFFICE

*Updated
6/10/21

Figures 3-4. Sub-surface temperature anomalies at the equator. Sub-surface temperatures often lead surface temperatures by
several months. An increasing amount of warm water under the surface provides confidence in climate models that are
forecasting neutral conditions through fall 2021.
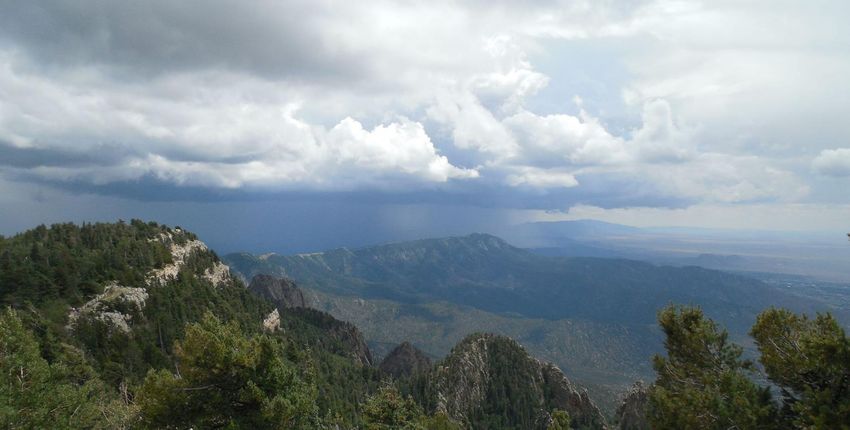
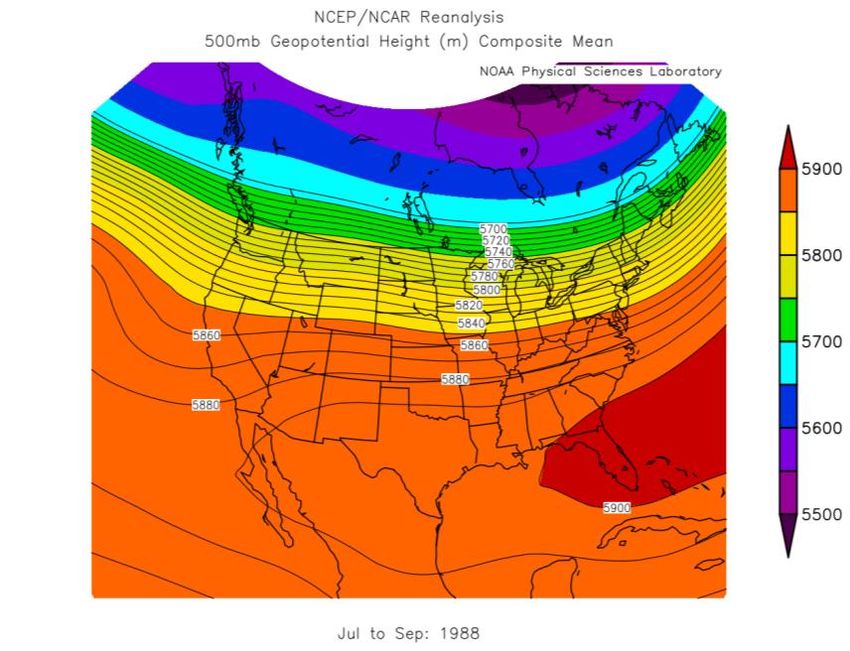
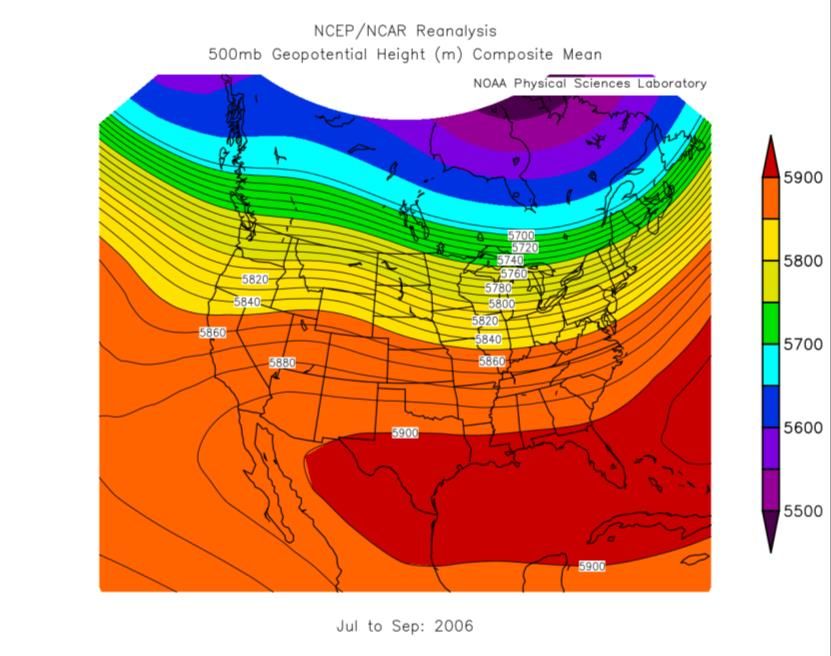
2021 Monsoon Outlook                                                                                                                           Albuquerque
 Why the NAM is So Tough to Predict                                                                                                                    WEATHER FORECAST OFFICE

Figures 5-7. Why is the North American Monsoon (NAM) so difficult to predict? There are many reasons but the main difficulty has to do with a lack of ability to predict the
placement and strength of the subtropical high which sets up near the Four Corners each and every summer. This subtropical high develops due to tropical and subtropical
thunderstorms in the eastern Pacific, Mexico and Central America shifting northward with the sun angle. The rising air associated with these thunderstorms has to come back
down due to the fact that there’s a stability lid on the lower atmosphere (temperatures begin rising with height) referred to as the tropopause. Then there’s the subtropical and
polar jet streams that influence how this high shifts during the months of July, August and September. If there is prolonged tropical and subtropical convection in the right locations
in the eastern Pacific Ocean, a subtropical jet stream will become stronger than average off of the southern California coast and so will the associated upper-level trough that sets
up several hundred miles west of the southern CA coast. It’s the fluctuations in strength associated with this trough that can send the Four Corners’ High (FCH) east of NM,
developing a prolonged southerly flow (clockwise flow around the high to the east and counterclockwise flow associated with the low/trough to the west) that sends moisture
northward into AZ/NM. Global climate models are not “convective allowing” which makes the NAM such a challenge to predict. Additionally, while the lack of soil moisture
correlates well to the much stronger Asian Monsoon, it doesn’t necessarily work well for the NAM. There have been many spring and early summer seasons dating back to the late
1990s when soil moisture in the Western U.S. was below to well below average and the NAM precipitation ended up being below to well below average.
Then there are climate change impacts to consider. The polar jet stream is not as continuous as it once was. A “uniform” or continuous westerly jet stream can act on the FHC,
forcing it east at times. Take a look at the difference in 500 mb (~18K feet MSL) heights between the two most rigorous monsoon seasons, 1988 and 2006, and last year. The FCH
in JAS 2020 was stronger (due to a warming planet and stronger than average Hadley/Ferrel Cells) and likely much more difficult to displace.
2021 Monsoon Outlook                                                                              Albuquerque
For Central & Northern New Mexico                                                                       WEATHER FORECAST OFFICE

*Updated
6/10/21

Figures 8. Sea Surface Temperatures (SSTs) in the Western Hemisphere in early June 2021 showing warmer waters (< 26ºC)
water already making their way into the Gulf of California (GOC). A previous study (Mitchell et al., 2002) showed that monsoon
precipitation does not occur prior to the GOC exceeding 26ºC.
2021 Monsoon Outlook                                                                               Albuquerque
 Madden-Julian Oscillation (MJO)                                                                         WEATHER FORECAST OFFICE

Figure 9. The MJO is an area of enhanced thunderstorms that travels around the world every 30 to 60 days from west to east
along/near the equator. Ahead and behind the active stormy area are areas of suppressed convection and drier conditions. The
MJO affects near-surface wind patterns, because the rising air in the stormy area causes surface winds to blow toward the active
area. The MJO can play a role in New Mexico’s weather at any time of year but it tends to have its greatest impacts during
September.
2021 Monsoon Outlook                                                                                             Albuquerque
 Precipitation Forecasts for July, August and September (JAS)                                                          WEATHER FORECAST OFFICE

 *Updated
 6/10/21

      Forecast Skill

      Precipitation rate
      anomaly
      forecast

Figures 10-13. Climate model precipitation rate anomaly plots from the two climate models which have the highest forecast skill percentages
(top images), the Canadian GEM_NEMO model and the Geophysical Fluid Dynamics Laboratory (GFDL_SPEAR) model. Both models are
forecasting various degrees of near average precipitation for July, August, and September (JAS) for western and central New Mexico with slightly
below to below average precipitation east.
2021 Monsoon Outlook                                                                                        Albuquerque
Temperature                                                                                                       WEATHER FORECAST OFFICE

  *Updated
  6/10/21

     Forecast Skill

   Temperature
   anomaly forecast

Figures 14-17. Climate model temperature anomaly plots from the three climate models which have the highest skill percentages (top images),
the North American Multi-Model Ensemble (NMME) and the GFDL_SPEAR model. Model forecasts (bottom images) indicate slightly above to
above average temperatures during JAS.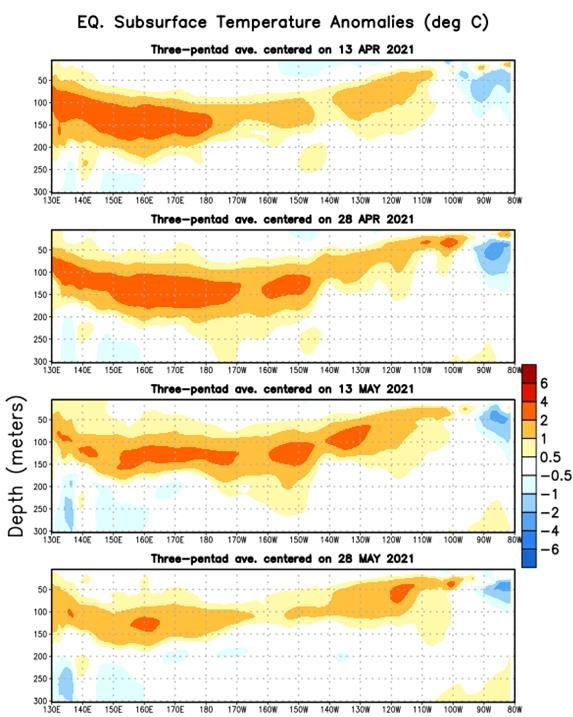
2021 Monsoon Outlook                                                                           Albuquerque
Climate Prediction Center                                                                           WEATHER FORECAST OFFICE

*Updated
6/10/21

Figures 20-21. CPC agrees with the climate model consensus of above average temperatures and slightly higher chances than
average for below average precipitaiton.
2021 Monsoon Outlook                                                                        Albuquerque
                                                                                                 WEATHER FORECAST OFFICE
Japan Agency for Marine-Earth Science and Technology (JAMSTEC) – SINTEX-X

    June, July & August 2021 –      September, October &      June, July & August 2021 –      September, October &
     Difference from Average     November 2021 – Difference    Difference from Average     November 2021 – Difference
            Temperature           from Average Temperature            Precipitation         from Average Precipitation

Figures 22-25. April 2021 JAMSTEC SINTEX-X climate model forecasts showing a similar forecast for the NAM.
2021 Monsoon Outlook Albuquerque Multivariate El Niño Index (MEI) - Analog Years WEATHER FORECAST OFFICE Figures 26. Monthly sea surface temperature in the Niño 3.4 region of the tropical Pacific for 2020-21 (purple line) and all other years starting from first-year La Niña winters since 1950. Graph by Emily Becker based on ERSSTv5 temperature data. A “double-dip” La Niña like 2016 and 2017 is in the cards once again late this year but the odds favor neutral conditions (49%).
2021 Monsoon Outlook                                                                           Albuquerque
 ENSO Predictions                                                                                    WEATHER FORECAST OFFICE

Figure 27-28. Neutral conditions are likely to continue through the Northern Hemisphere summer 2021 (63% chance) and fall
(55% chance).
2021 Monsoon Outlook                                                                  Albuquerque
                                                                                           WEATHER FORECAST OFFICE
 Summary
 *Updated
 6/10/21
➢ Forecasts from the most highly skilled climate forecast models indicate that precipitation in central and
  northern New Mexico during July, August and September 2021 will most likely range from near to slightly
  below 1981-2010 climatological averages central and west and below average east.
➢ Climate model forecasts along with recent temperature trends indicate that temperatures in central and
  northern New Mexico during JAS 2021 will most likely range from slightly above to above average.
➢ Climate models are suggestive of an earlier than average NAM onset, particularly for far southwest NM.

➢ Main takeaway from the June climate model forecasts is a stark lack of forecast skill improvement from May
  2021, after the spring forecast barrier passed. Given recent FCH persistence during the past 15 years or so
  (polar regions are warming at a faster rate than the tropics, weakening the westerlies/polar jet stream) due
  to climate change, near average precipitation during July, August and September is getting harder to come by
  in NM. An “average monsoon” may be a thing of the past simply because a more chaotic or distorted polar
  jet stream is less likely to force the FCH eastward in order to maintain a low and mid-level southerly
  moisture transport.
2021 Monsoon Outlook Albuquerque
Outlook Information WEATHER FORECAST OFFICE
➢ Outlook provided by National Weather Service Forecast Office Albuquerque, NM.
➢ For further information contact Andrew Church: andrew.church@noaa.gov (505) 244-9150
References
Mitchell et al., Gulf of California Sea Surface Temperatures and the North American Monsoon:
Mechanistic Implications from Observations – Journal of Climate 2002You can also read