DANISH FOOTBALL ANALYSIS - PREPARED BY STATSBOMB FOR DIVISIONSFORENINGEN APRIL 2019
←
→
Page content transcription
If your browser does not render page correctly, please read the page content below
Danish Football Analysis
Prepared by StatsBomb for
DivisionsForeningen

April 2019
Contents
●   Executive Summary

●   Introduction

●   Data Clarifications

●   Goals, xG and Shots
●   Passing, Possessions & Dribbling
●   Defending
●   Formations
●   Age Analysis
●   Phases

●   Conclusions
Executive Summary
This project uses football event data to compare the Danish Superliga, English Premier League and German Bundesliga over a five season
period beginning in 2014-15. While professional football contains many strong similarities across different leagues, it is also clear that distinct
differences exist and StatsBomb was able to draw them out by evaluating datasets for each league.

  ●    Open Play: The Danish Superliga has kept pace with the Premier League in terms of goals, shots, and expected goals volumes, yet
       both leagues sit below the more action packed Bundesliga. There is also a lessened disparity between the top and bottom Danish
       teams in comparison to the other leagues.
  ●    Set Pieces: Danish teams score more goals from set pieces than their counterparts in the Premier League and Bundesliga. This
       includes direct free kicks, corners or indirect free kicks and especially throw ins. The last of which they utilise to a notable extent.
       Weaker teams across all leagues rely heavily on set pieces, however stronger teams in Denmark get more out of them than their
       English and German peers.
  ●    Passing: All leagues are moving towards a shorter passing, possession focused approach. Yet the Danish Superliga overall remains a
       more direct competition. Danish teams also use the wide areas more for creating chances.
  ●    Age: The average age of players in the Danish Superliga is younger than the Premier League and, to a lesser extent, the Bundesliga.
       Likely due to the Danish league’s comparatively lower resources leading to more of a developmental approach.

From first glance Danish football resembles the elite of European football in many facets, and it follows many similar trends. Yet a deeper look
reveals it to be a more direct league with an innovative focus on set pieces.
Introduction
Danish football is an interesting place. The domestic league is starting to garner more attention due to
idiosyncratic success stories like that of FC Midtjylland and some notable appearances on the European
stage. The system as a whole is producing players are shining at the top levels of the game. Now is a good
time to take stock.

The purpose of this report is to compare the Danish Superliga’s trajectory to that of the German Bundesliga
and the English Premier League, two elite competitions at the top of Europe’s elite football hierarchy. What is
the stylistic and quantitative profile of the Danish league and how has it changed over the years? Does this
profile show any similarities - or any unique aspects - when matched up with these two stronger, wealthier
leagues?

We will also, where it is relevant, compare the profiles of the stronger and weaker teams in these respective
leagues. Here defined as the teams who finished in the top five or the bottom five of the league table in a
given season. Are the characteristics that lead to success in one league shared with equivalent teams in a
different one? And do the weaker teams fail for the same or distinct reasons?

                          This report will compare the Danish Superliga with the English Premier League and the German
                                                                       Bundesliga, from 2014/2015 to the current season
Data Clarification
This report was compiled using Opta data for the 2014/15 to 2018/19 seasons (up to date as of the end of February 2019) for the
following competitions:

  ●    Danish Superliga

  ●    English Premier League

  ●    German Bundesliga

For many aspects of the analysis there are no problems with this dataset. However, one key thing to keep in mind is that Opta use
different data specifications in different countries. For these purposes the largest difference is seen with the German Bundesliga,
where it shows up mostly with defensive events, crosses and potentially dribbles.

As a result, there are in some cases discrepancies in the volumes of events between leagues. The Bundesliga for example has a great
deal more interceptions than the other two due to how they are collected. These specs have also changed in recent seasons, leading to
fewer events in some areas. Where these variations exist they will be noted in the relevant sections of the report.

                                                            Differences in data collection can falsely identify trends and areas
                                                                   which may have suffered here have been noted in the text
Goals, Expected Goals (xG) and Shots
Analysing Goals and Shots

This first section examines how the three different
leagues profile in terms of goals and shots.

First are the base questions: how many goals are scored
in each league from season to season? How many shots
are registered in the average game?

Beyond that, these questions be further broken down to
see exactly how teams in these leagues are creating
these goals and shots. Where are these shots being
taken from? Do they diverge from each other in terms of
how much emphasis they put on open play vs set
pieces?

Differing environments will necessitate different
approaches, yet we also expect to see many similarities.
Goal Volumes and Expected Goals (xG)

All three leagues have seen a steady, if not 100% consistent rise in their goals per game, with the Danish Superliga and English Premier
League being quite close throughout. The German Bundesliga, however, has been a goals powerhouse from the start and is on pace for
something boundary breaking in the current season. These trends are also seen in the expected goals numbers, as one would imagine.
With the exception of a large dip this season in Denmark - likely just an aberration - teams are creating more in general. Once again the
German teams produce a much more chance-rich brand of football.

                                                                     All leagues have seen a rise in goal and xG volumes but the
                                                                               Bundesliga stands out as the most action-packed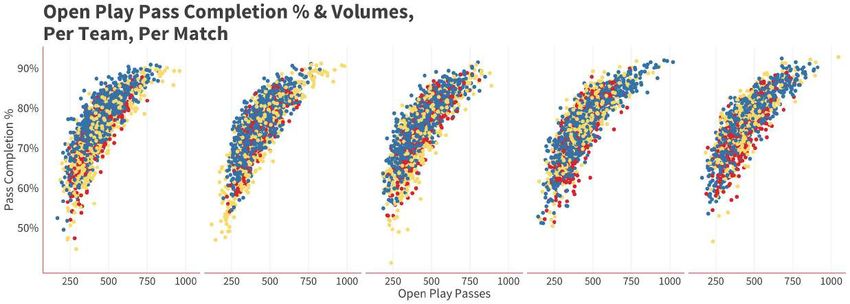
Goals, Team Strength

It’s readily apparent that, in terms of goalscoring, the best teams in all leagues are asserting their dominance even more as the seasons
roll on, while the weaker teams are ostensibly standing still. The disparity between the haves and the have nots is widening. In the
Danish Superliga specifically, the gap is somewhat less pronounced but still clear to see. The sharp rise in the Premier League for the
top teams likely reflects the rapidly growing resources flowing in to dominant clubs.

                                                                            The goalscoring disparity between the strongest and
                                                                                                       weakest teams is growing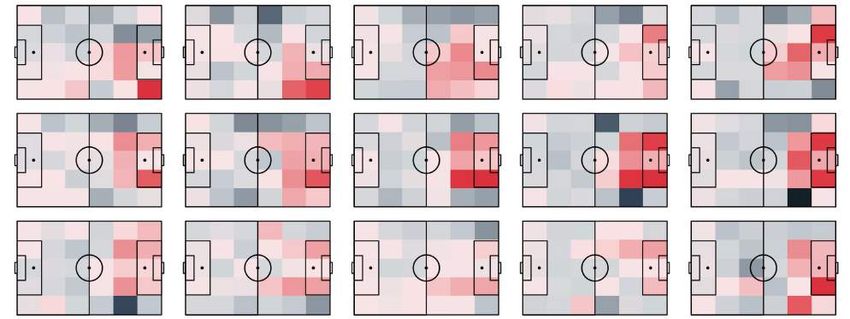
Non-Pen xG, Team Strength

As one would expect, the expected goals trends line up with those of actual goals scored. Again, the stronger teams are running away
with it while the weaker teams stagnate. The Danish Superliga shows that same minorly lessened disparity. It’s also notable how the
attacks of the strongest Danish teams are generally less potent than their English and German counterparts in recent years. However,
this is influenced by the current season which of course is incomplete and could be an outlier on the upward trend.

                                                                         xG also shows a widening gap between differing team
                                                                                                               quality levels
Shot Volumes
It has been an observed long term trend for some years
now - going back before the scope of this report - that the
number of shots taken has been declining across many
leagues. This is true of the three examined here. If this
were extended back to, say, the 2011/12 season, the
change would be even more stark.
Here we see this in the first few years before fluctuations in
recent seasons, although again this could be an exception.
In 2016/2017 and the following season the Danish
Superliga took a sharp jump in its shot volume not
reflected in the other leagues. Given that the current
season is thus far shaping up to be more in line with the
overall picture it’s fair to assume these two seasons are the
outliers and not representative. However, we would need
to know what will happen next season, at least, in order to
be certain in this respect.
Longer term decline in shots volumes have been interrupted in recent
seasons in both Denmark and GermanyShot Volumes, Team Strength
The overall drop in shot volumes is still there when split out by team quality. Interestingly, the stronger teams in the Danish Superliga
and the English Premier League upped their shots a few years ago before dropping down again from that point in line with the wider
trend. Perhaps a sign of their rising dominance over the weaker teams conflicting with the general downward trend in shots. The
weaker teams, meanwhile, have followed a slightly similar story in Denmark but to a much lesser degree.
Shot volumes for strong and weak teams generally fall in line
with the overall downwards trend, with some fluctuationsOpen Play v Set Pieces, Goal Volumes
In Open Play there is little to separate the three leagues in terms of goals scored. Again the Bundesliga shows its edge in terms of
volume and the long term movement is still upwards everywhere, yet otherwise it’s all quite close. Where a real difference is seen is on
set pieces. In three out of the five seasons the Danish league produced far more set piece goals than either of the others, reaching a
peak in 2017/18. This is despite, as noted earlier, the Superliga averaging the same amount of set piece situations as the PL and far
fewer than the Bundesliga. Danish teams are clearly just more effective from set pieces.
The Danish Superliga sees a significantly higher volume of set
piece goals than the other two leaguesOpen Play vs Set Pieces, Shot Volumes
By separating shot volume into Open Play and Set Pieces it becomes clear that Denmark’s rise in shots for 2016/17 and 2017/2018 was a
two-pronged scenario. Both types of shot saw a noticeable uptick before, again, both coming down to earth in 2018/2019. It was not a
case of one facet of the game doing the heavy lifting. What stands out otherwise is the Bundesliga being far and above its peers in terms
of Set Piece shots. This is because teams in that league get more set piece opportunities in general - Bundesliga games averaged 40.2
set pieces (throw-ins excluded) over this timespan, compared to 35.7 for the Danish Superliga and 34.6 for the Premier League.
In the early seasons studied, the Bundesliga saw considerably more shots from set pieces than the
the Danish Superliga or Premier League but this difference has declined over timeOpen Play Shot Locations
2014/2015 2015/2016 2016/2017 2017/2018 2018/2019
Now we can see how the distribution of those shots has changed and the picture is clear: teams are cutting down on shots from long range.
The Danish Superliga, English Premier League and German Bundesliga have each seen a drop of 5.2%, 5.4% and 4.9% respectively in terms
of shots from outside the box. Conversely, the shots closer to goal for all leagues have gone up in accordance with that. This could be
reflective of the effect that analytics is having on the sport, or at least an embracing of the same core principles. Long shots are not entirely
without use, but it stands to reason that some of them could be shaved off in favour of more attempts at create value shots closer to goal.
Long shots have declined over the last five seasons in all three leaguesShot Locations, Team Strength
The shot locations of the stronger and weaker teams paints an intriguing picture. The trend with the stronger teams is immediately
clear: they are consistently taking a higher share of their (lowering in volume) shots within the box, closer to goal. The weaker teams, on
the other hand, are following this to a much lesser degree. The exception is in Denmark, where the weaker teams are actually getting
close to those above them. Another sign of a reduced stylistic disparity in the Superliga.
Danish teams of inverse quality are taking a relatively similar
proportion of their shots within the box% of Goals From Set Pieces Bottom Five Team Top Five Team
2014/2015 2015/2016 2016/2017 2017/2018 2018/2019
There are two clear takeaways from the set piece profiles of all three leagues. First is how heavily the teams lower down the leagues rely
on set pieces. This is intuitive as teams with a lower talent level overall are more likely to struggle in open play and need to find other
ways to score. The second is how the top Danish teams favour set pieces more than their English and German counterparts. Clearly the
Superliga has embraced the notion that set pieces are undervalued and provide an edge if trained properly.
Lesser teams focus more heavily on creating
goals from set pieces in all three leaguesThrow In Goals
Another aspect of set pieces in which the Danish
teams plainly stand out is throw ins.
For many within football, throw ins are not
considered a meaningful part of a team’s attacking
profile. In this respect they are underutilised and
likely undertrained across most of Europe’s top
leagues.
The Danish Superliga eschews this, concentrating
just as much on this particular avenue of attack as it
does with other forms of set piece. Every season bar
one it has ranked well above its counterparts for
throw in goals per game. In 2017/2018, AC Horsens
even managed a staggering nine goals from throw
ins. 22% of their overall goals scored. This is yet
another way in which Danish sides are separating
themselves from the pack using set pieces.
Danish teams consistently create more goals
from throw insDirect Free Kicks Pass Shot
2014/2015 2015/2016 2016/2017 2017/2018 2018/2019
Direct free kicks are another example of Denmark’s unique set piece identity. From 2015/2016 forward, Danish teams have elected to
shoot much more often than their English and German peers. As a result, three of the top five seasons in this dataset for direct free kick
goals per game have come from the Superliga (and five of the top eight). Despite this proclivity, Danish teams are also much more
efficient from direct free kicks - 8% of their direct free kick shots result in goals, as opposed to 6% and 5.7% for the Premier League and
Bundesliga respectively. Clearly a lot of planning is being put into these situations.
Over time, Danish teams have consistently taken and scored more direct free
kicks than their counterparts in the Bundesliga and Premier LeagueOpen Play, Headers & Feet
% Of Open Play Shots From Feet % Of Open Play Shots From Headers
Across the dataset there has been a drop in shots taken with a player’s feet and a concurrent rise in headed shots. This change isn’t
collosal but, given what we know about the overall change in shot locations, it is natural. Teams eschewing shots from outside the box
and leaning more towards shots within the box is always going to favour headers considering they are a much more viable option closer
to goal.
There are a greater proportion of headers in relation to all
shots over time in all three leaguesGoals - Conversion
In terms of converting shots into goals the Bundesliga
again stands above the others across the long term.
However the Superliga and the Premier League have
been trending upwards, towards the Bundesliga, with
the latter doing so more consistently and the former
seeing fluctuations on the way there.
This is in line with what we already know about the shot
profiles of these leagues. The volume of shots is
dropping in all three, just as the xG (i.e the quality of
those shots themselves) is seeing an uptick, most likely
due to the focus on shots closer to goal. Fewer shots but
of a higher quality will of course naturally lead to a
higher conversion rate, which again is reflected in the
increase in goals per game. Another minor point is that
the dip for the Superliga in 2016/2017 coincided with a
slight drop in percentage of goals from set pieces for the
top teams.
A rise in goal conversion follows a trend foreshadowed by shots
becoming closer to goal over timeGoals - Conversion
Conversion rates follow much the same trends that goals and expected goals did, which is intuitive given what all three are measuring.
The stronger teams, naturally, convert shots into goals with a higher regularity. No doubt down to their superior technical skills and
ability to create a higher quality of shot overall. It is interesting, though, that the weaker teams are seeing little upwards movement in
this regard. Again, reflective of their stagnation in terms of the quality of shot they produce.
The strongest teams are driving the uptick in conversion rateGoals - Time in Match
There is little to separate the leagues in terms of
when the first goal is scored, on average.
The Danish league appears to be marginally more
skewed towards earlier goals than its
counterparts, whereas the Premier League pushes
in the opposite direction. Yet this is a small and
somewhat inconsistent difference. There are no
trends to speak of anywhere.
On average the first goal in each league can be expected between the 20
and 30 minute mark, and that remains consistent throughoutPassing, Possessions & Dribbling
Analysing Passing, Possessions & Dribbling

Now we move on to looking at how the three leagues in
question compare and contrast in their overall
possession philosophies.

It’s fair to expect that differing leagues with a variable
general quality of player between them will display
differing approaches to the game. However there are
also clear observable trends across world football in
terms of how teams play, and an amount of
convergence in styles is natural.

Therefore this section delves into how possessions
across the dataset have changed in their length and
style, the type of passing within those possessions, how
teams create chances and where and to what extent
dribbling is part of a the average player’s skill set.
Open Play Passing
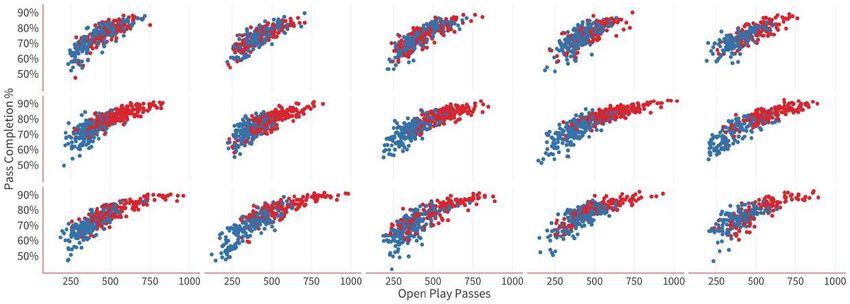
2014/2015 2015/2016 2016/2017 2017/2018 2018/2019
Interestingly, there is little to differentiate all three competitions in terms of how many passes teams attempt and the rate at which they
complete them. The Bundesliga stands out as having more instances of a low completion percentage but even those have been cut out
in recent seasons. Overall there is a bunching towards a consistent higher completion rate with time, while volumes have edged slowly
upwards. This is likely due to the types of passes and possessions, as we will see on the coming pages.
Pass completion and pass volume has increased over time for all three leaguesPassing, Team Strength
2014/2015 2015/2016 2016/2017 2017/2018 2018/2019
Passing volumes and completion show a large point of distinction for the Danish Superliga. In the English Premier League and the
German Bundesliga, the strongest teams consistently play more passes and complete them at a higher rate. A trend which appears to be
even increasing somewhat. The weaker teams in the Bundesliga are also playing more passes in general. The Danish teams, however,
are much more bunched up. Clearly passing styles in the Superliga are homogenous across team quality levels.
The strongest and weakest Danish teams are much closer together in terms of
passing than their counterparts in England and GermanyPass Lengths
As expected, pass lengths have decreased from 2014/2015 to now. Despite this, the Danish league overall is sees longer passes on
average than its two counterparts, with, again, less difference between team strengths. The current season in particular has even gone
up in this regard, but that could just be a one-off. Another intuitive takeaway is how the weaker teams tend to have longer pass lengths
while the stronger teams are the inverse. A pattern that the Danish league eschews somewhat.
While pass lengths have declined in general, Denmark shows different
trends to the other leaguesPossessions
Possession numbers have differing levels of variance across the three leagues but all follow the same trend: fewer possessions per
game as the seasons go on. This is in line with the increasing push towards a possession focused, short passing game that produces
fewer turnovers and less hectic play. This is most apparent in the Bundesliga, a league known for its heavy transitional game, which
previously saw many possessions per game but has slowed down with time.
Each league has shown a decline in the volume
of possessions across the sample studiedBall In Play Time
Ball in play time follows a similar pattern to possessions to some degree, which makes sense given that they are essentially two
different angles from which to examine the same point. Teams, in recent years, are prioritising keeping the ball via a short passing
approach, which will naturally lead to fewer possessions and thus more time with the ball in their control. Again, the stronger teams
seem more capable (or just more willing) of holding onto the ball for long periods.
Ball In play time has, for the most part, increased across the board.
Although Denmark has delayed joining this trend until recentlyPace Towards Goal
‘Pace Towards Goal’ is a measure of attacking speed. It tracks how many metres on the pitch a team covers per second on their
possessions that lead to shots. The higher the number the faster the possession. Despite the overall move towards retaining the ball,
there is still a spread in terms of how quickly teams attack. This is likely down to the variable and highly cyclical nature of attacking
styles in football. Counterattacking comes in and out of fashion as a natural, counterbalancing reaction to possession being prioritised.
The pace at which teams play seems volatile from year to year, despite
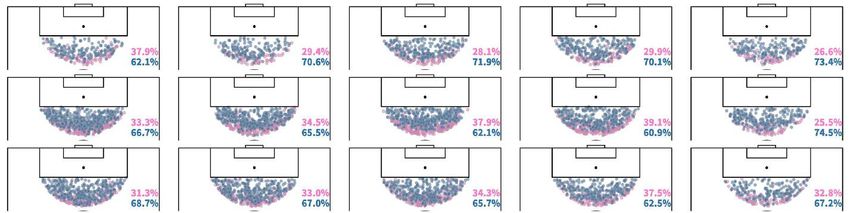
other possession trends.Open Play Key Pass & Assist Locations
2014/2015 2015/2016 2016/2017 2017/2018 2018/2019
Higher Density
Lower Density
This visualization shows the density on the pitch for key passes and assist locations, relative to a given league. For the most part all
three leagues share a similar open play chance creation profile: lots of shots created via passes from central areas, outside the box.
These could range from through balls to simple sideways passes that then lead to a long range attempts. Where Denmark sticks out,
however, is in a greater number coming from wide areas. This is unusual as the Superliga is not a particularly cross-heavy league.
The Danish Superliga appears to favour a wide approach to attacking
more so than the Bundesliga and Premier LeagueKey Pass & Assist Locations, Team Strengths
2014/2015 2015/2016 2016/2017 2017/2018 2018/2019
Top Teams
Create More
Bottom Teams
Create More
This visualization takes the percentage of a top/bottom teams’ chances created that come from each zone, and then compares them to
find differences. It seems that the stronger teams create more in central areas, especially within and just outside the box. Weaker teams
rely more on the wide areas. Likely due to lowered technical ability forcing a more ‘get the ball in the box’ approach. Interestingly, here
again we see that the difference between top and bottom teams in the Superliga is smaller than elsewhere.
Stronger teams create more centrally whereas weaker teams rely on wide
areas, a trend that is somewhat smaller in DenmarkCorners
2014/2015 2015/2016 2016/2017 2017/2018 2018/2019
Corners are another facet of set pieces in which the Superliga stands out. Danish teams aim their corners closer to goal at a much higher
proportion than the Premier League and Bundesliga. More than 10% in most cases. Various examples of research (for example, this
paper on set pieces in the Premier League) have shown that inswinging corners are more effective than outswingers. Danish teams in
general seem to put more thought and training time into set pieces, as exemplified by FC Midtjylland when their work in the area helped
propel them to league titles. Thus it’s only natural that they would favour this type of corner delivery.
Danish teams aim a significantly higher proportion of their corners into
the six yard box than teams in the Bundesliga and Premier LeagueDribbles
2014/2015 2015/2016 2016/2017 2017/2018 2018/2019
Dribbles show a stark contrast between the leagues. The Danish Superliga sees teams attempt far fewer in general and especially higher
up the pitch, although this seems to be changing in recent years. The Premier League and Bundesliga, meanwhile, have seen the
opposite trend, with the latter being an especially dribble heavy league in earlier seasons, especially, naturally, on the wings. This plays
into the idea that the Superliga is a less athletic league than its resource-rich peers. It is worth noting though that this extreme disparity
could be down to inconsistencies between countries in Opta’s data specifications.
With a word of caution for the data definition of a dribble, it is presumed
that dribble volumes have become more similar over timeDribbling, Team Strengths
2014/2015 2015/2016 2016/2017 2017/2018 2018/2019
As one might expect, teams of a higher quality level have a higher share of their dribbles closer to the opposition goal. A natural
consequence of their assumed dominance in any given game, as well as greater technical ability allowing them to complete dribbles in
more congested spaces. Conversely, things are more equal deeper on the pitch, where weaker teams are struggling to get out of their
own half. The Danish Superliga and German Bundesliga show less of a disparity between the top and bottom teams, whereas, once
again, the best teams in the Premier League show up as clearly several levels above.
Top teams dribble more high up the pitch, with a lesser disparity
between teams in DenmarkDefending
Defensive Actions: Relative Frequency By Zones
                  2014/2015           2015/2016          2016/2017           2017/2018           2018/2019

Opta have previously used differing data collection specifications across multiple leagues. The definitions for what constitutes some
types of defensive event was not the same in all countries. In 2017/18 an attempt was made to bring the leagues more in line with each
other, leading to fewer defensive events (especially in the Bundesliga) compared to previous seasons. However we can still gleam some
insights by looking at it on a season by season basis. The Danish Superliga is overall a less defensively aggressive league across the
whole pitch, whereas English teams are active close to their own goal and German teams press much higher up across the board.

                                        Data concerns hamper any longitudinal analysis of defensive events, but we can still
                                                     surmise that Danish teams are less aggressive than their counterparts
Cards Yellow Card Red Card
There is no obvious, consistent difference between the leagues in terms of how many cards the average match sees. It could perhaps be
said that the Danish Superliga is seeing more cards in recent years, with less of an emphasis on red cards in particular. This in contrast
to the Bundesliga which seems comparatively red card-heavy, and the Premier League which has seen fewer cards of late.
The Danish Superliga has seen more cards overall but with fewer red cards in recent
seasons, largely the opposite of the Premier League and BundesligaBottom Five Team Top Five Team All Teams
Fouls v Cards
The first takeaway when looking at fouls is an intuitive one: teams lower down the league foul as much or more than both the league
average and teams further up the league. The Danish league, however, bucks this somewhat, seeing the the two types of teams being
closer in most seasons. The second takeaway is that the Superliga and Premier League are less foul heavy than the Bundesliga. It seems
referees in these leagues are more reticent to blow up than their German peers.
Teams at the bottom of the league foul more than those at the top, although teams in the
Danish Superliga eschew this trend somewhatFormations
Formations

                        The use of four-at-the-back formations vs the
                        three-at-the-back has taken an interesting turn across
                        European leagues in recent years.

                        In earlier decades - particularly pre 2000s - a three centre
                        back setup was commonplace, especially on the
                        international stage. Gradually though, it was phased out in
                        favour of a much heavier focus on two centre backs with
                        two fullbacks and wingers ahead of them. The 4-4-2, then
                        latterly the 4-3-3 and 4-2-3-1 became the standard choice.

                        As with many trends in football, this has now started to
                        loop around again. In large part due to centre backs
                        becoming more comfortable as passers. Many teams
                        across these leagues, regardless of strength, are
                        experimenting with three defenders regularly. The Danish
                        League is no different. It has been slower to change but
                        nonetheless is now right in line the others.

             A fashion for three-at-the-back formations has been resurgent in
                     recent seasons and Denmark has followed that trend too
Age Analysis
Outright Ages
                                          Two things immediately stand out when
                                          examining the distribution of player ages.

                                          First is how the Premier League is an older league
                                          in general than the Danish and German ones, the
                                          former of which has a much wider spread of ages.
                                          This makes sense as the Premier League’s vast
                                          resources will naturally lead to teams there
                                          spending on proven players in their prime or
                                          cresting out of it. Danish teams meanwhile will be
                                          content to bed in younger players with an eye to
                                          perhaps selling them on later as they improve.

                                          Second is how all three leagues seem to be
                                          trending more towards younger players over the
                                          last couple of years. This is especially prevalent in
                                          the Bundesliga but is also present in the
                                          Superliga, where 2018/2019 has thus far seen
                                          more young players than any other amongst this
                                          dataset.

                On average the Premier League has older players than the Superliga and
                        Bundesliga, but there is a recent trend towards younger players
Outright Ages, Successful & Unsuccessful Teams
It’s clear from digging into the data that the
stronger teams skew towards a wider, more
youthful age makeup than their weaker
counterparts.
Teams fighting near the bottom of the league
may be hesitant to rely on younger players.
Instead feeling that ‘experience’ is needed in
their situation. It also could simply be true that
packing your squad with older players is not a
good strategy for success.
Title challenging teams, however, generally
seem to have a more varied mix in their age
profile. They are often built around players in
their prime years, with a few veterans in key
positions and a few young players being bedded
in.
A trend where better teams empower more younger
players is apparent in all three leaguesPositional Ages
For the most part, all of the trends that apply to the ages of the leagues in aggregate still apply when looked at on a positional level. One
thing that does stick out however is how young goalkeepers and defenders in the Danish League can skew at times, especially this
current season. These are positions that are generally filled with the oldest players on the pitch. Goalkeepers in particular are often still
starting for top clubs well into their 30s, and defenders only seem to gain more appreciation as they age and the perception turns to
them being ‘experienced’. That Danish clubs are trying out younger players in these spots suggests a certain progressiveness.
There is a small trend towards younger defenders and
goalkeepers within the Danish SuperligaShot takers, by Age
Here we can see the density of shot-takers across the
age distribution for each league season.
This is another regard in which the Danish league’s
relative greater disposition towards younger players
shines through. Season after season the league has a
higher concentration of younger attackers operating as
focal points, whereas the Premier League skews more
towards late-peak ages and the Bundesliga straddles
somewhere between the two.
Again, we can see this as an indication of Danish teams
operating under more of a development philosophy.
Giving more of an opportunity to younger, likely less
expensive players with the aim to develop them and
create surplus value, instead of always going for the
older players.
Shot takers trend younger in the Danish Superliga
than in the Bundesliga or Premier LeaguePhases
Analysing Game Phases

This section will compare the three leagues in question
based on ‘game phases’, a way of looking at matches in
a time-based manner.

Each match has been split up into 15 minute increments
from 0 - 90 minutes, excluding any added extra time in
both halves. Then, we look at various metrics within
each of those 15 minute chunks.

The purpose of this endeavour is to see how the stylistic
tendencies of the respective leagues ebb and flow over
the course of a match. Do teams do more or less of
something as a game goes on? Can we see any signs of
fatigue in the data? And how do these aspects differ (if
they do at all)) between Danish, English and German
football?
Defensive Activity

Most seasons have a similar, if not particularly strong ebb and flow: the beginnings and ends of halves see teams registering more
defensive actions, with dips in the middle. This can be read as teams starting on ‘the front foot’, putting their opponents under pressure
before easing off as the half wears on and then ramping the intensity back up towards the end when chasing a result. Alternatively,
teams may be defending a result at the end of a game, registering more actions to keep their opponents away from their goal.

                                    Teams start halves defending more intensely, easing off as it goes on and then becoming
                                                                        more aggressive again towards the end of matches
Shots
The general trend for this dataset is that teams shoot more as the match progresses. This makes sense in many respects. There are
various possible ways in which the dynamics within a match change with time that may lead to this. Teams become desperate to grab a
goal as time runs out or fatigue leads to tired defenders and more space opening up. The Danish Superliga differs marginally in the
respect that we see a slight downwards trend in the middle of second halves. Possibly reflective of that league’s particular flow of pace.
All the leagues shoot more as the match progresses, with the Danish league seeing a
slight dip in the middle of second halvesConclusions
Conclusions (1)
The Danish Superliga has followed a similar trajectory to the English Premier League and German Bundesliga in many ways. This isn’t a huge
surprise. It is a well-worn aspect of the sport that trends emerge in a small pocket somewhere and soon spread their way across the footballing
world, despite the disparities between leagues in terms of size and resources. Teams and even national federations naturally observe what strategies
are successful elsewhere and begin to emulate them.

This doesn’t mean the leagues are identical, however. The Danish teams do display clearly divergent approaches in some areas. Some of these can be
attributed to the smaller nature of the league, fewer resources pushing them to exploit different areas of the game in a way other leagues do not. The
key differences and similarities are summarised herein:

    Goals & Shots (Open Play)                                                    Goals & Shots (Set Pieces)

       ●    Goals and xG per game have been increasing over time                    ●     The Danish Superliga produces more set piece goals per
            across all leagues.                                                           game than its counterparts and has been trending upwards
       ●    Shot Volume has been decreasing over time, although the                 ●     Danish teams generally create a similar amount of set piece
            Danish League has had outlier seasons with increases                          shots as the other two leagues, although the Bundesliga
       ●    The disparity between stronger and weaker teams in                            started off with greater volume in earlier years
            Denmark is smaller than in other leagues                                ●     Teams lower down all of the leagues rely heavily on set
       ●    A lower percentage of shots are being taken from outside                      piece goals, while the top Danish teams focus on them more
            the box as time wears on                                                      than their equivalents in England and Germany
       ●    There has been a drop in the percentage of shots taken with             ●     Danish teams generate far more goals from throw ins
            feet and a concurrent rise for headers. Likely linked to the            ●     Danish teams shoot and score more often from direct free
            higher share of shots inside the box                                          kicks
Conclusions (2)
Passing, Possession and Dribbling Defending
● The volume of passes and their completion rate has ● Defensive activity levels for all three leagues have come
increased over time for all three leagues much closer in line with each other over time, although
● The number of possessions per game has decreased again this could be due to the countries’ respective data
● The average pass length has declined, although the Danish specifications changing to match one another
league is currently seeing an increase this season ● The Danish league has seen a rise in overall cards combined
● Ball in play time has increased with a slight dip in red cards, while the other two leagues
● Danish teams create more shots via passes from wide areas have seen the opposite trend
● Danish teams aim a greater number of their corners close ● The Danish Superliga and English Premier League are
towards the opposition goal, likely via inswingers refereed in a much less strict manner than the German
● Dribble volumes have become similar over time between Bundesliga. Teams lower down all leagues foul more than
the leagues, although this could be due to data differences the average but the Danish teams see less of a spread in this
respect
Age Other areas
● Danish teams are younger on average than English teams
and more in line with German teams ● Formations: three centre back formations are becoming
● Better teams generally give more opportunities to younger more popular across all leagues
players ● Phases: teams generally start halves with defensive
● Goalkeepers and defenders are somewhat younger in the intensity, cool off and then increase again towards the end.
Superliga Shooting also trends upwards as matches go onAny questions, please contact us Ted Knutson ted@statsbomb.com Euan Dewar euan.dewar@statsbomb.com
You can also read