RISK ESTIMATION OF SARS-COV-2 TRANSMISSION FROM BLUETOOTH LOW ENERGY MEASUREMENTS
←
→
Page content transcription
If your browser does not render page correctly, please read the page content below
Risk Estimation of SARS-CoV-2 Transmission from Bluetooth
                  Low Energy Measurements
                 Felix Sattler† , Jackie Ma† , Patrick Wagner‡ ,
              David Neumann† , Markus Wenzel† , Ralf Schäfer† ,
      Wojciech Samek†⇤ , Klaus-Robert Müller‡§]⇤ , and Thomas Wiegand†‡⇤
                †
               Fraunhofer Heinrich Hertz Institute, 10587 Berlin, Germany
                  ‡
                    Technische Universität Berlin, 10587 Berlin, Germany
    §
      Department of Brain and Cognitive Engineering, Korea University, Seoul, Korea
           ]
             Max Planck Institute for Informatics, 66123 Saarbrücken, Germany
      {wojciech.samek, thomas.wiegand}@hhi.fraunhofer.de, klaus-robert.mueller@tu-berlin.de

                    Abstract                        e. V., 2018, Singapore Government Technol-
                                                    ogy Agency and Ministry of Health, 2020,
   Digital contact tracing approaches
                                                    Chen et al., 2018].         Recently, the Pan-
   based on Bluetooth low energy (BLE)
                                                    European Privacy-Preserving Proximity Trac-
   have the potential to efficiently contain
                                                    ing (see [PEPP-PT]) and Decentralized Pri-
   and delay outbreaks of infectious dis-
                                                    vacy Preserving Proximity Tracing (see [DP-
   eases such as the ongoing SARS-CoV-
                                                    3T]) initiatives were launched, both promis-
   2 pandemic. In this work we propose a
                                                    ing to enable proximity tracing in compli-
   novel machine learning based approach
                                                    ance with the European general data protec-
   to reliably detect subjects that have
                                                    tion regulation (GDPR) [Voigt and Von dem
   spent enough time in close proximity to
                                                    Bussche, 2017]. Since a large percentage of
   be at risk of being infected. Our study
                                                    the world’s population carries smartphones,
   is an important proof of concept that
                                                    these approaches make use of the BLE technol-
   will aid the battery of epidemiological
                                                    ogy. Contact advertisements regularly emitted
   policies aiming to slow down the rapid
                                                    from these devices are used to assess the prox-
   spread of COVID-19.
                                                    imity of encounters. For e↵ectively contain-
   Contact tracing is an e↵ective instrument to     ing the current SARS-CoV-2 pandemic, it is
contain and delay outbreaks of infectious dis-      necessary to reliably translate the BLE signal
eases such as the ongoing SARS-CoV-2 pan-           strength measurements into risk estimates of
demic. Individuals that have been in con-           infection transmission. In this letter, we pro-
tact with an infected person are identified,        pose a novel approach for this conversion task.
asked to remain in quarantine and are being            Figure 1A illustrates a typical infection sce-
tested. However, manually following contact         nario, which is difficult to manage with manual
histories is labor-intensive, slow and incom-       contact tracing procedures. Here, an infected
plete, as chance encounters, e.g. in the public     person enters a public place (e.g. a supermar-
transport, can not be fully reconstructed. The      ket) and spends an extended amount of time in
emergence of digital solutions, which automat-      close proximity (< 2m) to the contact person.
ically reconstruct the duration and proximity       Both factors, namely the contact distance and
of encounters, is highly promising to enhance       the contact duration, influence the risk for the
established manual procedures with speed, ef-       contact person of being infected.
ficiency, precision and full coverage of relevant      Proximity tracing technologies allow to re-
contact history. Ultimately, such proximity         construct such high risk encounters between
tracing technologies have the potential to “re-     the infected and contact person, once the for-
duce transmission enough to achieve R0 < 1          mer has been tested positive. The infected
and sustained epidemic suppression, stopping        person is recording anonymous IDs of con-
the virus from spreading further” [Ferretti         tact persons within certain critical distance
et al., 2020].                                      range. These anonymous proximity histories
   Various concepts for proximity tracing have      are encrypted and remain on the phone of the
been proposed in the past [e.g. Salathé            infected person at all times. Only if tested
et al., 2010, Yoneki, 2011, Freunde Liberias,       positive and upon agreement, the proximity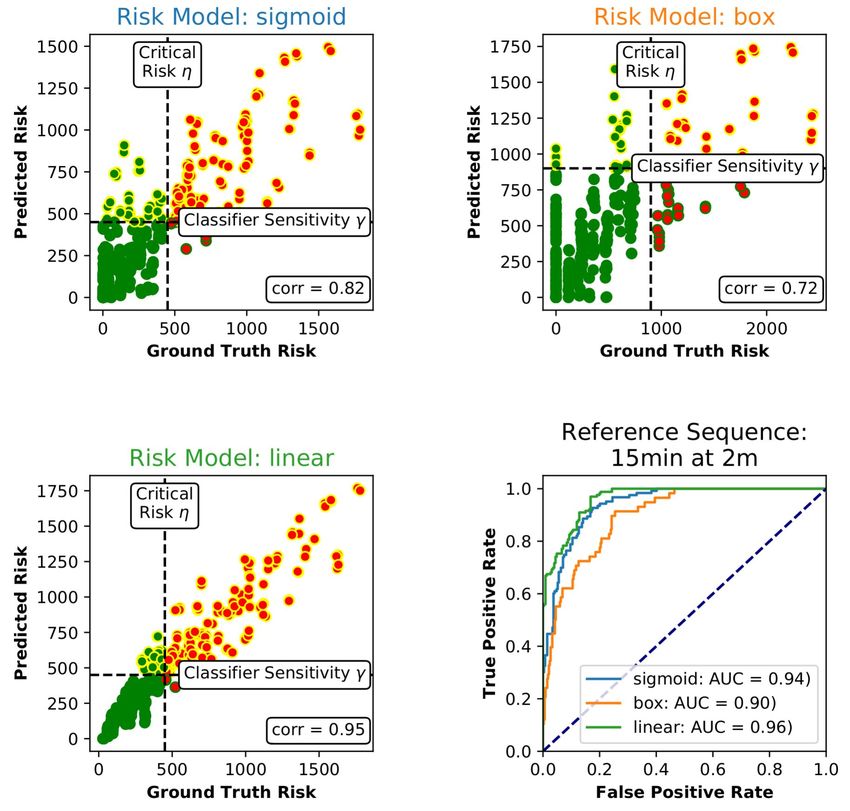
history is analyzed and contact persons with                     ally based on the basic reproduction rate2
a high risk of being infected can be alerted                     R0 .
anonymously. In addition, health authorities
can be involved to handle these high risk cases             3. Train a machine learning (ML)
by standard procedures (e.g., test and quaran-                 model to estimate the infection risk.
tine the contact persons).                                     We train a linear regression model to pre-
                                                               dict the infection risk score from the mea-
Methods:                                                       sured received signal strength (RSS) time
   To make this approach practically applica-                  series of the BLE signal. For simplicity,
ble, i.e., to avoid that every short time or dis-              we do not provide the raw RSS time series
tant encounter raises an alarm, it is crucial to               to the ML model, but compute features
reliably estimate the risk of infection transmis-              (sum, mean, max etc.) on it and provide
sion from the BLE signal strength measure-                     this aggregated information to the model.
ments. In this letter we propose to perform                    By thresholding , the output of the clas-
this conversion in the following manner:                       sifier, we can trade-o↵ the obtained true
                                                               and false positive rates. Figure 1D illus-
  1. Define an epidemiological model to
                                                               trates the entire training and evaluation
     convert proximity time series to in-
                                                               pipeline, including ground truth risk esti-
     fection risk scores. The models E dis-
                                                               mation, feature extraction and training of
     played in Figure 1B implement di↵erent
                                                               the linear regression model.
     non-linear functions to translate time se-
     ries of proximity values into infection risk
                                                             Figure 1C displays the time series of raw
     scores. For infections transmitted via the
                                                          RSS values from the BLE signal, which the
     droplet route, one usually assumes that
                                                          smartphone of the infected person receives
     the infection risk decreases as the distance
                                                          from the smartphone of the contact person.
     dt between people increases; with some
                                                          Although the values are noisy, it is possible
     critical distance from which on the risk
                                                          to reliably decide whether or not the infection
     of being infected becomes vanishingly low
                                                          risk I exceeds a certain threshold, as shown in
     [Xie et al., 2007].
                                                          our real-world experiments performed with 48
  2. Use the epidemiological model for                    participants (see supplementary materials for
     data labeling. The chosen epidemiolog-               the details on the experimental setup).
     ical model is then used to label the data               Figure 1E, compares the ground truth risk,
     needed to train the ML-based infection               as computed from the time series of ground
     risk predictor. For that, one integrates             truth distances, with the predicted risk, es-
     the marginal infection risk within the crit-         timated from the Bluetooth signal strength
     ical distance over the contact duration T            data, for 392 contact episodes from a hold-
     to obtain an infection risk score                    out validation set. As we can see, our machine
                                                          learning based approach, is able to achieve cor-
                          T
                          X                               relation numbers of up to 0.95 for the linear
                     I=          E(dt ).                  infection risk model. We compute the criti-
                           t=1
                                                          cal risk threshold ⌘ by inserting the reference
       An encounter between two individuals is            sequence dref , with
       considered as “high risk” if the value of I
       exceeds a predefined critical risk thresh-                  dref
                                                                    t   ⌘ 200cm and T ref = 900s             (1)
       old ⌘. This threshold can either be set
                                                          into the di↵erent risk models.       By vary-
       locally, i.e., for each encounter1 , or glob-
                                                          ing the classifier sensitivity , we can trade-
   1
    For COVID-19 it is assumed that a physical prox-      o↵ the number of correct and false alarms.
imity between two people of less than 2 meters over a
                                                             2
time period of 900 seconds (15 minutes) results in a           The R0 value tells us the expected number of cases
high risk of being infected [European Centre for Dis-     directly generated by one case. A globally set critical
ease Prevention and Control, 2020]. When setting ⌘        risk ⌘, would label the data such that the number of
locally, one would use these parameters to determine if   “high risk” encounters would match the expected num-
an encounter is labelled as “high risk” or not.           ber of cases.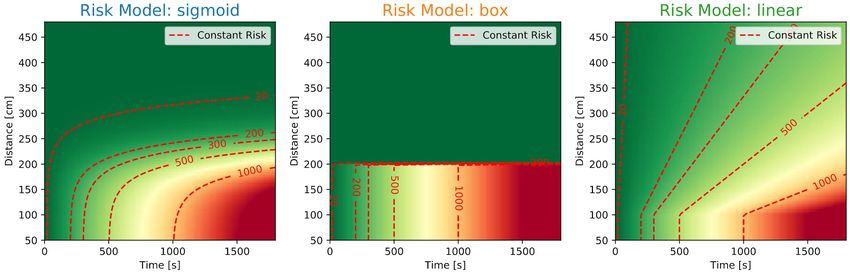
A                              B

                110cm
        270cm
                        350cm

                            Time

    C                              D
                                       Risk Model

                                                                                         Fi
                                                                                           t

                                                                                                     Predict

                                        Feature                                                   Linear
                                       Extraction                                               Regression

    E                                               F

                                                                     C
                                                                         lo
                                                                           se
                                                                                st
                                                                                     M
                                                                                         at
                                                                                           ch

Figure 1: Overview of the proximity tracing concept and results. A: Typical infection scenario
in a public space (e.g. a supermarket), where close contact (< 2m) between an infected and a
contact person is established over a long enough period of time. B: An epidemiological model
translates a time series of contact distances into infectiousness scores, which are then used to
label the encounters in the training dataset. C: Example of a raw RSS time series of the
BLE signal, as well a corresponding contact distances. D: We train a linear regression model
to predict the infectiousness scores obtained from a given risk model. The linear regression
receives as input a list of features, which were derived from the raw rss data. E: The predictions
of the linear regression model correlate strongly with the ground truth risk (up to 0.95 for the
linear risk model). For a fixed critical risk threshold ⌘ the approach achieves high true positive
rates with very few false classifications. F: To this day only little is known about spreading
behaviour of SARS-Cov-2. In this work, we calibrated our epidemiological models according
to the latest recommendations of epidemiologists [European Centre for Disease Prevention and
Control, 2020]. After large-scale deployment of proximity tracing technologies, it will be possible
to compare the predicted infection events with the actually measured ones. This may help to
refine epidemiological models.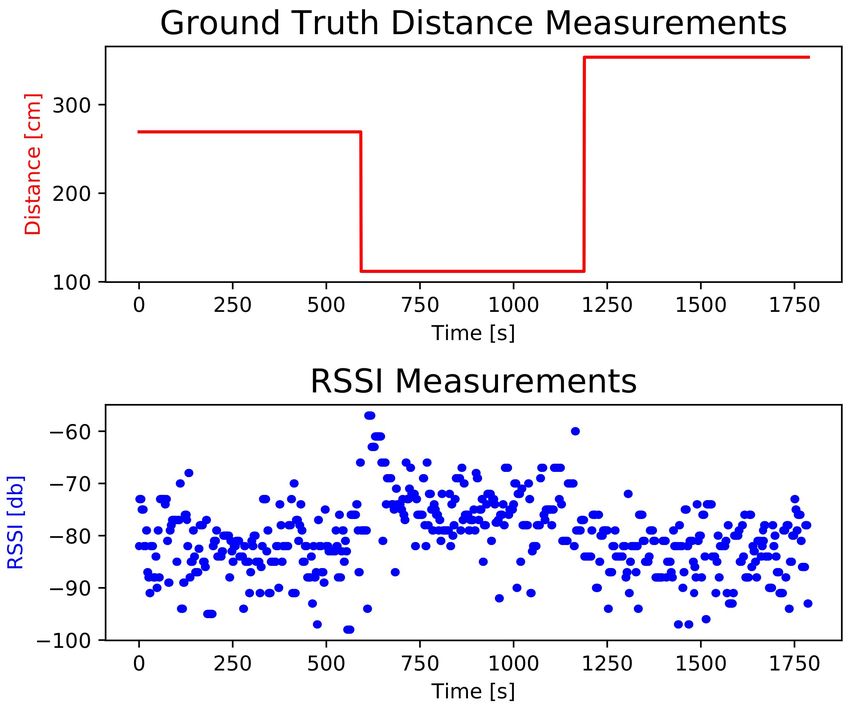
The resulting receiver operating characteris- In this letter we have proposed a novel ap-
tic (ROC) curve of the real-world experiment proach to reliably detect subjects that have
displayed in Figure 1E shows that high true spent enough time in close proximity to be
positive rates can be achieved with relatively at risk of being infected. Thus our study is
few false classifications. Note that these ROC an important proof of concept that will aid
curves depend on the data labeling procedure, the battery of epidemiological policies aiming
i.e., the epidemiological model and the thresh- to slow down the rapid spread of COVID-19.
old ⌘. Here we used the assumed parameters Note that while we have assumed the stan-
for COVID-19, namely distance < 2 m and dard modeling of viral spread with the cur-
exposure time > 15 min [European Centre for rently agreed on parameters (distance < 2
Disease Prevention and Control, 2020]. We m and exposure time > 15 min, see [Euro-
provide mean and maximum RSS value as well pean Centre for Disease Prevention and Con-
as the number of received Bluetooth beacons trol, 2020]), it may in fact be conceivable that
as features to the linear regression model; re- these parameters are not chosen conservatively
sults with other features derived from the RSS enough in the light of recent results on conta-
time series can be found in the supplementary gious droplet spreading across larger distances
materials. The AUC (area under the ROC rsp. in aerosols (see e.g. [Bourouiba, 2020])
curve) value of the predictor is found to be and moreover the improved binding affinity of
larger than 0.9 for all investigated epidemio- SARS-CoV-2 [Wrapp et al., 2020]. Clearly,
logical models. For the linear model AUCs once proximity tracing technologies will be
of up to 0.96 were obtained. The prediction rolled out for the broad population, then data
task becomes slightly more difficult for the box transmission events will become available that
and sigmoid models, which assign only negli- will provide evidence for the true epidemiologi-
gible risk to encounters above a certain dis- cal modeling assumptions. With that we could
tance. The repetition of this analysis on data find out whether the current risk assessment is
recorded on another day led to very similar conservative enough or whether indeed social
performance results, demonstrating the relia- distancing would need to be increased further.
bility of the proposed approach (see supple-
Data Availability: The data that support
mentary materials).
the findings of this study are available from
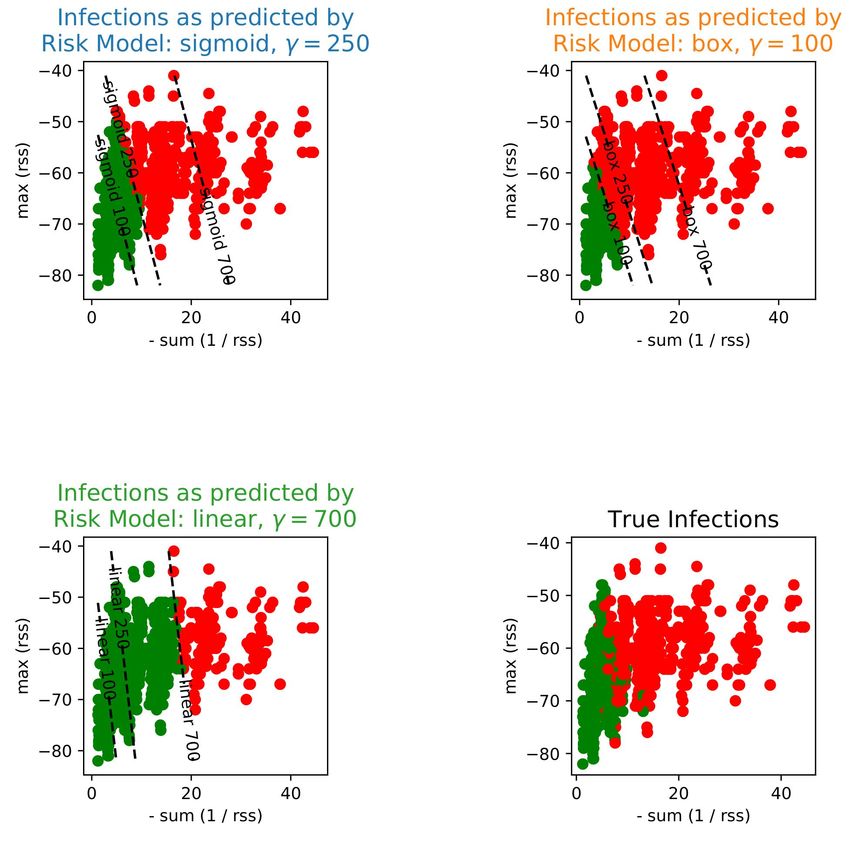
Figure 1F displays RSS sequence data3
the corresponding author upon request.
along with the classification decisions of lin-
ear classifiers, which were trained to match Competing Interests: The authors declare
the predictions of three di↵erent epidemio- that there are no competing interests.
logical models. These classification decisions Author Contributions: F.S., P.W., and
also depend on the corresponding thresholds T.W. conceived the idea. J.M. and R.S. con-
⌘. Clearly, once proximity tracing technolo- tributed the experimetal data. F.S., P.W., and
gies will be rolled out for the broad popula- D.N. analysed the data. F.S., M.W., W.S.,
tion, the true infection events will be observed K.R.M. and T.W. wrote the paper and drafted
(given data donations and consent of all users the article or revised it critically for impor-
involved). Comparing the observed infections tant intellectual content; Supervision of the
with the predicted ones4 will provide evidence project: W.S., K.R.M., and T.W. All authors
for the true (and currently unknown) epidemi- reviewed the manuscript.
ological modeling assumptions.
3
Acknowledgement. This work was sup-
Every RSS sequence is represented as a dot. Dis-
played are only two features of every RSS sequence,
ported by the German Ministry for Education
the maximum and the sum of the negative inverse RSS and Research as BIFOLD - Berlin Institute
values. for the Foundations of Learning and Data (ref.
4
Of course one could directly compare the risk
scores derived from the epidemiological model with 01IS18025A and ref. 01IS18037A). KRM also
the observed infection events. However, to obtain the received support from the Institute for Infor-
scores from the epidemiological model, one need prox- mation & Communications Technology Pro-
imity data which are unavailable in practice. The pro-
posed approach is scalable, because it directly esti- motion and funded by the Korea government
mates the risk from RSS values. (MSIT) (No. 2017-0-00451, No. 2017-0-01779).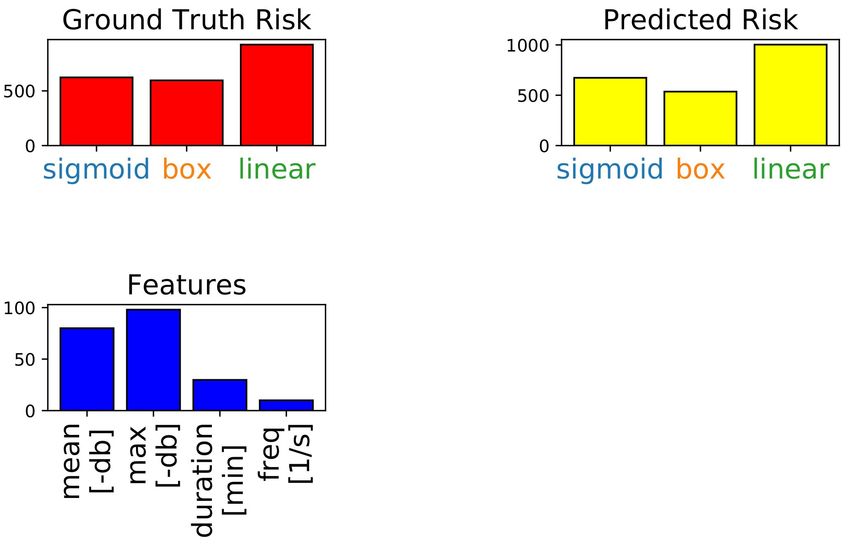
Correspondence to WS, KRM, TW.                        Eiko Yoneki. Fluphone study: Virtual disease
                                                        spread using haggle. In Proceedings of the 6th
                                                        ACM Workshop on Challenged Networks, pages
References                                              65–66, 2011.

Lydia Bourouiba. Turbulent Gas Clouds and Res-
  piratory Pathogen Emissions: Potential Impli-
  cations for Reducing Transmission of COVID-
  19. JAMA, 03 2020. ISSN 0098-7484. doi:
  10.1001/jama.2020.4756. URL https://doi.
  org/10.1001/jama.2020.4756.

Hechang Chen, Bo Yang, Hongbin Pei, and Jim-
  ing Liu. Next generation technology for epi-
  demic prevention and control: Data-driven con-
  tact tracking. IEEE Access, 7:2633–2642, 2018.

DP-3T. https://github.com/DP-3T/documents.

European Centre for Disease Prevention and Con-
  trol. Contact tracing: public health manage-
  ment of persons, including healthcare workers,
  having had contact with covid-19 cases in the
  european union – second update, 2020.

Luca Ferretti, Chris Wymant, Michelle Kendall,
  Lele Zhao, Anel Nurtay, Lucie Abeler-
  Dörner, Michael Parker, David G Bonsall,
  and Christophe Fraser. Quantifying SARS-
  CoV-2 transmission suggests epidemic control
  with digital contact tracing. Science, 2020. doi:
  TBA. URL TBA.

Freunde Liberias, e. V. EBOLAPP. https://
  www.ebolapp.org/, 2018.

PEPP-PT. https://www.pepp-pt.org.

Marcel Salathé, Maria Kazandjieva, Jung Woo
 Lee, Philip Levis, Marcus W Feldman, and
 James H Jones. A high-resolution human con-
 tact network for infectious disease transmission.
 Proceedings of the National Academy of Sci-
 ences, 107(51):22020–22025, 2010.

Singapore Government Technology Agency and
  Ministry of Health. TraceTogether. https:
  //www.tracetogether.gov.sg/, 2020.

Paul Voigt and Axel Von dem Bussche. The eu
  general data protection regulation (gdpr). A
  Practical Guide, 1st Ed., Cham: Springer In-
  ternational Publishing, 2017.

Daniel Wrapp, Nianshuang Wang, Kizzmekia S
  Corbett, Jory A Goldsmith, Ching-Lin Hsieh,
  Olubukola Abiona, Barney S Graham, and Ja-
  son S McLellan. Cryo-em structure of the 2019-
  ncov spike in the prefusion conformation. Sci-
  ence, 367(6483):1260–1263, 2020.

X Xie, Y Li, AT Chwang, PL Ho, and
 WH Seto. How far droplets can move in indoor
 environments–revisiting the wells evaporation-
 falling curve. Indoor air, 17(3):211–225, 2007.
A Supplementary Material
A.1 Epidemiological Models
In our experiments we use three di↵erent epidemiological models to convert the proximity values
into infectiousness scores
(
1 if d[cm] < 100
Elinear (d) = 100 (2)
d[cm] else
(
if d[cm] 200
1
Ebox (d) = (3)
0
else
✓ ✓ ◆◆ 1
d[cm] 200
Esigmoid (d) = 1 + exp , (4)
30
where d is the contact distance measured in cm. All three models are monotonically decreasing
functions of the distance and the infectiousness score decreases with increasing distance.
The main use of epidemiological models in our experiments is to generate ground truth labels
for our data, which consists of a time series of RSS values and corresponding distances (the
latter is not available in real settings). To generate the labels, we integrate the infectiousness
scores over the contact time according to the equation
T
X
I(d1 , .., dT ) = E(dt ). (5)
t=1
A.1.1 Local and Global Risk Thresholds
For every epidemiological model E there exists a reference, from which on no infection is ex-
pected. For instance, for COVID-19 it is assumed that a physical proximity between two people
of less than 2 meters over a time period of 900 seconds (15 minutes) results in a high risk of being
infected [European Centre for Disease Prevention and Control, 2020]. Inserting the reference
sequence dref , with
dref
t ⌘ 200cm and T ref = 900s (6)
into equation (5) results in a local threshold
ref
TX
⌘ = I(d ref
)= E(dref
t ) (7)
t=1
By selecting the epidemiological model and the infectiousness threshold we can determine,
which time series of distance measurements should be considered dangerous and which should
not: (
T rue if I(d1 , .., dT ) > ⌘
HighRisk(d1 , .., dT ) = (8)
F alse if I(d1 , .., dT ) ⌘
An alternative approach is to label the data with a global threshold. For that we need to
have an estimate of the expected number of newly infected contact persons Nnew from Ninf
previously infected persons. This number can be computed with the basic reproduction number
R0 as
Nnew = R0 Ninf (9)
One can then chose ⌘ in a way so that the number of high risk encounters matches the expected
number of new infections, i.e., X
HighRisk(d) = Nnew (10)
d2D
where D is the total number of recorded proximity histories.A.2 Infection Risk Estimation as a Regression Problem
Given an epidemiological model and the true distances we can label encounters into “high risk”
and “low risk”. Since the true distances are not available in real settings, we aim to train a
machine learning model to predict these labels from the raw5 RSS measurements of the BLE
signal. To simplify the learning task, we extract features from the RSS data and provide them
as input to the ML algorithm. In particular, we tested the following three feature sets:
1. sum: total sum of received RSS values resulting in one-dimensional features
2. dur max mean: duration, maximum and mean of received RSS values resulting in three-
dimensional features.
3. freq: amplitudes of first 30 frequencies of received RSS values resulting in 30-dimensional
features.
We input these features into a linear regression model in order to obtain a predicted “risk”
score:
I predict (RSS1 , .., RSST ) = hA, f (RSS1 , .., RSST )i + b (11)
The input to the linear regression thus comprises a vector of parameters A, a bias term b and
a vector of extracted features f (RSS1 , .., RSST ). The resulting predicted risk score is then
compared to a threshold, which can be set to ⌘. If the predicted risk exceeds the threshold the
encounter which resulted in the sequence of RSS measurements is considered “high risk“.
A.3 Real-World Experiment
A.3.1 Experimental Setup
A measurement campaign was performed to test and validate the proposed infection risk esti-
mation model. This section describes the setup of the experiment.
The measurements on the 1st of April and the 7th of April were performed using 48 Samsung
A40 smartphones of the same type that were carried by 48 protected soldiers, respectively. Tests
were carried out at five di↵erent locations within the Julius Leber barracks in Berlin. There
were three rooms within a conference center and two outdoor locations, with ten subjects each.
All test subjects were equipped with face masks so that there was no risk of infection.
The floor of the test areas was marked (Fig. 2). These markings consisted of a 5 m x 5 m grid
with lines spaced 50 cm apart. From the starting point (box within a box) to the ending point
(multiplication sign), the test subjects had to walk through markings and stay on each marker
for a predetermined amount of time (2, 4, 6, or 10 min). The markings are numbered on the
green path from 1 to 9 and on the black path from 2 to 10 (Fig. 2, right). Two cameras were
installed at each location to video record the test so that the exact locations of the test subjects
could be checked after the test. The test was carried out in four runs. During the runs, the
test subjects were instructed not to move too much, to hold the positions of the mobile phones
relatively stable, and to stand within the square.
A.3.2 Data and Preprocessing
RSS data was collected via a prototype of the PEPP-PT App. The RSS data - recorded at a
random and potentially varying frequency between 0.1 Hz and 10 Hz - was re-sampled to 1Hz.
Ground truth distance data was derived from the predefined movement pattern on the grid. The
labeling was additionally verified with the help of video footage that was taken at the test area.
For every pair of soldiers we collected multiple data points, where one data point comprised of
two aligned sequences:
• A time series of distances dt , t = 1, .., T (from which the ground truth risk can be derived).
5
For practical reasons we resampled the RSS values to 1Hz.Figure 2: Test pattern on the floor of the five test areas (left with grid, right without grid).
• A time series of BLE RSS values RSSt , t = 1, .., T , recorded by mobile phones held by the
soldiers.
A.3.3 Training and Testing Data
For training and testing, the time series data was separated into two folds according to the
room in the test area in which the data was collected. Data collected in rooms 1 and 2 (indoor)
and room 4 (outdoor) was combined in the training set. Data collected in rooms 3 (indoor)
and 5 (outdoor) was combined in the validation set. In previous tests multiple combinations of
indoor and outdoor rooms were tested to investigate possible covariate shift between indoor and
outdoor scenarios. No significant e↵ects could be detected, therefore the aforementioned mixed
split was used.
A.3.4 Results
We trained a machine learning model to predict the ground truth risk, by only using features
extracted from the RSS time series data RSS1 , .., RSST . Since the labels are not balanced (i.e.
there are more negative than positive events), we use area under the ROC (receiver operating
characteristics) curve (AUC) metric to evaluate the performance of our model. The AUC metric
is a measure for how well the data can be separated using our classifier. An AUC value of 0.5
indicates no predictive power and 1.0 indicates perfect predictive power.
The obtained results are presented in Fig. 3. The columns correspond to di↵erent epidemiolog-
ical models, namely (linear, box, sigmoid), whereas the rows represent di↵erent combinations
of features which we feed into the linear regression. Given the critical risk threshold derived by
applying the respective risk model to the reference sequence (1), we display the achieved AUC
for every combination of risk model and feature combination.
An encounter between two individuals is labeled as “high risk” if the value of I exceeds
a predefined critical risk threshold ⌘. This threshold can either be set locally, i.e., for each
encounter, or globally based on the basic reproduction rate R0 .
A.3.5 Follow-up Study
In order to evaluate the reliability of our results, we tested the model on data recorded with
the same experimental setup, but on a di↵erent dates (7th April 2020 and 14th April 2020).
In the experiments conducted during the 14th of April, participants were using di↵erent smart
phone models and the phone holding positions were varied (”hand”, ”ear”, ”pocket”). Figure
4 compares the AUC values of the two measurement campaigns for the three epidemiological
models (linear, box, sigmoid) and three sets of features (sum, dur max mean, freq). As can
be seen, the performance of the proposed infection risk estimation method is comparable for the
experiments conducted on the 1st of April and the 7th of April. For the experiments conducted
on the 14th of April however the feature set dur max mean distinctively outperforms all otherFigure 3: Ground truth risk vs predicted risk for di↵erent epidemiological risk models and combinations of features supplied to our machine learning model. tested feature combinations. Evidently this combination of features is able to approximate the ground truth risk in a more robust way than the other investigated feature combinations.
Figure 4: Comparison of the results on data recorded on three di↵erent days. Every marker
corresponds to a epidemiological model ((linear - green, box - orange, sigmoid - blue) and a
set of features (sum, dur max mean, freq). Only the feature set dur max mean is robust to the
changes in testing environment that occurred during the third measurement campaign on April
14th.
You can also read