Methodological guidelines - KPI Helmet use among Cyclists and Powered two-wheelers (PTWs)
←
→
Page content transcription
If your browser does not render page correctly, please read the page content below
Methodological guidelines – KPI Helmet use
among Cyclists and Powered two-wheelers (PTWs)
 Version 2.1, April 28, 2021

 Belgium | Austria | Bulgaria | Cyprus | Czech Republic |
 Finland | Germany | Greece | Ireland | Latvia | Lithuania
 | Luxembourg | Malta | Netherlands | Poland | Portugal
 | Slovakia | Spain | Sweden

 baseline.vias.be
2/13

Project: This document has been prepared in the framework of the BASELINE project, for which a grant
 has been awarded by the European Commission. Information on this project can be found on
 the website www.baseline.vias.be
References: (1) Grant agreement under the Connecting Europe Facility (CEF) No MOVE/C2/SUB/2019-
 558/CEF/PSA/SI2.835753 collection of Key Performance Indicators (KPIs) for road safety
 (2) Consortium agreement among the 19 partners of the Baseline project
Authors: Nathalie Moreau, Vias institute (Belgium), Ellen Boudry, Vias institute (Belgium), Anna Zielinska,
 ITS (Poland), Sheila Ferrer López, DGT (Spain) and Maria João Da Silva Barros, ANSR (Portugal)
Publisher: Vias institute, Brussels, Belgium (www.vias.be)
Please refer to this document as follows:
 “Moreau, N. et al. (2021). Methodological guidelines – KPI Helmet use of Cyclists and Powered
 Two-wheelers (PTWs). Baseline project, Brussels: Vias institute”
Any comments or feedback regarding these guidelines should be sent to baseline@vias.be .

Version history
 Version Date Changes
 1.0 January 22, 2021 First draft version - intended as a framework to discuss methodological
 issues in the KPI expert group on helmet use
 2.0 March 15, 2021 Second draft version – incorporating all experts comments
 2.1 March 17, 2021 Minor adjustments
 2.2 April 28, 2021 Restructuration and minor additions and adjustments

 Belgium | Austria | Bulgaria | Cyprus | Czech Republic |
 Finland | Germany | Greece | Ireland | Latvia | Lithuania
 | Luxembourg | Malta | Netherlands | Poland | Portugal
 | Slovakia | Spain | Sweden

 baseline.vias.be

3/13

Contents
Version history _________________________________________________________________ 2
Contents ______________________________________________________________________ 3
1 Introduction and aims_______________________________________________________ 4
2 Scope ____________________________________________________________________ 4
 2.1 Vehicles ___________________________________________________________________________ 4
 2.2 Riders and passengers _______________________________________________________________ 5
 2.3 Protective helmet ___________________________________________________________________ 5
 2.4 Road types _________________________________________________________________________ 6

3 Sample size and choice of observation locations _________________________________ 6
 3.1 Introduction________________________________________________________________________ 6
 3.2 Minimal sample size _________________________________________________________________ 7
 3.3 Stratifications and subpopulations _____________________________________________________ 7
 3.4 Selection of locations ________________________________________________________________ 7

4 Observation method ________________________________________________________ 8
 4.1 Direct observation ___________________________________________________________________ 8
 4.2 Observation procedure _______________________________________________________________ 8
 4.3 Temporal requirements ______________________________________________________________ 9
 4.4 Requirements for automatic detection via roadside cameras ________________________________ 9
 4.5 Optional elements __________________________________________________________________ 10
 4.5.1 Regions _______________________________________________________________________ 10
 4.5.2 Optional additional data collection _________________________________________________ 10

5 Data analysis _____________________________________________________________ 10
 5.1 Statistical analysis and post stratification weights ________________________________________ 10
 5.2 Traffic volume and traffic counts _______________________________________________________ 11

6 Expected results ___________________________________________________________ 11
 6.1 KPI values to be calculated ____________________________________________________________ 11
 6.2 Calculation of confidence intervals _____________________________________________________ 12

References ____________________________________________________________________12
Annex_________________________________________________________________________13
4/13

1 Introduction and aims
The Communication of the European Commission “Europe on the Move – Sustainable Mobility for Europe: safe,
connected and clean” of the 13th of May 2018 confirmed the EU's long-term goal of moving close to zero fatalities in
road transport by 2050 and added that the same should be achieved for serious injuries. It also proposed new
interim targets of reducing the number of road deaths by 50% between 2020 and 2030 as well as reducing the
number of serious injuries by 50% in the same period. To measure progress, the most basic – and important –
indicators are of course the result indicators on deaths and serious injuries.
In order to gain a much clearer understanding of the different issues that influence overall safety performance, the
Commission has elaborated, in cooperation with Member State experts, a first set of key performance indicators
(KPIs). The KPIs relate to main road safety challenges to be tackled, namely: (1) infrastructure safety, (2) vehicle
safety, (3) safe road use including speed, alcohol, distraction and the use of protective equipment, and (4)
emergency response. The aim of the KPIs is connected to EC target outcomes.
The aim of the BASELINE project, funded partially by the European Commission, is to assist participating Member
States’ authorities in the collection and harmonized reporting of these KPIs and to contribute to building the
capacity of Member States which have not yet collected and calculated the relevant data for the KPIs. The outcomes
of this project will be used to set future European targets and goals based on the KPIs.
The purpose of this document is to further describe the minimal methodological requirements to qualify for the
BASELINE KPIs for safety belts and child restraint systems, defined as:

 Percentage of riders of powered two-wheelers and bicycles wearing a protective helmet

As data must be presented separately for PTW riders and for cyclists, these guidelines actually concern two KPI
measurements: one on helmet use among PTW riders and the other on helmet use among cyclists.
The minimal requirements set by the EC for this KPI are described in the Commission Staff Working Document SWD
(2019) 283 (referred to as ‘SWD’). These requirements are quantified and specified in this document. This is mainly
based on expert consultation (BASELINE Key Expert Group), on Hakkert et al. (2007), WHO (2006) and additional
information provided by Ireland, Portugal, and Germany.
Next to the specification of the minimum requirements to deliver the main KPI and the disaggregated indicators
(always marked bold), each section will also include optional supplementary methodological recommendations.
Member States can decide whether to follow the minimal requirements only or to extend (part of) their
methodology, depending on available means and own research questions.
The target audience of this document are the persons in the Member States participating in the BASELINE EC project
that will collect and/or analyse the data to deliver the KPIs.

2 Scope
2.1 Vehicles
The UNECE Transport Glossary1 includes the following definitions for the vehicles concerned:
 • BICYCLE: A road vehicle which has two or more wheels and generally propelled by the muscular energy of the
 persons on that vehicle, in particular by means of a pedal system, lever or handle (e.g., bicycles, tricycles,
 quadricycles, and invalid carriages). Included are cycles with a supportive power unit (e.g., electric bikes).
 • MOPED: A two or three-wheeled road motor vehicle which is fitted with an engine having a cylinder capacity
 of less than 50cc and a maximum authorized design speed in accordance with national regulations. Where
 limitations concerning the engine displacement are not applicable, a restriction in terms of motor power may
 be in force. This relates to categories L1 and L2 of the UN Consolidated Resolution on the Construction of
 Vehicles (R.E.3).

1
 https://unece.org/DAM/trans/main/wp6/pdfdocs/Glossary_for_Transport_Statistics_EN.pdf - see pages 39-40
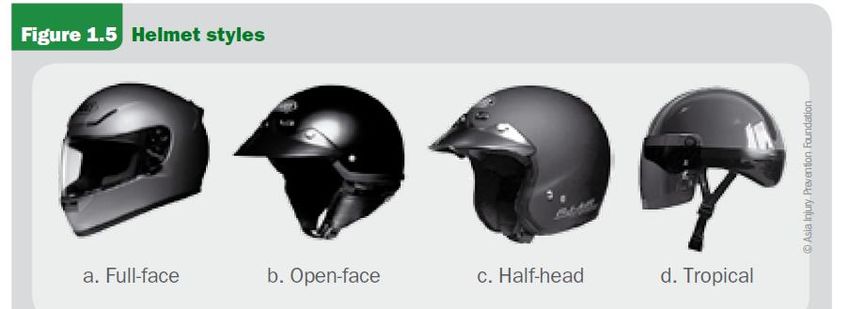
5/13

 • MOTORCYCLE: A two or three-wheeled road motor vehicle not exceeding 400 kg of unladen weight. All such
 vehicles with a cylinder capacity of 50cc or over are included, as are those under 50cc which do not meet the
 definition of moped. This relates to categories L3, L4 , L5 , L6 and L7 of the UN Consolidated Resolution on the
 Construction of Vehicles (R.E.3).
Although optional, it is recommended to provide a variable “vehicle type” including different vehicle types for both
KPIs. For PTWs, we recommend making at least the distinction between “moped” and “motorcycle”; for bicycles,
we suggest making at least the distinction between “bicycle” (non-electric) and “electric bike / e-bike”. Their specific
categorization should be clearly defined and illustrated for readers.

2.2 Riders and passengers
The objective of the roadside observation study is to estimate the percentage of powered two-wheelers (P2Wers)
(motorcycles and mopeds) and cyclists (including electric bicycles) wearing a protective helmet. Therefore, the
theoretical population for these two KPIs refers to the total number of kilometres ridden over the national territory
by P2Wers and by cyclists. Hence, by weighting the results by number of kilometres ridden (or a proxy of traffic
volume), the percentage of riders wearing a helmet will also reflect the percentage of kilometres ridden with a
helmet.
For cyclists, data for children (0-14 years old) should be shown separately. If national legislation makes cycle
helmets compulsory for children, but using another age limit (e.g., up to 10 years old), this age category should be
added (i.e., data should be shown separately for children aged “0-10”, for those aged “11- 14” and for people older
than 14“≥15”).

2.3 Protective helmet
As Hakkert and colleagues (2007) have highlighted: “Under the term helmet, we understand a crash/safety helmet
designed for two wheelers, whether motorized or non-motorized.” Examples of types of helmets are shown in the
figures below:

 • Helmets for cyclists2:

 • Helmets for motorcyclists (WHO, 2006):

As legislation on helmet use can vary between countries, it is requested that all countries document their legislation
on helmet use regarding each type of vehicle.

2
 https://en.wikipedia.org/wiki/Bicycle_helmet
6/13

2.4 Road types
The KPI should cover use of helmets on motorways, rural non-motorway roads, and urban areas. Obviously,
motorways are only relevant for motorcyclists and not for cyclists and moped riders. This is the assumption in the
rest of this document. Rural non-motorway roads are to be interpreted as roads outside built-up areas and urban
roads as roads inside built-up areas. The results should be presented separately for these three different road types.
The proportion of observations sampled for each of the three road types should be above 20% to ensure a minimal
number of observations for each stratum, even if this would imply disproportional sampling. The three road types
should be well defined in the methodology (e.g., typical characteristics, traffic signs, speed regimes, number of
lanes, …).

3 Sample size and choice of observation locations
3.1 Introduction
The methodological guidelines for all KPIs are designed to ensure international comparability between KPI values
while taking into account feasibility and affordability. To that end the methodological guidelines have been defined
in such a way that accurate and representative results can be obtained for all parameters of interest at a reasonable
cost.
Obviously, the larger the sample of observations and locations for observation, the more accurate the KPI estimates
for the different strata will be (e.g. a KPI value for a particular type of road, or a particular part of the week).
Increasing the number of observations and locations however implies increasing field work costs. Statistically, the
required minimum sample size depends mainly on the desired accuracy of the final estimates, for which no absolute
value can be determined a priori. Therefore, for the main KPI estimates a pragmatic evaluation was made of the
expected confidence intervals at different sample sizes and population parameters. Giving priority to feasibility and
affordability, as a rule of thumb the minimum total number of observations was set at 2,000, the minimum number
of observations for different strata at 500. It was agreed that this should allow to identify statistically meaningful
differences between countries at an affordable price. For some countries, this will imply disproportionate sampling
of certain strata compared to the distribution of traffic volumes over different strata. This is however required to
allow statistically meaningful international comparisons at the level of each of the strata at interest.
The same pragmatic logic was followed for determining the minimum number of 10 locations for observation for
each of the required road types of interest. Once again, there is no statistical rationale for determining the required
minimum number of locations to ensure representativeness of the observations for the entire country. This mainly
depends on the amount of variance between locations and within a country. Giving priority to affordability, a rule
of thumb was also used to define the minimum number of locations at 10 per stratum. In order to ensure
representativeness for the entire country larger numbers of locations might be required for larger countries. Taking
field work costs into account, it was however decided to only identify the minimum requirements and leave
decisions on the final number of locations to the discretion of the member states. Equally importantly, in order to
ensure representativeness of the measurement locations these should be randomly selected as far as possible.
The main objective in defining the minimum methodological requirements is to keep a balance between affordability
of the field work and the requirements to make meaningful international and historical comparisons. Therefore, the
emphasis is placed on the minimum requirements that can also be taken into account by smaller countries. It is
however of interest to any member state to increase the accuracy of the KPI estimates by boosting the number of
locations and the number of observations.
7/13

3.2 Minimal sample size
A minimum of 2,000 observations overall is recommended for each of the two KPIs on helmet use (e.g., 2,000 PTWs
and 2,000 bikes). For the first stratification level (e.g., road type), a minimum of 500 observations per stratum is
recommended. Countries that are not able to achieve the minimum requested number of observations will need to
indicate the reasons in the methodological report (see last paragraph in the section on expected results).
When considering the minimal sample size, it should be noted that this refers to number of observations that
include the minimal requested data (i.e., excluding observations with missing values in relation to the minimal
requested data). The minimum number of observations should be understood as the minimum number of vehicles
observed. Some of the vehicles observed will have not just a rider but also a passenger.
For more information on the determination of the minimal sample size and for the random sampling of locations,
the SafetyNet general recommendations for SPIs (safety performance indicators) can be consulted:
http://www.dacota-project.eu/Links/erso/safetynet/fixed/WP3/sn_wp3_d3p8_spi_manual.pdf

3.3 Stratifications and subpopulations
SWD requires to take into account:
 • Road types (3): motorways (only for motorcycles), other rural roads (or roads outside built-up areas), and
 urban roads (or roads inside built-up areas).
 • Periods (2): weekday / weekend day.
Unless nation-wide surveys support the absence of major regional differences, countries might have to consider an
additional stratum related to regions.
Since the overall estimate is expected to be representative for the total of all kilometres driven in a country,
theoretically the optimal strategy to estimate the overall prevalence would be to sample all strata according to
traffic volume of each combination of the different strata. This strategy would, however, be detrimental for the
accuracy of specific low volume strata that are of interest. Certain road types could have a lower traffic volume than
others, as do weekends compared to weekdays. As a result, a strictly proportional sampling would lead to much
smaller confidence intervals for certain strata.
For representativeness, the recommended minimum numbers of locations are therefore:
 • 10 locations per stratum in the first stratification level (i.e., in this KPI, 10 locations for each of the 3 road
 types; and 10 locations for each of the two periods (week/weekend))
 • at least 2 locations for each stratification combination (e.g., 3 road types X 2 periods = 6 combinations and a
 minimum of 2 locations in each combination.).

3.4 Selection of locations
The selection of locations should be as random as possible, covering the geographical area of the country, optionally
using regions like NUTS1 regions (e.g., stratified random sample). The basic process for the choice of locations
consists of three steps:
 (1) The required number of different locations (for the country or per region) is determined.
 (2) The number of locations is randomly selected on the map using the entire area under consideration (e.g.,
 country or region), taking a sufficient geographical spread into account. The specific requirements for each
 location do not have to be taken into account at this point. This step is to ensure a reasonable geographical
 spread of the randomly selected locations.
 (3) The final locations that will be used for the observations are manually chosen in the area surrounding the
 locations randomly selected in the previous step. At this point, the final selection must be based on the
 location requirements (different road types), inclusion/exclusion criteria (if applicable), and practical
 considerations. This final selection may be done using Google Street View. Care should be taken to ensure
 that the different road types are also sufficiently geographically spread.
8/13

A convenient way of selecting locations randomly (step 2) is to use a GIS system (e.g. cartographic software like
ARCView/ARCGIS) as such software can automatically select location points within defined areas randomly (e.g.,
https://desktop.arcgis.com/en/arcmap/latest/extensions/geostatistical-analyst/an-introduction-to-sampling-
monitoring-networks.htm). If Member States have no GIS software, step 2 can also be carried out manually using a
national geographic map, e.g., Google Maps/Google Earth.

A random selection of locations will often include locations with low traffic flow for each stratum. If traffic flow is
too low, it is acceptable not to include these locations. A minimum traffic flow for selecting a location can be defined
as at least 10 relevant vehicles (PTWs or cyclists) per hour. Also, locations where the composition of the traffic
deviates significantly from normal traffic (e.g., locations where 90% of the cyclists are sports cyclists) should be
avoided.

If it is not possible to identify 10 locations with at least 10 relevant vehicles per hour for the 1st stratification level
indicators, we recommend different alternative strategies to reach the minimum number of observations:
 ▪ including summer months in the measurement period to increase the probability of traffic volume for
 P2Wers and cyclists;
 ▪ increasing the number of locations (with few vehicles per hour)
If these strategies do not allow to reach the minimum number of observations within factors of the 1st stratification
level, it will be accepted to exclude these stratification level indicators. Countries facing this issue will estimate the
KPI per available stratification level and no national KPI will be estimated.

The method used for location selection should be described in the methodological report. The rationale for choosing
the observation locations should be provided. Basic characteristics of the locations should be recorded: coordinates
(if possible), address or other geographical information, target lane or path and direction to be observed, traffic
signs, speed regime, number of lanes, traffic flow and visibility of the traffic from the location.

4 Observation method
4.1 Direct observation
SWD prescribes direct observation as the data collection method and allows the use of cameras if appropriate.
Direct observation should preferably be carried out along the roadside (or another convenient place). If the use of
cameras is adopted, they should not be installed exclusively on one type of road so as to avoid selection bias.
For both KPIs, observations of helmet use on urban and rural roads can be carried out from a safe place along the
road, preferably at locations where driving speed is reduced relative to the speed limit, such as intersections. For
PTWs on motorways, observations of helmet use could be carried out at the last intersection before on-ramps, at
the first intersection after an off-ramp, after the exit to a petrol station, or from the bridge over the motorway.

4.2 Observation procedure
For both KPIs on helmet use, the most straightforward approach involves observing one bike or PTW, encoding the
data, and then observing the next passing bike/PTW. When it is not possible to code the observational data for all
the road users who pass by, cyclists and PTW riders should be randomly selected from all the possible road users at
the observation location. The easiest and most efficient way is after coding one observation to observe the next
passing target road user.
The observations must be made by well-trained independent observers (not uniformed police or other officers)
under the supervision of a coordinator. Observers should receive rigorous theoretical and practical training and be
given clear guidelines about the road section and traffic direction they should observe, the duration of observation
periods and how to manage any potential difficulty that would hamper the data collection. They should be given
clear guidance on the procedure to be followed when observations cannot be performed (due to weather
conditions, concerns with visibility, safety problems, etc.) (Hakkert & Gitelman, 2007). Wherever possible, it willv be
valuable to ensure consistency between observers (the inter-rater reliability) before the start of and during the
fieldwork.
9/13

It is recommended that the KPIs on helmet use are measured by two observers (one for PTW riders and one for
cyclists). If data for both KPIs are collected during the same measurement by only one observer, a rule should be
defined to determine the next observation subject (cyclist or PTW) in the case of high traffic volumes.
One observation session should last at least 30 minutes (ideally 1 hour), excluding the time needed for counting
traffic and collecting environmental data (see section 5.2). Each observation location can be used for different
observation sessions (at different time intervals) or each location can be assigned (randomly) to a specific time
interval.
The fieldwork procedure should be described in the methodological report.

4.3 Temporal requirements
Data collection should be carried out during daylight hours; observations should cover all the daytime. One may
organize the observation sessions during different periods of the day (e.g. morning, noon, evening) or taking
account of peak hours (e.g. 07:30 to 10:30 (AM peak), 12:00-15:00 (Inter-Peak) and 16:00 to 19:00 (PM peak)). In such
cases, it is recommended that each location is observed during all the different periods. Dates and hours of the
measurements should be reported in the meta-data.
Helmet use has to be observed both during weekends and during weekdays, because the purpose and duration of
riding may vary considerably between weekdays and weekends. The KPIs should be presented separately for
weekdays (excluding bank holidays) and weekends.
When planning the observation periods, one should ensure a balanced combination of road types and time periods,
in order to avoid a systematic sample bias (e.g. all motorway observations at the weekend and all other roads on
weekdays; or all motorway sessions in the morning and all urban sessions in the afternoon). The same balance
should be sought across all combinations of periods and other time considerations, avoiding, for example, all the
sessions during the weekdays being planned for the morning only.
It is recommended to implement the measurement at the end of spring or at the beginning of autumn. In principle,
all months are allowed except December, January, July, and August (in some Member States June also). However,
for countries facing difficulties in reaching the minimal number of observations, the measurement can be extended
to summer months. In the interests of representativeness, sessions during official feast days and holidays should be
avoided.
Member States willing to measure helmet use during two seasons (in late spring and early autumn) can apply the
minimal sample size requirements for the two measurements together. The data from both sets of observations
can be combined to deliver the main and disaggregated indicators. When Member States have historical series of
measurements, it is recommended to use the same period(s) of the year as for the earlier measurements.

4.4 Requirements for automatic detection via roadside cameras
SWD allows the use of cameras to collect data on helmet use by cyclists and PTW riders; after recording, the still or
video images can be analysed to encode the data. In some applications, helmet detection is automatically performed
by the software. There are some clear advantages in using cameras instead of observers, particularly in terms of,
for example, reliability and duration of the observation sessions (including nighttime use, although this not relevant
for the Baseline project).
Possible disadvantages should however be evaluated, such as privacy/GDPR issues (identifiability of riders) and the
risk of lacking key variables. This technology should be tested and validated before use. On account of privacy issues,
faces should not be caught on camera. Each country will have to deal with national requirements regarding the
ethics and protection of private lives.
It should be ensured that the cameras are installed on all types of road to avoid selection bias.
10/13

4.5 Optional elements
4.5.1 Regions
Disaggregated data for regions is not part of the minimal requirements. Member States are free to choose
supplementary stratifications by region within the country (e.g., NUTS 1 regions). One can consider collecting data
from each region or from a representative selection of regions. Member States that want meaningful KPIs at
regional level should apply the minimal methodological requirements to each region (see Section 3). If stratification
by regions is used, results should be weighted according to traffic volumes by region.

4.5.2 Optional additional data collection
One may consider the observations as an opportunity to collect additional data related to helmet use or other
behaviours among PTW riders and cyclists. Some examples to consider are:
 • types of bicycle (electric or not, city/sport bike, …)
 • types of PTW (moped, e-moped, motorcycles of certain types, …)
 • type of helmet (full face, open face, half helmet, tropical, …)
 • correct use of the helmet (properly fastened, not properly fastened, not fastened at all, and wearing the
 helmet backwards) (WHO, 2006).
 • use of other protective equipment (gloves, jacket, trousers, shoes, …) (Hakkert & Gitelman, 2007).
 • the colour of the helmet (dark, with lights, reflective, …)
 • wearing of reflective clothing
 • private or a public/shared vehicle
 • professional/non-professional rider
 • gender
 • age category
 • wearing earphones (only for cyclists)
 • using mobile phone
 • …

5 Data analysis
5.1 Statistical analysis and post stratification weights
Since sampling will typically be nested in locations, for statistical analysis it is recommended to use models for two-
stage stratified cluster sampling (e.g., 1st stage= road type and 2nd stage= period). Approximations assuming simple
random sampling can be used as long as results are weighted according to traffic volumes.
For each level of stratification, results should be weighted according to traffic volumes by level of stratification. For
these 2 KPIs, this implies that the results should minimally be weighted according to traffic volume data by type of
road and period of the week (weekdays/weekend). Traffic volumes can either be inferred from existing national
mobility data or estimated by using traffic counts during the observations. When traffic counts are used to infer
traffic volumes per stratum, road network length by type of road should be considered (see Section 5.2).
If other stratification criteria are considered (e.g., regions), then the weighting should take them into account (e.g.,
traffic volume data by region, type of road and period of the week). It is recommended to use the exact values for
each combination of stratification levels considered (e.g., traffic volume of PTWs on weekdays on motorways). If
these
combined data are not available, the second-best option is to assume independence of all levels of stratification and
use combinations of marginal totals to estimate specific combinations.
All methods used should clearly documented.
11/13

5.2 Traffic volume and traffic counts
The weighting by traffic volume for cyclists and PTWs in the country is ideally based on national mobility data (driven
vehicle-kilometers). If such traffic volume data is not available, it is recommended to use a combination of data on
road length with traffic counted during the observations. If no official data on road length are available, it is
recommended to request estimates from experts from the relevant administration services.
For both KPIs on helmet use (among PTWs and among cyclists), traffic counts should be performed at each location
and during each observation session. The purpose is to count all the relevant vehicles. For KPIs on helmet use, this
means that each PTW or cycle who rides in the same direction as those who are being observed will be counted.
Note that if the observers succeed in observing helmet use among all PTWs (or cyclists) who pass by, there will be
no need for the traffic count as it will be equal to the number of observations.
It is recommended to count the traffic of PTWs and bikes for a minimum of 10 minutes (either 5 minutes before and
5 minutes after the observation, or 10 minutes in the middle of the observation session). These counts should then
be extrapolated for the whole duration of the session.
It is stressed that traffic volume should also be counted even when national traffic volume statistics according to
road type are available. This information is necessary to calculate the share of helmet users per observation session
and to correctly calculate the confidence intervals and weighing factors.

6 Expected results
6.1 KPI values to be calculated
The main indicator is the percentage of riders wearing a helmet across all times and locations, separately for users
of bikes and PTWs, and for riders and passengers. So overall there are 4 main KPIs for which a point estimate and a
95% confidence interval is to be calculated:
 • riders of bicycles (including e-bikes)
 • passengers of bicycles (including e-bikes)
 • riders of PTWs (mopeds and motorcyclists)
 • passengers of PTWs (mopeds and motorcyclists).
In some countries, the number of passenger observations is expected to be very low. Countries facing this limitation
will not be included in the results on helmet use among passengers.
It is also recommended to distinguish values:
 • for cyclists: values for children (0-14 years old) and older people separately; if national legislation requires
 children cyclists to wear helmets up to a certain age, this age category should be added (i.e. data should be
 shown separately for children aged “0-10”, for those aged “11- 14”, and for those older than 14“≥15”)
 • for PTWs: values for mopeds and motorcycles separately.
For each of the 4 main KPIs, it is also required to calculate a point estimate and a corresponding 95% confidence
interval for the disaggregated levels:
 • road type (3 levels) (motorways, rural non-motorway roads and urban areas)
 • period of the week (2 levels) (weekdays and weekend days)
 • region (if applicable).
It is recommended to provide specific estimates for combinations of levels (including the confidence interval).
Together with the above estimates, a methodological report should be submitted that describes the specificities of
the methodology of the field work and the statistical techniques used to weight and analyse the results, and to
calculate the CIs.
12/13

6.2 Calculation of confidence intervals
Assuming simple random sampling and depending on prevalence levels, the 95% confidence intervals (CI) for
n=2,000 and n=500 are estimated using the formula:

 (100 − )
 CI = prevalence ± z * √

Prevalence Lower bound, n=2,000 Upper bound, n=2,000 Lower bound, n=500 Upper bound, n=500
 50% 47.8% 52.2% 45.5% 54.5%
 75% 73.0% 76.9% 71.0% 78.7%
 90% 88.6% 91.3% 87.0% 92.5%

References
European Commission (2017). Monitoring Road Safety in the EU: towards a comprehensive set of Safety
 Performance Indicators. European Commission, Directorate General for Transport
 https://ec.europa.eu/transport/road_safety/sites/roadsafety/files/pdf/ersosynthesis2017-detail-
 performanceindicators15_en.pdf
European Commission (2019). Commission staff working document EU road Safety Policy Framework 2021-2030 -
 Next steps towards "Vision Zero". SWD (2019) 283 final. Retrieved from
 https://ec.europa.eu/transport/sites/transport/files/legislation/swd20190283-roadsafety-vision-zero.pdf
Hakkert, A.S and V. Gitelman (Eds.) (2007). Road Safety Performance Indicators: Manual. Deliverable D3.8 of the
 EU FP6 project SafetyNet. https://www.dacota-
 project.eu/Links/erso/safetynet/fixed/WP3/sn_wp3_d3p8_spi_manual.pdf
Hakkert, A.S, Gitelman, V. and Vis, M.A. (Eds.) (2007). Road Safety Performance Indicators: Theory. Deliverable
 D3.6 of the EU FP6 project SafetyNet. https://www.dacota-
 project.eu/Links/erso/safetynet/fixed/WP3/sn_wp3_d3p6_spi_theory.pdf See also https://www.dacota-
 project.eu/Links/erso/safetynet/content/wp_3_safety_performance_indicators_1.html
Helmets - A road safety manual for decision-makers and practitioners, WHO, 2006 (p 35) -
 https://www.who.int/violence_injury_prevention/publications/road_traffic/helmet_manual.pdf
13/13

Annex
COMMISSION STAFF WORKING DOCUMENT
EU Road Safety Policy Framework 2021-2030 - Next steps towards "Vision Zero", SWD (2019) 283 final
https://ec.europa.eu/transport/sites/transport/files/legislation/swd20190283-roadsafety-vision-zero.pdf
Rationale
The use of a protective helmet is often cited to be an essential passive safety measure for powered two-wheeler
riders (for whom it is mandatory) and for cyclists.
Definition of the KPI
Percentage of riders of powered two-wheelers and bicycles wearing a protective helmet.
Minimum methodological requirements

Data collection method Direct observation (if appropriate, using cameras).
Road type coverage The indicator should cover motorways, non-urban roads and urban areas. The results could
 be presented separately for the three different road types if available.
Vehicle type The indicator should include riders (also passengers) of powered two-wheelers
 (motorcycles and mopeds) and cyclists (including those riding power-assisted bicycles).
 Results should be disaggregated for driver and passengers. The results for bicycles should
 be presented separately. Where available, data for children should be shown separately, to
 take into account any legal requirements.
Location Random sample (methodology for Member States to decide).
Time of day Observations to take place during daylight.
Day of week Separate observations for week days and weekend and data to be shown separately.
Month Late spring, early autumn.
NB: A note should accompany the results for cyclists stating the existing state of the legal requirements (or the
absence of requirements) concerning helmet use.
You can also read