The Carbon Footprint of Valencia Port: A Case Study of the Port Authority of Valencia (Spain) - MDPI
←
→
Page content transcription
If your browser does not render page correctly, please read the page content below
International Journal of
           Environmental Research
           and Public Health

Article
The Carbon Footprint of Valencia Port: A Case Study
of the Port Authority of Valencia (Spain)
Víctor Cloquell Ballester 1 , Vanesa G. Lo-Iacono-Ferreira 2, * ,
Miguel Ángel Artacho-Ramírez 1 and Salvador F. Capuz-Rizo 1
 1    Department of Engineering Projects, Valencia Campus, Universitat Politècnica de València,
      Camino de Vera, s/n, E-46022 Valencia, Spain; vacloque@dpi.upv.es (V.C.B.); miarra@dpi.upv.es (M.Á.A.-R.);
      scapuz@dpi.upv.es (S.F.C.-R.)
 2    Department of Engineering Projects, Alcoy Campus, Universitat Politècnica de València,
      Plaza Ferrándiz y Carbonell, s/n, E-03690 Alcoy, Spain
 *    Correspondence: valoia@upv.es

 Received: 12 September 2020; Accepted: 29 October 2020; Published: 4 November 2020

 Abstract: Maritime transport is responsible for 13% of the Greenhouse Gases (GHG) emissions of the
 transport sector. Port authorities, terminals, shipping companies, and other stakeholders have joined
 efforts to improve this sector’s environmental performance. In Spain, the Ministry for Ecological
 Transition and Demographic Challenge has developed a methodology to assess the carbon footprint.
 This methodology has been adapted to ports and applied to processes under the Port Authority of
 Valencia’s umbrella achieving scopes 1, 2, and 3. The results highlight that ship traffic, within the
 port, of containers and cruises (categorized in scope 3) had a major impact on the carbon footprint.
 Buildings lighting managed by the terminals has a significant effect on scope 2. Diesel consumption
 shares with gasoline consumption the primary representation in scope 1. The carbon footprint
 between 2008 and 2016 was maintained, although traffic in the port increased by 24% during this
 period. The results show a decrease of 17% when emissions are compared using the base year’s
 emissions factors to avoid external factors. Future projects that include self-consumption or renewable
 energy policies seem to be the next step in a port that shows good results but still has room for
 improvement in activities of scope 3.

 Keywords: GHG; emissions; maritime transport; energy consumption; environmental performance

1. Introduction
     The Valencia Port, with over 5000 twenty-foot equivalent units (TEUs) a year, is the 6th largest
port of container traffic in Europe and the largest in the Mediterranean Sea [1,2]. Five thousand
ships, including container ships, cruise, and ferries, operate each year in this Spanish port. The port
authority’s commitment led to the implementation of an environmental management system verified
in EMAS and ISO 14,001 in 2008 and constant evolution since then [3,4].
     The carbon footprint is a popular indicator applied for processes, products and organizations,
maritime activities, and ports [5–8]. The Valencia Port applied it to emissions resulting from cruise and
sport boats and big 400 m long container ships that can take almost 15,000 TEU [9].
     There are many standard methodologies to assess the carbon footprint. The most widely known
are ISO 14067:2018 [10] and PAS 2050 [11], both based on a life cycle thinking that considers different
levels of detail or scopes.
     The transport sector is responsible for 29% of all energy consumption globally and, therefore,
for a similar amount of GHG emissions [12,13]. Maritime transport is responsible for 13% of the total
GHG emissions [14]. Maritime transport also emits other harmful gases such as SOx and NOx [15–18].

Int. J. Environ. Res. Public Health 2020, 17, 8157; doi:10.3390/ijerph17218157      www.mdpi.com/journal/ijerph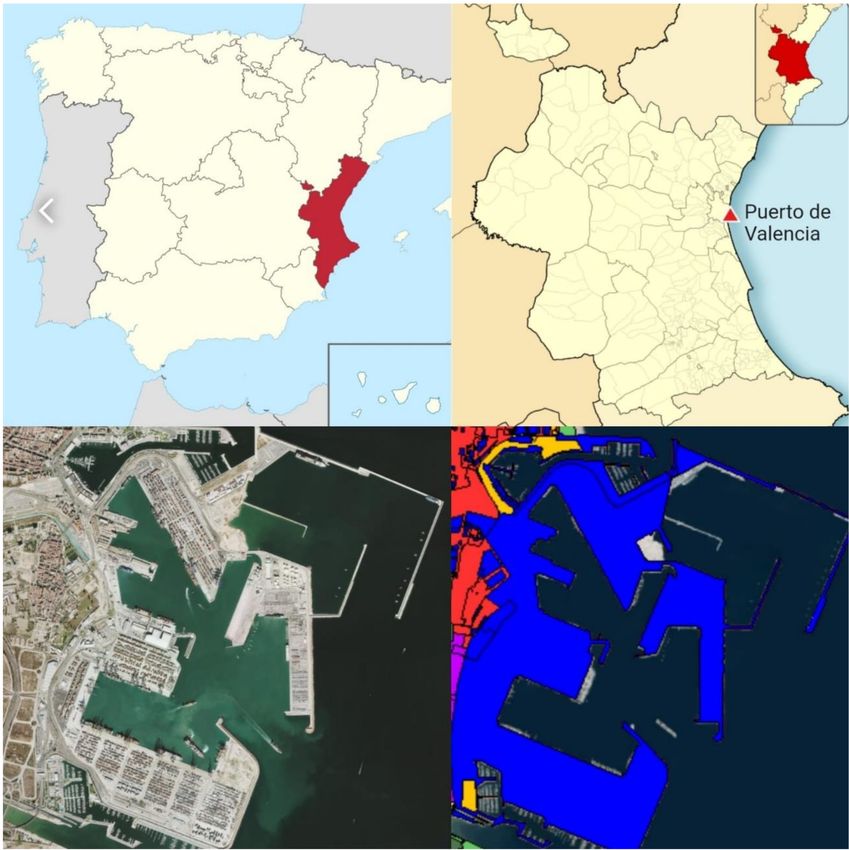
Int. J. Environ. Res. Public Health 2020, 17, 8157                                                    2 of 16

However, there are significant benefits when choosing maritime transport over different types of
transport. When maritime transport is not possible, rail transport might be a more sustainable choice.
For example, the transport of goods by road presents a higher number of accidents, generates traffic
congestion, and is responsible for more than 60% of the GHG emissions [19,20].
      Ports are essential infrastructures for economic growth. Providing accurate information also helps
involve stakeholders in the projects developed to improve ports’ environmental performance [21,22].
Port terminals have made a significant effort to assess their carbon footprint [23–28]. Although the
methodologies applied to vary significantly and, often, only the direct emissions are considered [29].
There are no studies that address all three scopes under a structured methodology.
      The port of Valencia, managed by its Port Authority, has made a significant effort in the past years,
developing projects and initiatives seeking to improve their environmental performance. This research
assesses the carbon footprint of one of the main ports in Europe, Valencia port, applying a standardized
methodology and considering direct and indirect emissions (scopes 1, 2, and 3). This organization is
the first of its kind that assesses and certifies according to ISO 14064:2018 its carbon footprint, including
scope 3.
      This study aims to present and analyze the carbon footprint assessment carried by the Authority
Port of Valencia. This paper is structured in several sections. Section 2 describes the methodology and
data characteristics. Results are presented in Section 3, including a parallel assessment for comparative
porpoises. Section 3 also shows the discussion of results, and Section 4, the conclusions of the study.

2. Methodology and Data
     Valencia’s port authority (Spain) ’s carbon footprint was calculated under the Life Cycle Assessment
(LCA) method by setting the system boundaries, defining the greenhouse gases, establishing the
calculation formula, and interpreting the results obtained. The Guide for the Calculation and
Management of the Carbon Footprint in Port Facilities by Levels was applied [30]. This guide follows
the International Panel on Climate Change (IPCC) guidance.

2.1. Functional Unit, System Boundaries, Scope Definition, and Greenhouse Gases
    The system under study was Valencia’s port authority, located in Valencia’s port (Spain; Figure 1).
The management of the port uses tons of cargo managed as the base unit when assessing its activity.
Therefore, and following the guide’s criteria [30], the cargo, measured in tons (t), was chosen as the
study’s functional unit.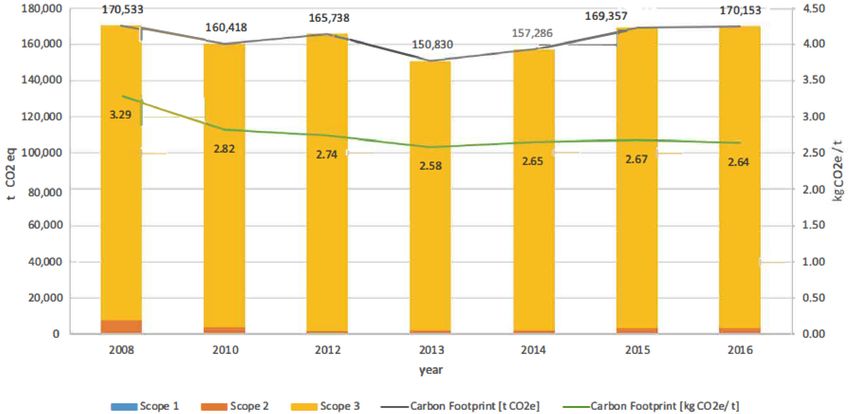
Int. J. Environ. Res. Public Health 2020, 17, 8157 3 of 16
Figure 1. Port of Valencia location. Up left: Valencia region. Upright: Port location. Down left: Satellite
image of the port. Downright, in blue, system under study. Source: [31].
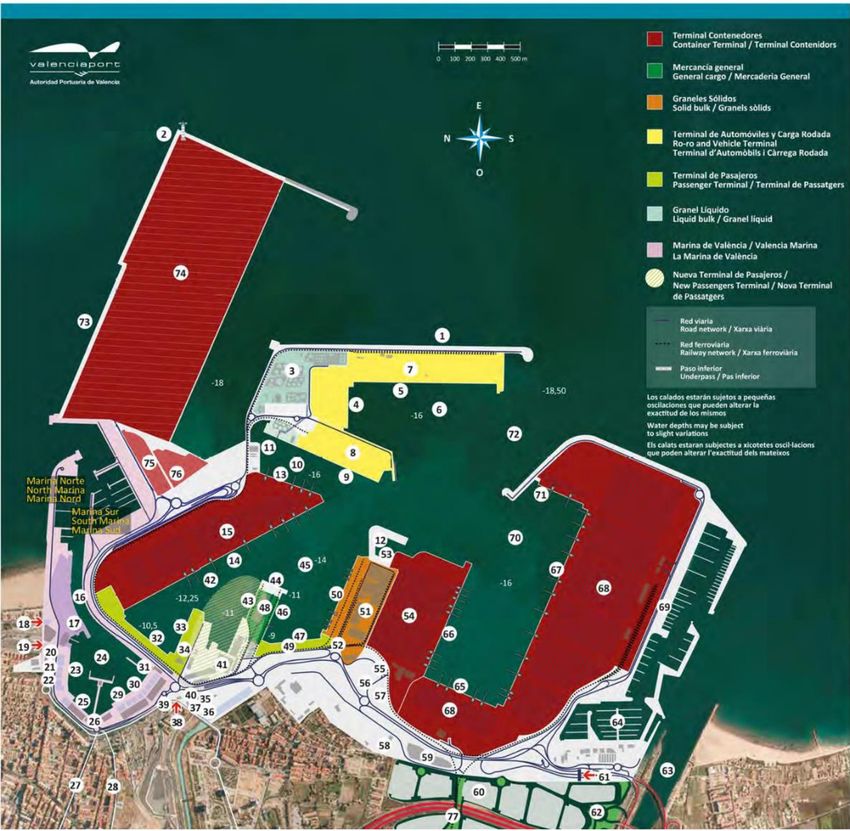
The system boundaries were set to the area of influence of the port authority; this includes the
offices of the port authority, stockyard machinery and activities, docking line machinery and activities,
and ship traffic inside the port area (Figure 2).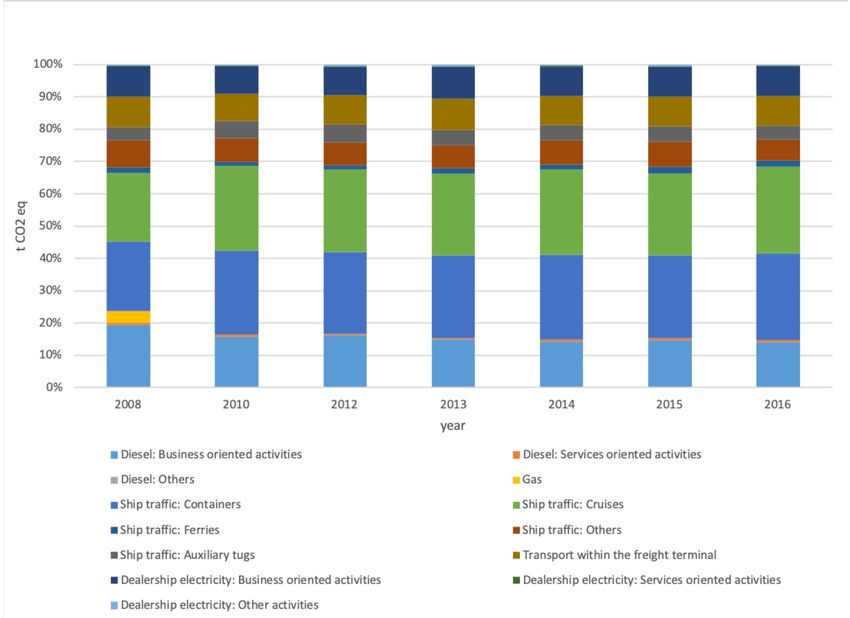
Int. J. Environ. Res. Public Health 2020, 17, 8157                                                    4 of 16

      Figure 2. Port of Valencia. Source: [1]. Numerical legends: 1—East Breakwater, 2—Lighthouse,
      3—Chemical and Oil Terminal, 4—Transversal East, 5—East Breakwater Quay, 6—East Dock, 7—Ro-ro
      and Vehicle Terminal 1, 8—Ro-ro and Vehicle Terminal 2, 9—North Quay (Xitá), 10—Xitá Dock,
      11—Scrapyard Quay, 12—Port services (pilots, tug boats and mooring), 13—Llavera Quay, 14—Levante
      Quay, 15—Container Terminal 3, 16—Moveable bridge, 17—Veles e Vents building, 18—Access
      to Juan Carlos I Royal Marina, 19—Customs gate, 20—Customs Administration, 21—Foreign
      Health Department, 22—Valencia 2007 Consortium, 23—Customs Quay, 24—Inner Dock, 25—Grao
      Quay, 26—Clocktower building, 27—Avda. del Puerto, 28-Avda. Baleares, 29—Former Terminal
      Quay, 30—Nazaret Quay, 31—Fish Market, 32—Transversal Quay, 33—Poniente Quay, 34—Ferry
      Terminal/Passenger and Cruise Terminal, 35—Port Police, 36—Valencia port Foundation, 37—Port
      Authority of Valencia, 38—Nazaret gate, 39—Naval Command, 40—Plant Health Service, 41—Foreign
      Trade Inspection Centre, 42—Levante Dock, 43—North Turia Jetty Quay, 44—End Turia Jetty, 45—Turia
      Dock, 46—South Turia Jetty Quay, 47—Turia Quay, 48—General and bulk cargo, 49—Passenger Terminal,
      50—South Quay, 51—Solid Bulk Terminal, 52—Spanish Customs Control Authority, 53—Technical
      and Nautical services Dock, 54—Container Terminal 2 (MSC), 55-PIF, 56—Harbourmaster’s Office,
      57-Cold sage warehouses, 58—CPE Valencia, 59—Logistics warehouse, 60-Logistics Activities Area
      (ZAL), 61—South Access, 62—ZAL Access, 63—New Turia riverbed, 64—Royal Valencia Yacht Club,
      65—Costa Quay, 66—Transversal Costa Quay, 67—Príncpie Felipe Quay, 68—Public Container Terminal
      1, 69—Marine Civil Guard Building, 70—South Dock, 71—East Wuay, 72—Entrance channel, 73—North
      Extension Breakwater, 74—New Container Terminal, 75—Container depot 1, 76—Container depot 2.
      77—Connection to national rail network.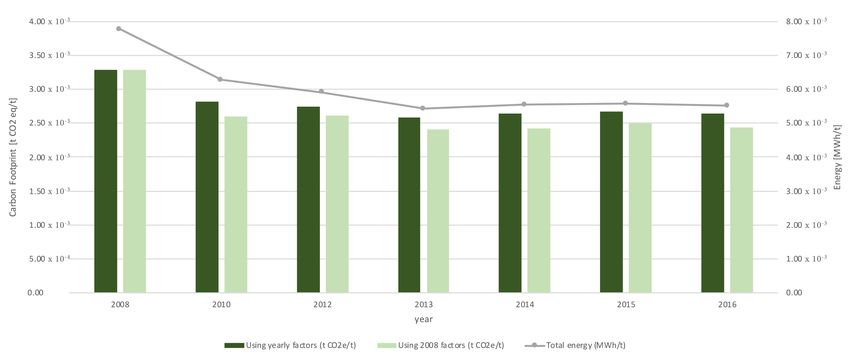
Int. J. Environ. Res. Public Health 2020, 17, 8157                                                           5 of 16

    Categories are applied to this study to assess better and analyze the results. The following three
scopes were being considered:

•     Scope 1 is defined by the direct emissions in the infrastructures, machinery, and vehicles of the
      port authority. Scope 1 includes all the processes under the direct control of the port authority that
      are not related to electricity consumption (scope 2). The emissions of these processes are direct
      emissions caused by the consumption of different fuels. For this reason, the categories in scope 1
      are defined by the type of fuel.
•     Scope 2 reflects the emissions associated with the electricity consumption of the infrastructures of
      the port authority. The port authority consumes electricity in two main areas under their own
      management: buildings and stockyard; although, there are some other small consumptions not
      included in both these areas. For this reason, scope 2 is organized into 3 categories: buildings,
      stockyard, and others. The category for building is divided into two subcategories: lighting and
      air conditioning.
•     Scope 3 gathers the emissions of machinery, vehicles, and ships, including electricity consumption
      of third parties that operate within the area of influence of the port authority.

     The categories in this scope are organized considering the management system of the port authority.
This includes direct fuel consumption (diesel and gas), transport (ship traffic and land transport),
and dealership electricity. Subcategories have been defined for a better description and analysis.
     The categories defined that are included in the scope are described in Table 1.

                                           Table 1. Scopes and categories defined.

           Scope                    Category                       Subcategory                  Unit
                             Diesel consumption                          -                       l
              1             Gasoline consumption                         -                       l
                              Gas consumption                            -                      kWh
                                                                     Lighting                   kWh
                                    Buildings
                                                                 Air conditioning               kWh
              2               Stockyard and vial
                                                                         -                      kWh
                                   lighting
                                     Others                              -                      kWh
                                                            Business-oriented activities          l
                             Diesel consumption              Service-oriented activities          l
                                                                  Other activities                l
                               Gas consumption              Business-oriented activities        kWh
                                                                 Container ships           Number of ships
                                                                  Cruise ships             Number of ships
              3                    Ship traffic                      Ferris                Number of ships
                                                                  Other ships              Number of ships
                                                                 Auxiliary tugs            Number of tugs
                             Transport within the
                                                                         -                       km
                               freight terminal
                                                            Business-oriented activities        kWh
                             Dealership electricity          Service-oriented activities        kWh
                                                                  Other activities              kWh

     The greenhouse gases considered were carbon dioxide (CO2 ), methane (CH4 ), and nitrous oxide
(N2 O) produced during the electricity generation and associated with fuel consumption (gas, gasoline,
and diesel).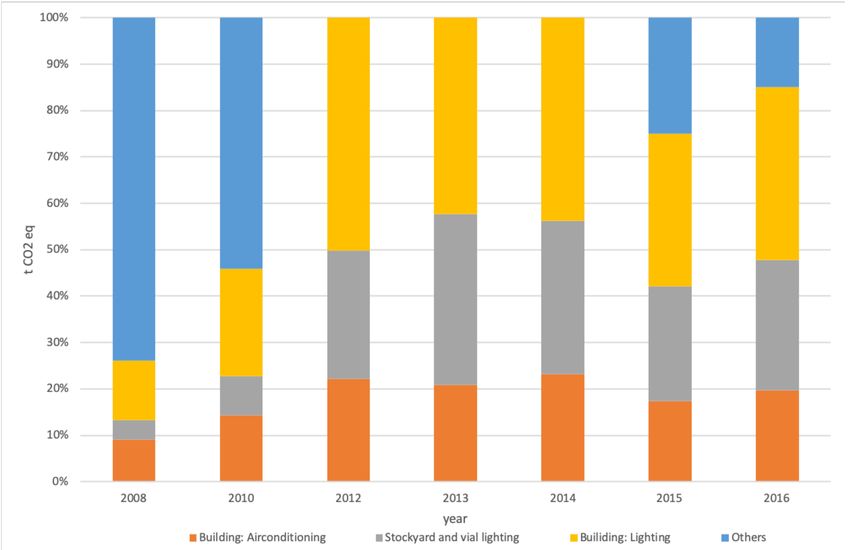
Int. J. Environ. Res. Public Health 2020, 17, 8157                                                6 of 16

2.2. Carbon Footprint Assessment Method
     The methodology defined by the Spanish Ministry for Ecological Transition and Demographic
Challenge was followed [32], and scope 3 was introduced, as the original methodology does not
include it. The port authority’s carbon footprint refers to the total greenhouse gas emissions from all
the categories included in the previously defined scope. The formula applied for the calculation is
as follows:
                         Xn            Xn
                   CF =      GHGEi =        ECO2 + ECH4 ·GWPCH4 + EN2 O ·GWPN2 O                    (1)
                                                                                    i
                                 i=1                 i

where CF stands for the carbon footprint, GHGE is greenhouse gas emissions, E represents emissions,
GWP is the global warming potential of the gas identify as the subindex, and i identifies each category
or subcategory, if any. Emissions for each greenhouse gas is assessed as follows:

                                                         E g = Ci ·EFi,g                             (2)

where g stands for each gas (CO2 , CH4 , and N2 O), C stands for the consumption associated with each
category, and EF represents the gas emission factor for the i category. Emission factors were obtained
from the Spanish Ministry for Ecological Transition and Demographic Challenge [32,33]. Emissions
factors for each year assessed and its source are described in Appendix A.

2.3. Data
     The data used in this study for scope 1 and 2 were obtained from either the accounting system
(invoices) or meters (fuel dispensers). Estimations were made for scope 3 based on the port’s activity
registers and machinery and ships’ technical information.
     Although the port’s environmental management system was implemented in 2008, it was improved
in 2012, allowing annual data for energy consumption. The assessment was carried for 2008, 2010,
2012, 2013, 2014, 2015, and 2016.

3. Results and Discussion
     This section shows the results obtained for assessing the carbon footprint of the port authority of
Valencia in the years 2008, 2010, 2012, 2013, 2014, 2015, and 2016 by scope (Figure 3). The green line
(secondary axe) shows the evolution of the carbon footprint in kg CO2 eq by ton managed in the port.
This value includes bulk cargo (liquid and solid), containerized and non-containerized goods, and fish
catches and supplies.
     The scope that improved the most was scope 2, reducing its carbon footprint by 57.78% between
2008 and 2016. Scope 1 had a significant improvement of 28.98%; however, the carbon footprint of
scope 3 increased by 2.49%.
     It should be highlighted that scope 3 was, by far, the scope with the highest representation in the
overall results, with 97% on average during the period under analysis. Total emissions (grey line) only
decreased by 0.22% between 2008 and 2016. However, it should be considered that the activity of the
port increased by 24.33%, moving more than 64 million tons in 2016. As a result of several projects
implemented to improve the process’s energy efficiency within the port [34], cargo’s carbon footprint
decreased by 19.75%.
     Figures 4–6 allow a more in-depth analysis by breaking down categories and subcategories of
each scope.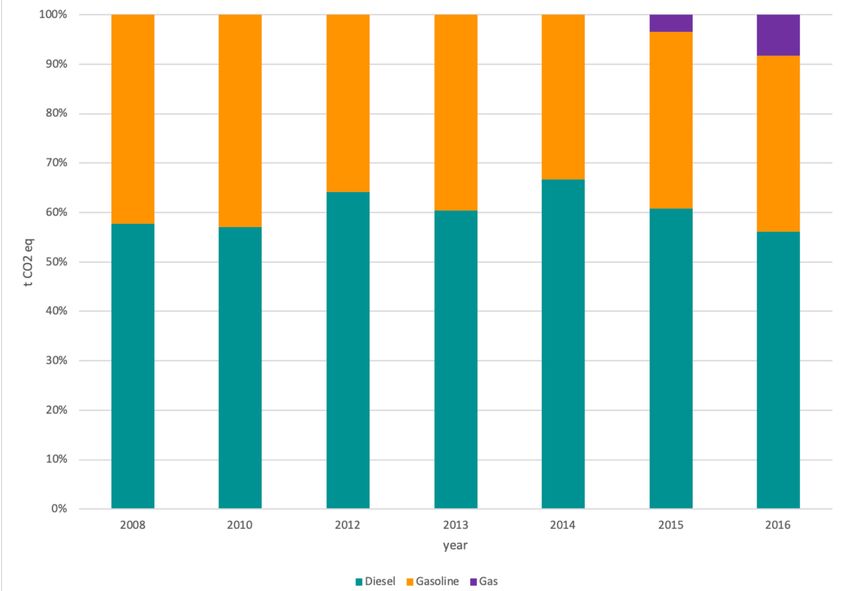
Int. J. Environ. Res. Public Health 2020, 17, 8157                                                          7 of 16

           Figure 3. The carbon footprint of the port authority of Valencia (Spain) by year and category.

                                    Figure 4. Categories breakdown for scope 1 by year.
Int. J. Environ. Res. Public Health 2020, 17, 8157 8 of 16
Figure 5. Categories breakdown for scope 2 by year.
Figure 6. Categories breakdown for scope 3 by year.
The carbon footprint related to diesel consumption was the most significant, although gasoline
can represent 40% of the total. Gas was introduced as a fuel for activities related to scope 1 in the lastInt. J. Environ. Res. Public Health 2020, 17, 8157 9 of 16
two years analyzed; this is why it did not appear in previous years. However, the impact was less than
10%.
Scope 2 results offered more variation than scope 1. It can be seen that the “others” category,
including the consumption of electricity by industrial machinery, had a significant representation in
the first two years of analysis and appeared again in the last two. This subcategory includes cranes,
pumps, and forklift trucks operated by the different terminals personnel within the port under the
Valencia Port Authority domain.
Scope 3 is the one with more categories and subcategories. Additionally, it is the scope with
less precision, as it is challenging to collect the data directly. In this case, the ship traffic category’s
consumption and emissions were estimated using the direct traffic data and each type of ship’s
consumption index based on technical sheets. The rest of the data was obtained from third-party
companies’ different responses, although it was not possible to verify it directly.
However, as shown in Figure 2, it had a significant impact on the carbon footprint of the object of
study, the Valencia Port, deserving a detailed analysis. Two categories stand out: ship traffic emissions
and the electricity consumed by dealerships.
The carbon footprint associated with container ships’ traffic increased by 35.48% between 2008
and 2016, while the emissions associated with ferries’ traffic increased by 21.34%. The carbon footprint
of the traffic of cruises and auxiliary tugs increased by 15.34% and 9.98%, respectively. However,
the subcategory of “traffic of other ships” decreased by 15.86%. As this category represents the 20%
in energy consumption of the ship traffic category, the result of the category implies an increase of
only 20%. This value does not imply a significant growth as the activity rises 24.33% during the
analysis period.
Regarding the electricity consumed by dealerships, the increase reached 29%. The subcategory
of business-oriented activities represented 30.81%, and another rise of 18.76% responded to
service-oriented activities. Only the subcategory of other activities decreased; in this case, 5.16%.
A second assessment was made applying the emission factors of 2008 (first year of study) to all the
period under analysis (Figure 7). The energy consumption [24] was also included in this assessment
for comparative purposes.
Figure 7. Results of complementary analysis: using constant factors (2008) and energy consumption.
The results of this second assessment are particularly interesting for the port authority and the
port managers. Maintaining factors constant since the base year isolated the results of their initiatives
and projects to improve the port’s environmental performance [24] from external factors that they
cannot control as the region’s electrical mix or some political decisions regarding the consideration of
categories. The influence of these external factors is evidenced in this figure.Int. J. Environ. Res. Public Health 2020, 17, 8157 10 of 16
The similarity between the evolution of energy consumption and the evolution of the carbon
footprint is also interesting. Although the Port Authority of Valencia implemented several projects
during the period assessed seeking environmental improvement, none of these projects included
a change in the electricity source, a guarantee for a renewable energy source, or self-consumption
projects [34]. This is why both variables were strictly linked, although, of course, they developed in
different scales.
4. Conclusions
In recent years, the Port of Valencia has made a notable effort to reduce emissions generated by the
port activity. Proof of this is that in the last six years, they managed to decrease their carbon footprint
by 17% if emission factors in 2008 remained consistent during the assessment. The reduction was less
than 1% if each year was assessed with their correspondent emissions factors. However, it was a good
result considering that the port traffic had experienced a 24% growth during this period. Although
significant improvements were made in the port, there was a wide margin for improvement in the
activities’ sustainability.
Indirect emissions of machinery, vehicles, and ships, including electricity (scope 3), significantly
impacted footprint results. Containers and cruise traffic was responsible for almost 40% of the CO2
eq emissions in this scope. The auxiliary engines of those ships that operate inside the port area had
higher power than the rest of the equipment that influenced scope 3. The number of the ships was
much greeter than the in-land machinery park and power of the port authority. This is why scope 3
was the main emitter.
The electrical machinery of terminals within the port was responsible for the greatest impact
in scope 2 and lighting in buildings. As far as direct emissions in the infrastructures, machinery,
and vehicles (scope 1) concern, diesel consumption overcome the impact of gasoline consumption.
Gas had only a small effect on the last years.
Indirect emissions (scope 3) had the most significant impact, with 97% of the emissions, on average,
during the period under analysis. This is why this scope should be the main focus of new policies
seeking an improvement in the port authority’s environmental performance. Considering that the
organization’s influence over the elements of scope 3 was not direct, implementing projects to improve
minimization of the emissions of this scope was challenging.
Although the carbon footprint results obtained did not fit the methodology applied, where factors
should be yearly updated, they are still beneficial for decision-making processes. Further studies
should include the assessment of carbon footprint in different scenarios, for example, by replacing
diesel with LNG.
Author Contributions: Conceptualization, M.Á.A.-R., and V.C.B.; methodology, V.C.B.; validation, V.G.L.-I.-F.,
and S.F.C.-R.; formal analysis, V.C.B.; investigation, M.Á.A.-R., and V.C.B.; resources, V.C.B.; data curation,
V.G.L.-I.-F.; writing—original draft preparation, V.G.L.-I.-F.; writing—review and editing, V.G.L.-I.-F.; visualization,
V.G.L.-I.-F.; supervision, S.F.C.-R.; project administration, V.C.B.; funding acquisition, V.C.B. All authors have read
and agreed to the published version of the manuscript.
Funding: This research received no external funding.
Acknowledgments: Authors want to thank the Valencia Port Authority for their collaboration in the data
collection process. Special thanks to Federico Torres Monfort, Alicia Martí, Pilar Sánchez and Rafael Company for
their support.
Conflicts of Interest: The authors declare no conflict of interest.
Appendix A
This appendix gathers the emissions factors applied for the study.Int. J. Environ. Res. Public Health 2020, 17, 8157 11 of 16
Table A1. Emission factors by categories for CO2 (kg/L). Main source [32].
Scope Category and Subcategory 2008 2010 2012 2013 2014 2015 2016
Diesel 2.708 2.708 2.708 2.708 2.708 2.708 2.708
1 Gasoline 2.295 2.295 2.201 2.205 2.205 2.205 2.205
Gas 0 0 0 0 0 0.182 0.182
Building: Lighting 0.39 0.31 0.24 0.36 0.37 0.4 0.4
Stockyard and vial lighting 0.39 0.31 0.24 0.36 0.37 0.4 0.4
2 Building: Air-conditioning 0.39 0.31 0.24 0.36 0.37 0.4 0.4
Others 0.39 0.31 0.24 0.36 0.37 0.4 0.4
Diesel: Business-oriented activities 2.708 2.708 2.708 2.708 2.708 2.708 2.708
Diesel: Service-oriented activities 2.708 2.708 2.708 2.708 2.708 2.708 2.708
Gas (1) 0.182 0.201799 0.201799 0.201799 0.201799 0.201799 0.201799
Main engine: 0.6515
Ship traffic: Containers (1)
Auxiliary engine: 0.683
Main engine: 0.6515
Ship traffic: Cruises (1)
Auxiliary engine: 0.683
Main engine: 0.6515
3 Ship traffic: Ferris (1)
Auxiliary engine: 0.683
Main engine: 0.6515
Ship traffic: Others (1)
Auxiliary engine: 0.683
Main engine: 0.6515
Ship traffic: Auxiliary tugs (1)
Auxiliary engine: 0.683
Transport within the freight terminal 2.708 2.708 2.708 2.708 2.708 2.708 2.708
Dealership electricity:
0.39 0.31 0.4 0.36 0.37 0.4 0.4
Business-oriented activities
Dealership electricity: Service-oriented
0.39 0.31 0.4 0.36 0.37 0.4 0.4
activities
Dealership electricity: Other activities 0.39 0.31 0.4 0.36 0.37 0.4 0.4
(1). Source [34].
Table A2. Emission factors by categories for CH4 (kg/kWh). Source [34].
Category and
Scope 2008 2010 2012 2013 2014 2015 2016
Subcategory
Diesel 1.4 × 10⁻⁵ 1.4 × 10⁻⁵ 1.4 × 10⁻⁵ 1.4 × 10⁻⁵ 1.4 × 10⁻⁵ 1.4 × 10⁻⁵ 1.4 × 10⁻⁵
1 Gasoline 1 1 1 1 1 1 1
Gas 3.6 × 10⁻⁶ 3.6 × 10⁻⁶ 3.6 × 10⁻⁶ 3.6 × 10⁻⁶ 3.6 × 10⁻⁶ 3.6 × 10⁻⁶ 3.6 × 10⁻⁶
Building: Lighting 2.5 × 10⁻⁶ 2.5 × 10⁻⁶ 2.5 × 10⁻⁶ 2.5 × 10⁻⁶ 2.5 × 10⁻⁶ 2.5 × 10⁻⁶ 2.5 × 10⁻⁶
Stockyard and vial
2.5 × 10⁻⁶ 2.5 × 10⁻⁶ 2.5 × 10⁻⁶ 2.5 × 10⁻⁶ 2.5 × 10⁻⁶ 2.5 × 10⁻⁶ 2.5 × 10⁻⁶
lighting
2
Building:
2.5 × 10⁻⁶ 2.5 × 10⁻⁶ 2.5 × 10⁻⁶ 2.5 × 10⁻⁶ 2.5 × 10⁻⁶ 2.5 × 10⁻⁶ 2.5 × 10⁻⁶
Air-conditioning
Others 2.5 × 10⁻⁶ 2.5 × 10⁻⁶ 2.5 × 10⁻⁶ 2.5 × 10⁻⁶ 2.5 × 10⁻⁶ 2.5 × 10⁻⁶ 2.5 × 10⁻⁶Int. J. Environ. Res. Public Health 2020, 17, 8157 12 of 16
Table A2. Cont.
Category and
Scope 2008 2010 2012 2013 2014 2015 2016
Subcategory
Diesel:
Business-oriented 1.4 × 10⁻⁵ 1.4 × 10⁻⁵ 1.4 × 10⁻⁵ 1.4 × 10⁻⁵ 1.4 × 10⁻⁵ 1.4 × 10⁻⁵ 1.4 × 10⁻⁵
activities
Diesel:
Service-oriented 1.4 × 10⁻⁵ 1.4 × 10⁻⁵ 1.4 × 10⁻⁵ 1.4 × 10⁻⁵ 1.4 × 10⁻⁵ 1.4 × 10⁻⁵ 1.4 × 10⁻⁵
activities
Gas 3.6 × 10⁻⁶ 3.6 × 10⁻⁶ 3.6 × 10⁻⁶ 3.6 × 10⁻⁶ 3.6 × 10⁻⁶ 3.6 × 10⁻⁶ 3.6 × 10⁻⁶
Ship traffic: Main engine: 0.000011
Containers Auxiliary engine: 0.000008
Main engine: 0.000011
Ship traffic: Cruises
Auxiliary engine: 0.000008
Main engine: 0.000011
Ship traffic: Ferris
Auxiliary engine: 0.000008
Main engine: 0.000011
Ship traffic: Others
Auxiliary engine: 0.000008
3
Ship traffic: Main engine: 0.000011
Auxiliary tugs Auxiliary engine: 0.000008
Transport within the
1.4 × 10⁻⁵ 1.4 × 10⁻⁵ 1.4 × 10⁻⁵ 1.4 × 10⁻⁵ 1.4 × 10⁻⁵ 1.4 × 10⁻⁵ 1.4 × 10⁻⁵
freight terminal
Dealership
electricity:
2.5 × 10⁻⁶ 2.5 × 10⁻⁶ 2.5 × 10⁻⁶ 2.5 × 10⁻⁶ 2.5 × 10⁻⁶ 2.5 × 10⁻⁶ 2.5 × 10⁻⁶
Business-oriented
activities
Dealership
electricity:
2.5 × 10⁻⁶ 2.5 × 10⁻⁶ 2.5 × 10⁻⁶ 2.5 × 10⁻⁶ 2.5 × 10⁻⁶ 2.5 × 10⁻⁶ 2.5 × 10⁻⁶
Service-oriented
activities
Dealership
electricity: Other 2.5 × 10⁻⁶ 2.5 × 10⁻⁶ 2.5 × 10⁻⁶ 2.5 × 10⁻⁶ 2.5 × 10⁻⁶ 2.5 × 10⁻⁶ 2.5 × 10⁻⁶
activities
Table A3. Emission factors by categories for N2 O (kg/kWh). Source [34].
Category and
Scope 2008 2010 2012 2013 2014 2015 2016
Subcategory
Diesel 1.4 × 10⁻⁵ 1.4 × 10⁻⁵ 1.4 × 10⁻⁵ 1.4 × 10⁻⁵ 1.4 × 10⁻⁵ 1.4 × 10⁻⁵ 1.4 × 10⁻⁵
1 Gasoline 1 1 1 1 1 1 1
Gas 3.6 × 10⁻⁷ 3.6 × 10⁻⁷ 3.6 × 10⁻⁷ 3.6 × 10⁻⁷ 3.6 × 10⁻⁷ 3.6 × 10⁻⁷ 3.6 × 10⁻⁷
Building: Lighting 5.07 × 10⁻⁷ 5.07 × 10⁻⁷ 5.07 × 10⁻⁷ 5.07 × 10⁻⁷ 5.07 × 10⁻⁷ 5.07 × 10⁻⁷ 5.07 × 10⁻⁷
2 Stockyard and vial
5.07 × 10⁻⁷ 5.07 × 10⁻⁷ 5.07 × 10⁻⁷ 5.07 × 10⁻⁷ 5.07 × 10⁻⁷ 5.07 × 10⁻⁷ 5.07 × 10⁻⁷
lighting
Building:
5.07 × 10⁻⁷ 5.07 × 10⁻⁷ 5.07 × 10⁻⁷ 5.07 × 10⁻⁷ 5.07 × 10⁻⁷ 5.07 × 10⁻⁷ 5.07 × 10⁻⁷
Air-conditioning
Others 5.07 × 10⁻⁷ 5.07 × 10⁻⁷ 5.07 × 10⁻⁷ 5.07 × 10⁻⁷ 5.07 × 10⁻⁷ 5.07 × 10⁻⁷ 5.07 × 10⁻⁷Int. J. Environ. Res. Public Health 2020, 17, 8157 13 of 16
Table A3. Cont.
Category and
Scope 2008 2010 2012 2013 2014 2015 2016
Subcategory
Diesel:
Business-oriented 1.4 × 10⁻⁵ 1.4 × 10⁻⁵ 1.4 × 10⁻⁵ 1.4 × 10⁻⁵ 1.4 × 10⁻⁵ 1.4 × 10⁻⁵ 1.4 × 10⁻⁵
activities
Diesel:
Service-oriented 1.4 × 10⁻⁵ 1.4 × 10⁻⁵ 1.4 × 10⁻⁵ 1.4 × 10⁻⁵ 1.4 × 10⁻⁵ 1.4 × 10⁻⁵ 1.4 × 10⁻⁵
activities
Gas 3.6 × 10⁻⁷ 3.6 × 10⁻⁷ 3.6 × 10⁻⁷ 3.6 × 10⁻⁷ 3.6 × 10⁻⁷ 3.6 × 10⁻⁷ 3.6 × 10⁻⁷
Ship traffic: Main engine: 3.6 × 10⁻⁵
Containers Auxiliary engine: 3.6 × 10⁻⁵
Main engine: 3.6 × 10⁻⁵
Ship traffic: Cruises
Auxiliary engine: 3.6 × 10⁻⁵
Main engine: 3.6 × 10⁻⁵
Ship traffic: Ferris
Auxiliary engine: 3.6 × 10⁻⁵
Main engine: 3.6 × 10⁻⁵
Ship traffic: Others
3 Auxiliary engine: 3.6 × 10⁻⁵
Ship traffic: Main engine: 3.6 × 10⁻⁵
Auxiliary tugs Auxiliary engine: 3.6 × 10⁻⁵
Transport within the
1.4 × 10⁻⁵ 1.4 × 10⁻⁵ 1.4 × 10⁻⁵ 1.4 × 10⁻⁵ 1.4 × 10⁻⁵ 1.4 × 10⁻⁵ 1.4 × 10⁻⁵
freight terminal
Dealership
electricity:
2.5 × 10⁻⁶ 2.5 × 10⁻⁶ 2.5 × 10⁻⁶ 2.5 × 10⁻⁶ 2.5 × 10⁻⁶ 2.5 × 10⁻⁶ 2.5 × 10⁻⁶
Business-oriented
activities
Dealership
electricity:
2.5 × 10⁻⁶ 2.5 × 10⁻⁶ 2.5 × 10⁻⁶ 2.5 × 10⁻⁶ 2.5 × 10⁻⁶ 2.5 × 10⁻⁶ 2.5 × 10⁻⁶
Service-oriented
activities
Dealership
electricity: Other 2.5 × 10⁻⁶ 2.5 × 10⁻⁶ 2.5 × 10⁻⁶ 2.5 × 10⁻⁶ 2.5 × 10⁻⁶ 2.5 × 10⁻⁶ 2.5 × 10⁻⁶
activities
This appendix reports the input data used for the carbon footprint assessment by scope. The data
source is the annual memories of the authority [31].
Table A4. Energy consumption for scope 1 in kWh. Source [31].
Category and Subcategory 2008 2010 2012 2013 2014 2015 2016
Diesel 491,754 477,180 497,802 421,342 408,149 367,920 336,702
Gasoline 391,200 391,776 313,274 311,186 226,628 241,176 239,986
Gas 74,925
Table A5. Energy consumption for scope 2 in kWh. Source [31].
Category and Subcategory 2008 2010 2012 2013 2014 2015 2016
Building: Lighting 2,475,441 2,533,209 2,470,830 1,947,924 2,291,604 2,688,823 3,309,970
Stockyard and vial lighting 815,135 931,076 1,361,472 1,691,063 1,726,301 2,025,532 2,493,452
Building: Air-conditioning 1,758,958 1,568,362 1,090,042 957,298 1,212,039 1,422,130 1,750,657
Others 14,348,356 5,947,697 4,233,146 3,775,225 2,047,206 1,320,876Int. J. Environ. Res. Public Health 2020, 17, 8157 14 of 16
Table A6. Energy consumption for scope 3 in kWh. Source [35].
Category and Subcategory 2008 2010 2012 2013 2014 2015 2016
Diesel: Business-oriented activities 156,645,968 127,942,305 132,210,151 112,941,714 113,283,157 122,465,919 121,392,432
Diesel: Service-oriented activities 4,512,170 4,429,032 4,628,324 4,197,734 4,210,431 5,173,962 5,523,957
Gas 42,678,242
Ship traffic: Containers 65,179,562 80,481,812 79,428,691 73,822,114 79,232,468 80,692,970 88,305,890
Ship traffic: Cruises 2,667,136 3,001,279 3,620,179 3,641,971 3,218,228 2,953,239 3,077,725
Ship traffic: Ferris 5,578,318 3,992,083 4,213,405 5,063,270 4,539,293 6,415,669 6,769,348
Ship traffic: Others 25,041,144 22,588,369 22,224,802 20,217,055 32,416,833 24,758,886 21,071,067
Ship traffic: Auxiliary tugs 33,010,751 43,407,685 44,930,046 34,790,620 35,736,813 38,368,539 36,305,933
Transport within the freight terminal 73,131,420 66,084,288 70,722,884 72,621,853 69,415,324 74,279,372 76,978,166
Dealership electricity: Business-oriented activities 37,327,720 48,320,266 49,493,493 46,184,817 49,396,752 52,247,123 52,895,613
Dealership electricity: Service-oriented activities 1,104,442 1,419,682 1,553,712 1,585,647 1,586,003 1,482,932 1,420,833
Dealership electricity: Other activities 1,765,939 2,337,623 2,117,578 2,090,481 1,955,782 2,147,321 1,814,322
References
1. Visor Cartográfic de la Generalitat. Available online: http://visor.gva.es/visor/ (accessed on 5 October 2020).
2. Eurostat. Available online: https://appsso.eurostat.ec.europa.eu/nui/submitViewTableAction.do (accessed on
15 July 2020).
3. European Commission. EMAS Register. Available online: https://webgate.ec.europa.eu/emas2/public/
registration/list (accessed on 15 July 2020).
4. Autoridad Portuaria de Valencia (Valencia Port Authority). Environmental Statement 2018. Available online:
https://www.valenciaport.com/wp-content/uploads/Memoria-Ambiental-2018ENG.pdf (accessed on 15
July 2020).
5. Li, Y.; Wang, Y.; He, Q.; Yang, Y. Calculation and Evaluation of Carbon Footprint in Mulberry Production:
A Case of Haining in China. IJERPH 2020, 17, 1339. [CrossRef] [PubMed]
6. Bloomberg, M. 2019 Status Report. The Task Force on Climate-Related Financial Disclosures. 2019.
Available online: https://www.fsb-tcfd.org/publications/tcfd-2019-status-report/ (accessed on 15 July 2020).
7. Jalkanen, J.P.; Johansson, L.; Kukkonen, J. A comprehensive inventory of ship traffic exhaust emissions in the
European sea areas in 2011. Atmos. Chem. Phys. 2016, 16, 71–84. [CrossRef]
8. Carballo-Penela, A.; Mateo-Mantecón, I.; Doménech, J.L.; Coto-Millán, P. From the motorways of the sea to
the green corridors’ carbon footprint: The case of a port in Spain. JEPM 2012, 55, 765–782. [CrossRef]
9. Veidenheimer, K. Carbon Dioxide Emissions in Maritime Container Transport and Comparison of European Deepwater
Ports: CO2 Calculation Approach, Analysis and CO2 Reduction Measures; Anchor Academic Publishing: Hamburg,
Germany, 2014; ISBN 978-3-95489-703-2.
10. International Standard Organization ISO 14067:2018 Greenhouse Gases—Carbon Footprint of
Products—Requirements and Guidelines for Quantification. Available online: https://www.iso.org/standard/
71206.html (accessed on 15 July 2020).
11. British Standard Institution. PAS 2050:2011: Specification for the Assessment of the Life Cycle Greenhouse Gas;
Emissions of Goods and Services. Available online: https://shop.bsigroup.com/upload/shop/download/pas/
pas2050.pdf (accessed on 15 July 2020).
12. Pepper, W.; Leggett, J.A.; Swarf, R.J.; Wasson, J.; Edmonds, J.; Minzel, I. Emission Scenarios for the
IPCC; Assumption methodology and Results; Support Document for Chapter A3. In Climate Change 1992:
Supplementary Report to the IPCC Scientific Assessment; Houghton, J.T., Callandar, B.A., Varney, S.K., Eds.;
Cambridge University Press: Cambridge, UK, 1992.
13. Schmalensee, R.; Stocker, T.M.; Judson, R.A. World carbon dioxide emissions: 1950–2050. Rev. Econ. Stat.
1998, 80, 15–27. [CrossRef]
14. Smith, T.W.P.; Jalkanen, J.P.; Anderson, B.A.; Corbett, J.J.; Faber, J.; Hanayama, S.; O’Keeffe, E.; Parker, S.;
Johansson, L.; Aldous, L.; et al. Third IMO GHG Study 2014; International Maritime Organization (IMO):
London, UK, 2014.
15. Dore, A.J.; Vieno, M.; Tang, Y.S.; Dragosits, U.; Dosio, A.; Weston, K.J.; Sutton, M.A. Modelling the atmospheric
transport and deposition of sulphur and nitrogen over the United Kingdom and assessment of the influence
of SO2 emissions from international shipping. Atmos. Environ. 2007, 41, 2355–2367. [CrossRef]Int. J. Environ. Res. Public Health 2020, 17, 8157 15 of 16
16. Doudnikoff, M.; Lacoste, R. Effect of a speed reduction of containerships in response to higher energy costs
in Sulphur Emission Control Areas. Transp. Res. Part D Transp. Environ. 2014, 27, 19–29. [CrossRef]
17. Braathen, N. (Ed.) Environmental Impacts of International Shipping: The Role of Ports; OECD Publishing: Paris,
France, 2011. [CrossRef]
18. Hongisto, M. Impact of the emissions of international sea traffic on airborne deposition to the Baltic Sea and
concentrations at the coastline. Oceanologia 2014, 56, 349–372. [CrossRef]
19. Lee, P.T.W.; Hu, K.C.; Chen, T. External Costs of Domestic Container Transportation: Short Sea Shipping
versus Trucking in Taiwan. Transp. Rev. 2010, 30, 315–335. [CrossRef]
20. Medda, F.; Lourdes, T. Short-sea shipping: An analysis of its determinants. Marit. Policy Manag. 2010,
37, 285–303. [CrossRef]
21. Ignaccolo, M.; Inturri, G.; Le Pira, M. Framing Stakeholders Involvement in Sustainable Port Planning.
TOMS 2018, 7, 136–142. [CrossRef]
22. I Care & Consult. Carbon Emissions Study in the European Straits of the PASSAGE Project.
2018. Available online: https://www.interregeurope.eu/fileadmin/user_upload/tx_tevprojects/library/file_
1528203599.pdf (accessed on 15 July 2020).
23. Vasanth Sean Chowhan, M.; Hiremath, A.M.; Asolekar, S.R. Carbon Footprint of Container Terminal Port in
Mumbai; International Conference on Impact of climate change on Food, Energy and Environment. Elsevier.
2013, pp. 159–166, ISBN 978-93-510710-1-3. Available online: https://www.researchgate.net/publication/
269702576_Carbon_Footprinting_of_Container_Terminal_Ports_in_Mumbai (accessed on 15 July 2020).
24. Cloquell Ballester, V.; Cloquell Ballester, V.; Santamarina Siurana, C.; Surana Vicent, M. Calculation of the
Carbon Footprint in Mediterranean Ports: Results of the Climaport Project. In In Proceedings of the 17th
International Congress on Project Management and Engineering, Logroño, Spain, 17–19 July 2013. Available
online: https://www.aeipro.com/files/congresos/2013logronio/CIDIP2013_0767_0779.4005.pdf (accessed on
15 July 2020).
25. Chan, M.; Lek, R. Jurong Port. Carbon Footprint Report 2010. 2011. Available online: https://esi.nus.edu.sg/
publications/esi-publications/publication/2015/12/18/jurong-port-carbon-footprint-report-2010 (accessed on
15 July 2020).
26. Port of Los Angeles. Tool to Assess Global Warming at Port Facilities. 2011. Available online: https:
//www.portoflosageneles.org/references/news_112911_calculator (accessed on 15 July 2020).
27. Company Peris. R. Carbon Footprint a Key in Port Sustainability. CIP 2017. 14–15. Available online:
https://issuu.com/revistacip3/docs/revista_cip_06_octubre_2017 (accessed on 15 July 2020).
28. Mamtok, Y.; Huag, Y.; Jin, C.; Cheng, X. A system dynamics model for CO2 mitigation strategies at the
container seaport. Sustainability 2019, 11, 2806. [CrossRef]
29. Azarkaand, S.; Wooldridge, C.; Darbra, R.M. Review of Initiatives and Methodologies to Reduce CO2
Emissions and Climate Change Effects in Ports. IJERPE 2020, 17, 3858. [CrossRef] [PubMed]
30. ValenciaPort. Guía de Cálculo Guía Para el Cálculo y Gestión de la Huella de Carbono en Instalaciones
Portuarias Por Niveles. 2012. Available online: https://www.valenciaport.com/wp-content/uploads/guia-
calculo-gestion-huella-carbono.pdf (accessed on 15 July 2020).
31. Autoridad Portuaria de Valencia (Valencia Port Authority). Memoria Verificación Gases Efecto Invernadero.
Puerto de Valencia; Valencia. Year 2008–2016. Available online: https://www.valenciaport.com/en/
publicaciones/ (accessed on 15 July 2020).
32. Ministry for Ecological Transition and Demographic Challenge. Available online: https:
//www.miteco.gob.es/en/ministerio/default.aspxhttps://www.miteco.gob.es/es/cambio-climatico/temas/
mitigacion-politicas-y-medidas/instruccionescalculadorahc_tcm30-485627.pdf (accessed on 15 July 2020).
33. Boletín Oficial del Estado. Real Decreto 163/2014, de 14 de Marzo, por el que se Crea el Registro de Huella
de Carbono, Compensación y Proyectos de Absorción de Dióxido de Carbono. 2014. Available online:
https://www.boe.es/diario_boe/txt.php?id=BOE-A-2014-3379 (accessed on 15 July 2020).
34. Eggleston, H.S.; Buendia, L.; Miwa, K.; Ngara, T.; Tanabe, K. 2006 IPCC Guidelines for National Greenhouse
Gas Inventories. Japan: N. p., 2006. Available online: https://www.ipcc-nggip.iges.or.jp/public/2006gl/
(accessed on 15 July 2020).Int. J. Environ. Res. Public Health 2020, 17, 8157 16 of 16
35. Cloquell-Ballester, V.; Lo-Iacono-Ferreira, V.G.; Artacho-Ramírez, M.Á.; Capuz-Rizo, S.F. (RUE Index as
a Tool to Improve the Energy Intensity of Container Terminals—Case Study at Port of Valencia. Energies
2020, 13, 2556. [CrossRef]
Publisher’s Note: MDPI stays neutral with regard to jurisdictional claims in published maps and institutional
affiliations.
© 2020 by the authors. Licensee MDPI, Basel, Switzerland. This article is an open access
article distributed under the terms and conditions of the Creative Commons Attribution
(CC BY) license (http://creativecommons.org/licenses/by/4.0/).You can also read