Analysing urban traflc volumes and mapping noise emissions in Rome (Italy) in the context of containment measures for the COVID-19 disease - De ...
←
→
Page content transcription
If your browser does not render page correctly, please read the page content below
Noise Mapp. 2020; 7:114–122

Research Article

Francesco Aletta, Stefano Brinchi, Stefano Carrese, Andrea Gemma, Claudia Guattari, Livia
Mannini, and Sergio Maria Patella*

Analysing urban traflc volumes and mapping
noise emissions in Rome (Italy) in the context of
containment measures for the COVID-19 disease
https://doi.org/10.1515/noise-2020-0010                              36 more cases, none of whom had contact with the first pa-
Received Jun 29, 2020; accepted Jun 29, 2020                         tient or with anyone known to have COVID-19. This was the
                                                                     beginning of one of the largest and most serious clusters of
Abstract: This study presents the result of a traffic simula-
                                                                     COVID-19 in the world [1]. Italy has had 221,216 confirmed
tion analysis based on Floating Car Data and a noise emis-
                                                                     cases according to the Italian Ministry of Health [2], as of
sion assessment to show the impact of mobility restric-
                                                                     May 12, 2020, 17:00 h, and 30,911 deaths.
tion for COVID-19 containment on urban vehicular traffic
                                                                          As reported by [3], the Decree issued on 8 March
and road noise pollution on the road network of Rome,
                                                                     2020 [4] provides urgent measures to combat and contain
Italy. The adoption of strong and severe measures to con-
                                                                     the spread of the COVID-19 virus in Lombardy and in the
tain the spreading of Coronavirus during March-April 2020
                                                                     cities of: Modena, Parma, Piacenza, Reggio Emilia, Rim-
generated a significant reduction in private vehicle trips
                                                                     ini, Pesaro–Urbino, Alessandria, Asti, Novara, Verbano-
in the city of Rome (-64.6% during the lockdown). Traffic
                                                                     Cusio-Ossola, Vercelli, Padova, Treviso, Venezia. The De-
volumes, obtained through a simulation approach, were
                                                                     cree issued on 9 March 2020 [5] extended to the whole
used as input parameters for a noise emission assessment
                                                                     national territory the restrictive measures envisaged by
conducted using the CNOSSOS-EU method, and an overall
                                                                     the previous Decree. The Decree provides that any move-
noise emissions reduction on the entire road network was
                                                                     ment of physical persons (both within the national terri-
found, even if its extent varied between road types.
                                                                     tory and entering/exiting the country) must be avoided, ex-
Keywords: COVID-19; Italy’s coronavirus epidemic; Con-               cept for proven work-related needs, situations of necessity
tainment Strategies; Transport Restriction; Traffic Simula-          or health reasons.
tion; Floating Car Data; Noise mapping; Urban Noise Pol-                  As part of these social distancing policies, the Ital-
lution                                                               ian Government encouraged people to stay at home; any
                                                                     gathering in public spaces was forbidden, including sport-
                                                                     ing events and funerals; cancelled or postponed large
                                                                     public events; schools, universities, government offices,
1 Introduction
                                                                     libraries, museums, and most shops had to stay closed.
                                                                     Those selling essentials, such as supermarkets or phar-
On February 20/2020, a young man in the Lombardy region
                                                                     macies, needed to ensure a distance of at least 1 m be-
of Italy was admitted with an atypical pneumonia that
                                                                     tween customers. On April 10th the restrictive measures
later proved to be COVID-19. In the next 24 hours there were
                                                                     adopted since the beginning of March to contain the Covid-
                                                                     19 emergency were prolonged until 3rd May 2020. Such con-
                                                                     tainment measures and changes in social behaviour and
*Corresponding Author: Sergio Maria Patella: Faculty of Eco-
                                                                     awareness have progressively reduced the transmission,
nomics, Universitas Mercatorum, Piazza Mattei, 10, 00186 Rome,
Italy; Email: sergiomaria.patella@unimercatorum.it                   and the growth rate of total COVID-19 cases in Italy began
Francesco Aletta: Institute for Environmental Design and Engineer-   slowing [6]. The Italian epidemic curve, as of May 12, is
ing, The Bartlett, University College London – 14 Upper Woburn       shown in Figure 1.
Place,WC1H 0NN London, United Kingdom                                     On 26th April the Italian Prime Minister Giuseppe
Stefano Brinchi: Rome Mobility Agency (Roma Servizi per la Mobil-
                                                                     Conte outlined how the country would begin "Phase Two"
ità), Via L. Gaurico 9, 00143 Rome, Italy
Stefano Carrese, Andrea Gemma, Claudia Guattari, Livia Man-
                                                                     of lifting its coronavirus lockdown and announced a grad-
nini: Department of Engineering, Roma Tre University, Via Vito       ual easing of the measures starting from May 4th.
Volterra 62, 00146 Rome, Italy

  Open Access. © 2020 F. Aletta et al., published by De Gruyter.          This work is licensed under the Creative Commons Attribution 4.0
License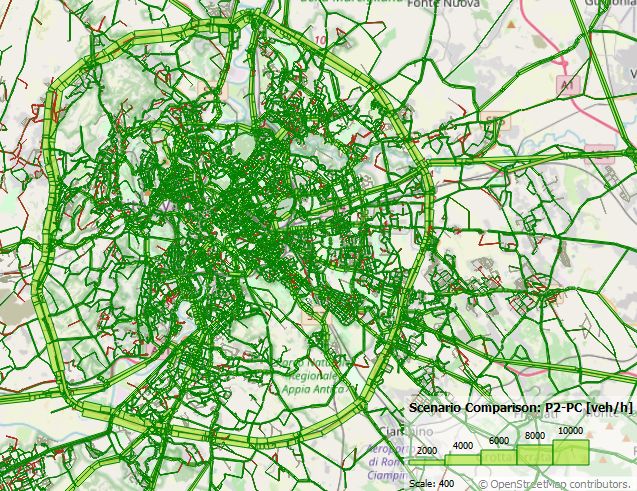
Analysing urban traflc volumes and mapping noise emissions in Rome   | 115

Figure 1: COVID-19 Epidemic curve in Italy. Data source: The Civil Protection Department [7]

     The above mentioned chronology of main steps and
legal acts taken by the Italian Government for the contain-
                                                            2 Methodology
ment of the COVID-19 epidemiological emergency, allowed
us to define 3 fundamental periods for the analysis pre- 2.1 Traflc simulation from FCD
sented in this paper: Pre-COVID-19 (February 2020); Lock-
down period (March-April 2020); “Phase Two” period (Af- The first step of the methodology was to evaluate road net-
ter May 4th). Hereafter called as PC, LD, and P2, respec- work traffic volumes in the city of Rome for the periods
tively.                                                     PC, LP and P2. To this end, a traffic simulation procedure
     The mobility restriction led to a drastic reduction of based on Floating Car Data (FCD) was performed. As men-
urban traffic volumes, with a consequent strong decrease tioned by Altintasi et al. [17], the principle of FCD is to col-
in road congestion, pollutant and noise emissions [9–16]. lect real-time traffic data, by locating the vehicle via GPS
The study presented in this paper focuses on two princi- over the entire road network. Data, such as car location,
pal aspects. Firstly, it shows the effect of urban mobility speed and direction of travel are sent to a central process-
restriction on urban vehicular traffic using Floating Car ing centre, which uses this information for traffic pattern
Data; then, a noise emission assessment, based on traf- recognition. FCD used in this study belongs to Viasat S.P.A.
fic simulation results, is performed in accordance with the and were collected by anonymous vehicles equipped with
CNOSSOS-EU method. Finally, the results of the traffic sim- On Board Unit (OBU) GPS system. The OBU records se-
ulations and road noise maps are presented to examine the quences of location points during the trips with an average
traffic-related impacts of containment measures in the city frequency of 30 seconds, in addition to the start and stop
of Rome for the LD and P2 periods.                          points, thus storing all the characteristics of the vehicle’s
                                                            path. The total FCD fleet size available in Rome consists of
                                                            about 22,121 cars, but the size of the circulating FCD fleet is
                                                            lower and variable, especially during the mobility restric-
                                                            tion for the containment of COVID-19.
                                                                The use of FCD for traffic modelling and travel demand
                                                            estimation is widely discussed in literature [18–25]. For the
                                                            scope of this study, FCD were used to estimate the Origin-
                                                            Destination (O-D) matrices following the procedure intro-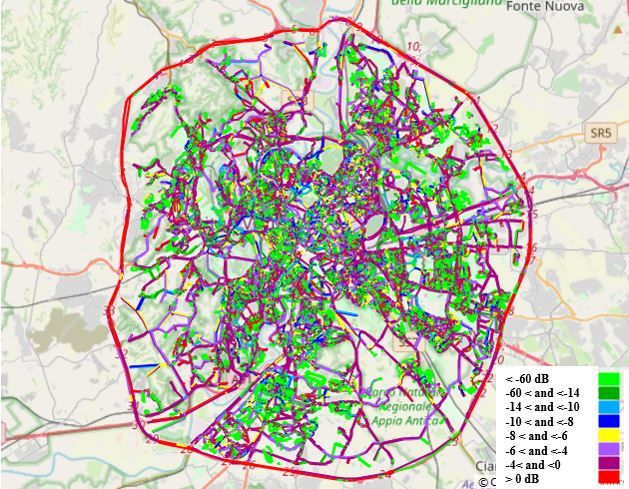
116 | F. Aletta et al.

duced by Eisemann and List [26] and refined by Carrese et         metre per frequency; which is based on the cumulative
al. [27] and Nigro et al. [28]. Five days of observation for      sound emissions of individual vehicles in the traffic flow,
each of the three periods (PC, LD, and P2) were analysed          as a function of speed. The directional sound power per
to estimate the average O-D trip matrix for the morning           metre per frequency band of the line source LW ′ ,eq,line,i,m
peak-hour demand. FCD observations from February 03rd             (expressed in dB) can then be calculated when a traffic
to February 07th were used to estimate the O-D matrix for         flow of Qm vehicles of category m with an average speed vm
baseline period (PC); from March 23rd to March 27th for LD;       are known [34]. As per Patella et al. [33], some assumptions
from May 04th to May 08th for P2.                                 were made while applying the CNOSSOS-EU method; more
     The three scenarios (PC, LD, and P2) were simulated          specifically: (a) corrections to the reference conditions
using EMME by INRO, which is a travel demand modelling            were disregarded for the calculation of the LW ,i values;
software. EMME performs a static user equilibrium assign-         (b) a single integrated broadband value LW ′ ,eq,line,m was
ment [29], and provides the traffic volume, the travel time,      considered for the analysis, derived from the LW ′ ,eq,line,i.m
and the speed for every link of the road network, which           values computed per frequency (63 Hz – 8 kHz); (c) the
was modelled with 1331 centroids (zones) and 81,604 road          LW ′ ,eq,line,m values were considered as the representative
links. Among these, 322 links represent the Grande Rac-           acoustic metrics for the road network links.
cordo Anulare (GRA), which is a ring-shaped, 68.2 km
long freeway that encircles Rome [30]. Further develop-
ments will deal with the analysis of the evolution over time
through the use of a quasi-dynamic simulation [31], whose
                                                                  3 Results
input are the same used in a static assignment, and with
the study along urban arteries affected by traffic signals        3.1 Traflc simulation
[32]. The simulations run on an Intel Xeon E5-2640 v3(2.60
                                                                  The travel demand (O-D matrices) was loaded onto the traf-
GHz) processor and all the three scenarios converged (user
                                                                  fic network of Rome¹. The total amount of vehicle trips as-
equilibrium), on average, in 3–5 min.
                                                                  signed to the network is shown in Table 1 as well as the
                                                                  trucks percentage for each scenario (PC, LD, and P2) and
                                                                  for each AM peak period. Table 1 clearly shows a strong
2.2 Noise emissions from traflc simulation
                                                                  reduction in hourly traffic demand during periods LD and
                                                                  P2 compared to the baseline (PC), on average −64.6% and
As suggested by Patella et al. [33], the flow (vehicles per
                                                                  −34.3%, respectively. Moreover, as a consequence of indi-
hour) and the speed (km/h) on each link, obtained through
                                                                  vidual mobility restrictions, the percentage of trunks in the
the traffic simulation procedure, were used to evaluate
                                                                  traffic stream significantly increased, on average +10.7%
the noise emissions for the entire road network in accor-
                                                                  for LD and +1.6% for P2.
dance with the Common Noise Assessment Methods in
                                                                       The simulation results of periods LD and P2 for the
Europe (CNOSSOS-EU) [34], which is the reference cal-
                                                                  7:00-8:00 AM peak-hour were compared to the baseline
culation model in EU Member States. Chapter III of the
                                                                  network performances (PC). The following Table 2 summa-
CNOSSOS-EU document proposes a classification for types
                                                                  rizes the results in terms of Vehicle Kilometres Travelled
of vehicles, where the general equations and coefficients
                                                                  (VKT), Total Time Spent (TTS), and average network speed
for the calculation of their sound power emission are re-
                                                                  for Intra-GRA roads, which are mainly urban roads, and
ported. There are four currently operational categories m
                                                                  GRA (freeway).
of vehicles type: Category 1- Light motor vehicles; Category
                                                                       The traffic simulation results, based on real data de-
2 - Medium heavy vehicles; Category 3 - Heavy vehicles; Cat-
                                                                  tection (FCD), show an overall reduction in the amount of
egory 4 - Powered two-wheelers. In this study the traffic
                                                                  VKT and TTS, more pronounced during the LD, with a con-
demand was modelled in terms of equivalent-vehicle trips
                                                                  sequent increase in network speed. Figure 2 and Figure 3
(i.e., a truck has a ‘passenger car equivalent’ factor of 2.5);
                                                                  show the difference in traffic volumes, i.e. the number of
therefore, for the sake of comparability between traffic and
                                                                  vehicles per hour assigned onto the network for the 7:00-
noise data, it was decided to have the same approach and
                                                                  8:00 AM peak-hour demand, between the PC scenario and
the same flows on the network were considered for the
noise emission calculation using only Category 1 vehicles.
      The CNOSSOS-EU method conceptualizes the noise              1 An overview of mobility-related information of the city of Rome
emission of a traffic flow on a link of a network as a line       including initiatives to promote the use of public transport as well as
source characterized by its directional sound power, per          innovative solutions for sustainable mobility can be found in [35–38].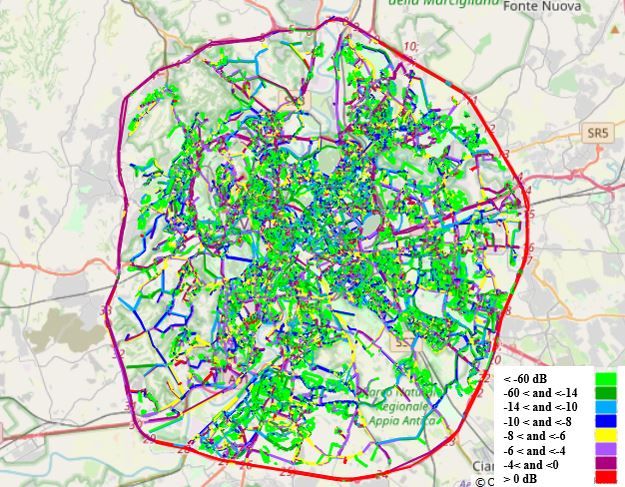
Analysing urban traflc volumes and mapping noise emissions in Rome | 117
Table 1: Traflc demand and trucks percentage
Scenario AM peak period Equivalent-vehicle trips Trucks (%)
7:00–8:00 342276 10.5
PC (baseline) 8:00–9:00 307700 11.9
9:00–10:00 314532 11.6
7:00–8:00 112338 (−67.2%) 23.4
LD 8:00–9:00 117253 (−61.9%) 23.8
9:00–10:00 112119 (−64.4%) 19.0
7:00–8:00 206643 (−39.6%) 14.9
P2 8:00–9:00 216106 (−29.8%) 12.3
9:00–10:00 211131 (−32.9%) 11.8
Table 2: Simulation results – The effect of Lockdown and Phase Two on the road network of Rome
VKT (veh·km) TTS (veh·h) Network speed (km/h)
Scenario Intra-GRA GRA Intra-GRA GRA Intra-GRA GRA
PC 1,778,421 988,796 87,411 23,265 20.3 42.5
LD 493,072 453,468 13,836 4921 35.6 92.1
P2 981,785 713,027 31,899 10,167 30.8 70.1
(LD-PC)/PC −72.3% −54.1% −84.2% −78.8% 75.2% 116.8%
(P2-PC)/PC −44.8% −27.9% −63.5% −56.3% 51.3% 65.0%
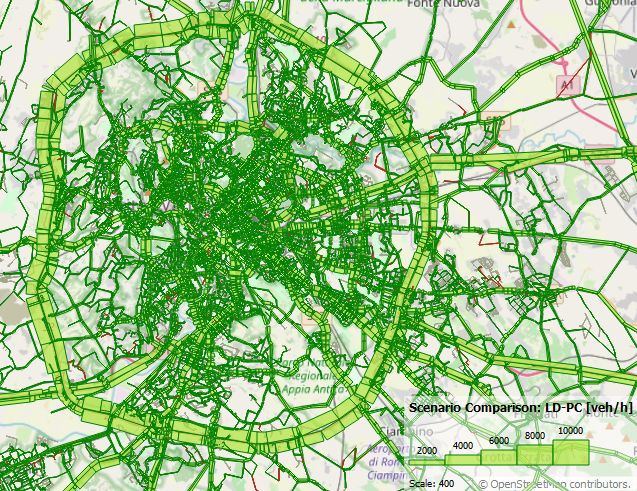
Figure 2: Traflc volume difference (LD-PC), city of Rome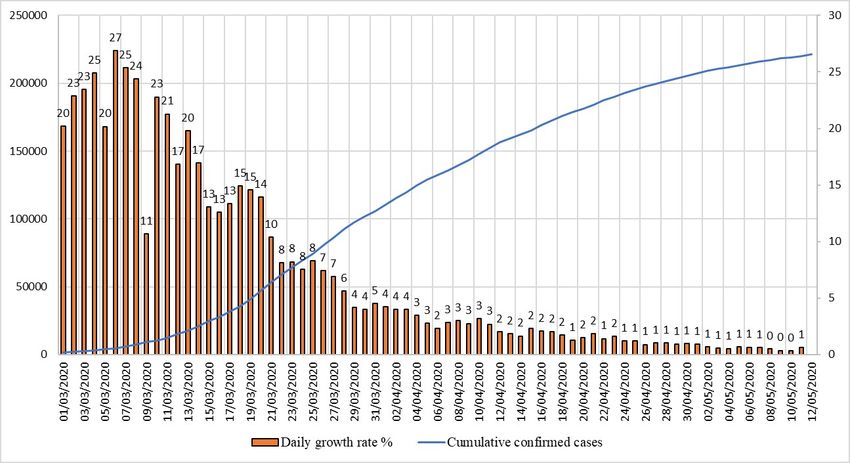
118 | F. Aletta et al.

Figure 3: Traflc volume difference (P2-PC), city of Rome

LD and P2 scenarios for each link of the network. A red link    provide an overview of the noise emission values observed
means a rise in volumes (positive difference), while a green    on the network for the three simulated scenarios, as a func-
link means a reduction in volumes (negative difference).        tion of the road type. For the sample of links from the GRA
                                                                category, where the noise emissions are higher in general,
                                                                no particular reduction in emission is observed, with only
3.2 Noise emissions simulation                                  a slightly wider dispersion in the LD scenario. On the other
                                                                hand, a noise emissions reduction trend is more clearly ob-
According to the sections III.2.1, III.2.3, III.2.4, and Ap- servable for the links of the Intra-GRA category, with a sim-
pendix III-A of the CNOSSOS-EU guidelines, the noise ilar pattern as per the distributions in Figure 4. This phe-
emission of the traffic flow was calculated for each link of nomenon is reflected also in Figure 6 and Figure 7 where
the road network as a source line with a directional sound the maps of noise emission differences are reported be-
power per metre per frequency, and those values where tween LD and PC, and between P2 and PC accordingly:
then integrated into a single broadband value LW ′ ,eq,line,m . for the Intra-GRA roads considerable noise emission re-
Looking at the road network as a whole, Figure 4 shows ductions are experienced, while for the GRA roads noise
the distributions of sound power values of the links for the emission reductions are much smaller, with some links
three scenarios. The samples appear to be normally dis- even experiencing small increases in emissions. A possi-
tributed with a clear shift of the peak towards lower dB ble explanation for this is that on Intra-GRA roads, where
levels in the transition from PC to LD, and a rise back to speed limits are lower and the volumes of non-essential
higher dB levels (even if to values still lower than PC) in trips were dramatically reduced, the lockdown measures
the transition from LD to P2.                                   had a stronger impact on noise emissions. Contrarily, on
      However, when controlling for the road type factor GRA-type roads (freeway), the reduced volumes of traffic
(i.e., GRA vs. Intra-GRA category) different patterns of were possibly compensated by the possibility of the fleet
noise emissions emerge. The box-plots reported in Figure 5 of vehicles to use the network at higher speeds (i.e., less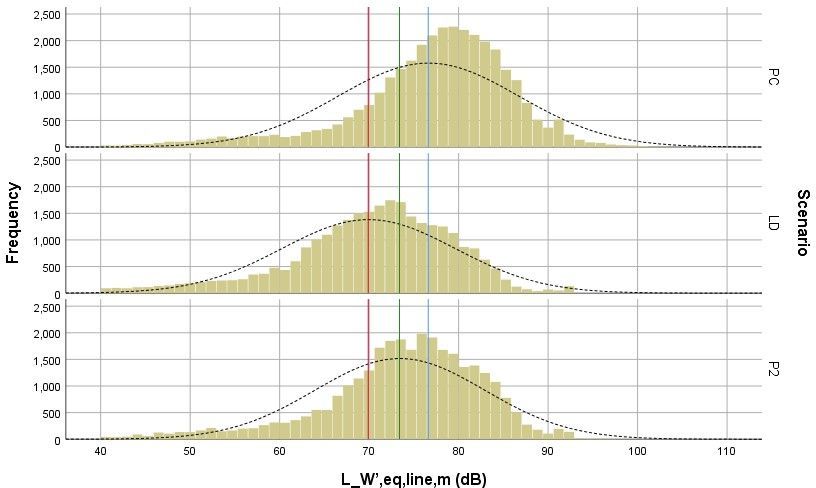
Analysing urban traflc volumes and mapping noise emissions in Rome        | 119

Figure 4: Distributions of the directional sound power per metre values for the three scenarios, and mean values for the three samples: 76.6
dB (PC, blue line), 69.9 dB (LD, purple line), and 73.4 dB (P2, green line)

traffic congestions), thus leading to increased noise emis-
sion of the traffic flows.
     In order to further explore the effect of lockdown mea-
sures on the noise emissions observed on the road net-
work, two separate one-way ANOVAs were conducted (i.e.,
one for the Intra-GRA sample and one for the GRA sam-
ple) to determine if the LW ′ ,eq,line,m values were different
in a statistically significant way for the three simulation
scenarios: PC (Intra-GRA, n = 33,639; GRA, n = 308), LD
(Intra-GRA, n = 28,225; GRA, n = 292), and P2 (Intra-GRA,
n = 30,411; GRA, n = 293). Data is presented as mean ± stan-
dard deviation. For the GRA sample, LW ′ ,eq,line,m values
were not statistically significantly different between differ-
ent scenarios, F(2, 890) = 1.759, p = .173. LW ′ ,eq,line,m values     Figure 5: Box-plots of the directional sound power per metre values
were actually higher for the P2 scenario (M = 88.5 dB, SD              for the three scenarios (PC, LD and P2) as a function of the road type
= 6.0 dB), than for the PC scenario (M = 87.6 dB, SD = 7.8
dB) and LD scenario (M = 87.6 dB, SD = 7.4 dB). Conversely,
                                                                       private travels and commuting in the LD (stricter mea-
for the Intra-GRA sample, LW ′ ,eq,line,m values were statis-
                                                                       sures) and P2 (more relaxed measures) scenarios, depend-
tically significantly different between different scenarios,
                                                                       ing on the road type (i.e., Intra-GRA or GRA). It is important
F(2, 92,272) = 3,756.310, p < .001. LW ′ ,eq,line,m values in this
                                                                       to note that summing dB values as it is done for the VKT
case were higher for the PC scenario (M = 76.5 dB, SD = 10.1
                                                                       and TTS is not an established method: results should be
dB), compared with the P2 scenario (M = 73.3 dB, SD = 9.4
                                                                       treated with caution and considered as an overall indica-
dB) and LD scenario (M = 69.7 dB, SD = 9.5 dB).
                                                                       tion of decibels that are no longer emitted on the road net-
     A similar calculation as per the traffic simulation was
                                                                       work [33]. Under such circumstances, it can be observed
performed to compare the noise emissions under the PC
                                                                       that noise emission reductions are more obvious for the
scenario with the LD and P2 scenarios for the 7:00-8:00
                                                                       Intra-GRA road type, for both the LD and P2 scenarios.
AM peak-hour. Table 3 shows the sound power reduction
achieved by implementing the containment measures for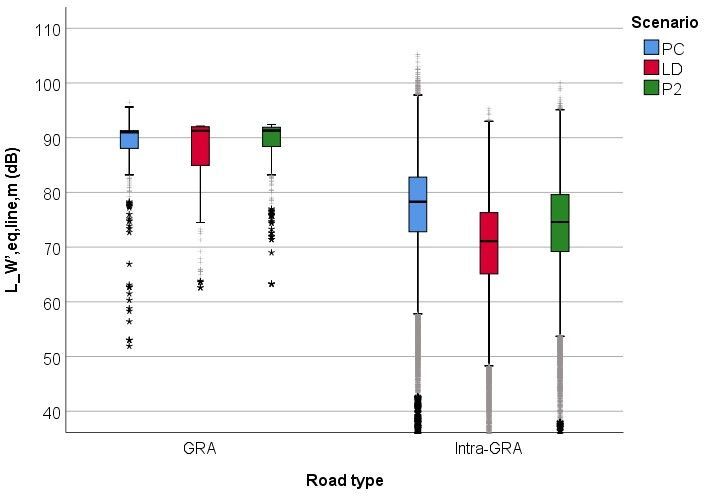
120 | F. Aletta et al.

Figure 6: Noise emissions difference (LD-PC), city of Rome

Figure 7: Noise emissions difference (P2-PC), city of Rome
Analysing urban traflc volumes and mapping noise emissions in Rome     | 121

Table 3: Simulation results – The effect of Lockdown and Phase Two
                                                                 the CNOSSOS-EU method. Results showed that noise emis-
on the noise emissions of the road network of Rome               sion reductions on the road network varied greatly both be-
                                                                 tween scenarios (PC, LD, and P2) and between road types
                             Noise Emissions (dB)
                                                                 (Intra-GRA and GRA). A general finding is that, compared
   Scenario                 Intra-GRA                  GRA       to the Pre-COVID-19 situation, the noise emission reduc-
       PC                   2,574,564               26,990       tions observed on the GRA links are considerably smaller
       LD                   1,968,822               25,572       (sometimes negligible) than those observed for the Intra-
       P2                   2,228,546               25,945       GRA road category (regardless of the level of containment
  (LD-PC)/PC                 −23.5%                  −5.2%       measures). The reason can be attributed to the road types
  (P2-PC)/PC                 −13.4%                  −3.9%       of the network: the GRA is a freeway and a significant re-
                                                                 duction in traffic volumes over its link leads to high-speed
                                                                 regime, and therefore, the noise emission reduction gener-
     The GRA links are a freeway-like road network: its in-
                                                                 ated by a lower flow on GRA links is compensated by the
frastructure typically suffers from congestions with traffic
                                                                 higher emission of the circulating vehicles.
flows traveling at speeds lower than those allowed. The
                                                                       This reflection suggests that some ordinances of traffic
drastic reduction of traffic volumes led to a general in-
                                                                 limitation to contain pollutant emissions and traffic con-
crease of the network speed with fewer vehicles circulat-
                                                                 gestion, which include various regulatory strategies to re-
ing at higher speeds (possibly closer to the legal speed
                                                                 duce car travel in the urban context, undoubtedly gener-
limit) and less likely of experiencing congestion. Because
                                                                 ate a reduction in traffic-related greenhouse gas emissions,
the CNOSSOS-EU method considers the directional sound
                                                                 but the noise emissions might not be affected by such mea-
power per metre per frequency band of the source line as a
                                                                 sures in some parts of the road networks. For this reason,
function of the traffic flow and its average speed, it is likely
                                                                 such policies should be accompanied by appropriate inter-
that the increased speed compensated the flow reduction,
                                                                 ventions to reduce speed limits on some high-speed road
thus leading to much smaller noise emissions reductions.
                                                                 segments.
On the other hand, for urban links (e.g., Intra-GRA road
                                                                       It is worth noting that in the context of this study, the
type), where the speed limits are much lower the impact
                                                                 general noise emission analysis might not be a straightfor-
of the containment measures is more significant, leading
                                                                 ward representation of the actual acoustic environments
to considerable reductions in noise emissions.
                                                                 as experienced on, or in proximity of, the network of road
                                                                 links, and experimental data would be needed to confirm
                                                                 changes in the acoustic climate [39, 40], of which road traf-
4 Discussion and conclusions                                     fic is only one of the possible sound sources.

The study presented in this paper shows the impact of mo-            Acknowledgement: The authors are grateful to Dr Patrizia
bility restriction for COVID-19 containment on urban ve-             Bellucci from the LIFE-DYNAMAP project (http://www.life-
hicular traffic and road noise pollution. The proposed ap-           dynamap.eu/), for the useful discussion on the GRA noise
proach relies on real time Floating Car Data (FCD), which            data.
were used to estimate the Origin–Destination trip matrices
for three periods corresponding to the main steps and legal
acts taken by the Italian Government for the containment
of the COVID-19 epidemiological emergency. During the
                                                                     References
lockdown period, from 9th March to 3rd May, the private ve-          [1]   Livingston E., Bucher K., Coronavirus Disease 2019 (COVID-19)
hicle traffic demand decreased on average by 64.6%, and                    in Italy, JAMA, 2020, 323(14), 1335–1335.
during the “Phase Two”, from May 4th, it decreased by                [2]   http://www.salute.gov.it/portale/nuovocoronavirus/dettaglioN
34.3%. A traffic simulation-based approach was used to                     otizieNuovoCoronavirus.jsp?lingua=italiano&menu=notizie&p=
evaluate the overall effect of the mobility restriction on                 dalministero&id=4736 (accessed 12 May, 2020).
                                                                     [3]   https://amboslo.esteri.it/ambasciata_oslo/en/ambasciata/new
road network traffic volumes; a strong reduction in the
                                                                           s/dall_ambasciata/2020/03/nuove-misure-per-il-contrasto-e
amount of Vehicle Kilometres Travelled, more pronounced                    .html (accessed 12 May, 2020).
during the lockdown, was found.                                      [4]   https://www.gazzettauflciale.it/eli/id/2020/03/08/20A01522/
     Road links traffic volumes and speeds were used as in-                sg (accessed 12 May, 2020).
put data for a noise emission assessment performed with              [5]   https://www.gazzettauflciale.it/eli/id/2020/03/09/20A01558/
                                                                           sg (accessed 12 May, 2020).
122 | F. Aletta et al.
[6] http://opendatadpc.maps.arcgis.com/apps/opsdashboard/ind ference on Intelligent Transportation Systems (ITSC), 2014, DOI:
ex.html#/b0c68bce2cce478eaac82fe38d4138b1 (accessed 12 10.1109/ITSC.2014.6957809.
May, 2020). [24] Mannini L., Cipriani E., Crisalli U., Gemma A., Vaccaro G., On-
[7] http://www.protezionecivile.gov.it/department (accessed 12 Street Parking Search Time Estimation Using FC, Data. Transp.
May, 2020). Res. Procedia, 2017, 27, 929–36.
[8] https://github.com/pcm-dpc/COVID-19/tree/master/dati-and [25] Vogt S., Fourati W., Schendzielorz T., Friedrich B., Estimation of
amento-nazionale (accessed 12 May, 2020). origin-destination matrices by fusing detector data and Floating
[9] Aloi A., Alonso B., Benavente J., Cordera R., Echániz E., González Car Data, Transp. Res. Procedia, 2019, 37, 473–80.
F., et al., Effects of the COVID-19 Lockdown on Urban Mobility: [26] Eisenman S.M., List GF. Using probe data to estimate OD matri-
Empirical Evidence from the City of Santander (Spain), Sustain- ces, Proceedings of the 7th International IEEE Conference on In-
ability, 2020, 12(9), 3870. telligent Transportation Systems (IEEE Cat. No.04TH8749), 2004,
[10] Collivignarelli M.C., Abbà A., Bertanza G., Pedrazzani R., Ricciardi DOI: 10.1109/ITSC.2004.1398913.
P., Carnevale Miino M., Lockdown for CoViD-2019 in Milan: what [27] Carrese S., Cipriani E., Mannini L., Nigro M., Dynamic demand
are the effects on air quality?, Sci. Total Environ., 2020, 732, estimation and prediction for traflc urban networks adopting
139280. new data sources, Transp. Res. Part C Emerg. Technol., 2017, 81,
[11] Douglas M., Katikireddi S.V., Taulbut M., McKee M., McCartney 83–98.
G., Mitigating the wider health effects of covid-19 pandemic re- [28] Nigro M., Cipriani E., del Giudice A., Exploiting floating car data
sponse, BMJ, 2020, 369, m1557. for time-dependent Origin-Destination matrices estimation, J.
[12] Mahato S., Pal S., Ghosh K.G., Effect of lockdown amid COVID-19 Intell. Transp. Syst., 2018, 22(2), 159–74.
pandemic on air quality of the megacity Delhi, India, Sci. Total [29] Florian M., Hearn D., Network equilibrium models and algorithms,
Environ., 2020, 730, 139086. Network Routing, 1995, 485–550.
[13] Nakada L.Y., Urban R.C., COVID-19 pandemic: impacts on the air [30] Patella S.M., Scrucca F., Asdrubali F., Carrese S., Carbon Footprint
quality during the partial lockdown in São Paulo state, Brazil, of autonomous vehicles at the urban mobility system level: A
Sci. Total Environ., 2020, 730, 139087. traflc simulation-based approach, Transp. Res. Part D Transp.
[14] Sharma S., Zhang M., Anshika, Gao J., Zhang H., Kota S.H., Effect Environ., 2019, 74, 189–200.
of restricted emissions during COVID-19 on air quality in India, [31] Fusco G., Colombaroni C., Gemma A., Sardo S.L., A quasi-
Sci. Total Environ., 2020, 728, 138878. dynamic traflc assignment model for large congested urban
[15] Wang Q., Su M.A., Preliminary assessment of the impact of road networks, Math. Models Methods Appl. Sci., 2013, 7(4),
COVID-19 on environment - A case study of China, Sci. Total Envi- 341–9.
ron., 2020, 728, 138915. [32] Adacher L., Gemma A., A robust algorithm to solve the signal
[16] Zambrano-Monserrate M.A., Ruano M.A., Sanchez-Alcalde L., In- setting problem considering different traflc assignment ap-
direct effects of COVID-19 on the environment, Sci. Total Environ., proaches, Int. J. Appl. Math. Comput. Sci., 2017, 27(4), 815–26.
2020, 728, 138813. [33] Patella S.M., Aletta F., Mannini L., Assessing the impact of Au-
[17] Altintasi O., Tuydes-Yaman H., Tuncay K., Detection of urban traf- tonomous Vehicles on urban noise pollution, Noise Mapp., 2019,
fic patterns from Floating Car Data (FCD), Transp. Res. Procedia, 6(1), 72–82.
2017, 22, 382–91. [34] Kephalopoulos S., Paviotti M., Anfosso-Lédée F., Common Noise
[18] Kerner B.S., Demir C., Herrtwich R.G., Klenov S.L., Rehborn H., Assessment Methods in Europe (CNOSSOS-EU), Luxembourg:
Aleksi M., et al., Traflc state detection with floating car data in Publications Oflce of the European Union, 2012.
road networks, Proceedings of IEEE Intelligent Transportation [35] Carrese S., Giacchetti T., Patella S.M., Petrelli M., Real time
Systems, 2005, DOI: 10.1109/ITSC.2005.1520133. ridesharing: Understanding user behavior and policies impact:
[19] Ásmundsdóttir R., Chen Y., van Zuylen H.J., Dynamic Origin- Carpooling service case study in Lazio Region, Italy, Proceedings
Destination Matrix Estimation Using Probe Vehicle Data as A of the 5th IEEE International Conference on Models and Technolo-
Priori Information, Int. Series Operations Research & Manage- gies for Intelligent Transportation Systems (MT-ITS), 2017.
ment Sci., 2010, 89–108. [36] Carrese S., Giacchetti T., Nigro M., Patella S.M., An innovative
[20] Zhao H., Yu L., Guo J., Zhao N., Wen H., Zhu L., Estimation of car sharing electric vehicle system: an Italian experience, Urban
Time-Varying OD Demands Incorporating FCD and RTMS Data, J. Transport., 2017, XXIII, 245–52.
Transp. Syst. Eng. Inf. Technol., 2010, 10(1), 72–80. [37] Patella S.M., Sportiello S., Petrelli M., Carrese S., Workplace
[21] Cao P., Miwa T., Yamamoto T., Morikawa T., Bilevel Generalized relocation from suburb to city center: A case study of Rome, Italy,
Least Squares Estimation of Dynamic Origin-Destination Matrix Case Studies on Transport Policy, 2019, 7(2), 357–62.
for Urban Network with Probe Vehicle Data. Bilevel Generalized [38] Gatta V., Marcucci E., Nigro M., Patella S.M., Serafini S., Public
Least Squares Estimation of Dynamic Origin–Destination Matrix Transport-Based Crowdshipping for Sustainable City Logistics:
for Urban Network with Probe Vehicle Data, Transp. Res. Rec., Assessing Economic and Environmental Impacts, Sustainability,
2013, 2333(1), 66–73. 2018, 11(1), 145.
[22] Rahmani M., Koutsopoulos H.N., Jenelius E., Travel time estima- [39] Bellucci P., Peruzzi L., Zambon G., LIFE DYNAMAP project: the
tion from sparse floating car data with consistent path inference: case study of Rome, Appl. Acoust., 2017, 117, 193–206.
A fixed point approach. Transp. Res., Part C Emerg. Technol., [40] Sevillano X., Socoró J.C., Alías F., Bellucci P., Peruzzi L., Radaelli
2017, 85, 628–43. S., et al., DYNAMAP - Development of low cost sensors net-
[23] Cipriani E., Gori S., Mannini L., Brinchi S., A procedure for urban works for real time noise mapping. Noise Mapp., 2016, 3(1), DOI:
route travel time forecast based on advanced traflc data: Case 10.1515/noise-2016-0013.
study of Rome, Proceedings of the 17th International IEEE Con-You can also read