Dashboard widgets
Version 8.0
←
→
Page content transcription
If your browser does not render page correctly, please read the page content below

Dashboard widgets Version 8.0
This documentation is provided under restrictions on use and are protected by intellectual property laws. Except as
expressly permitted in your license agreement or allowed by law, you may not use, copy, reproduce, translate,
broadcast, modify, license, transmit, distribute, exhibit, perform, publish or display any part, in any form, or by any
means. Reverse engineering, disassembly, or decompilation of this documentation, unless required by law for
interoperability, is prohibited.

The information contained herein is subject to change without notice and is not warranted to be error-free. If you
find any errors, please report them to us in writing.

© 2023 Creatio. All rights reserved.

Table of Contents | 3

Table of Contents

Dashboard widgets                                                                                                       4
  Data storage structure of dashboards                                                                                  4
  Implementing functionality in the dashboards view mode                                                                5
  Implementing functionality in the dashboards view mode                                                                6
  Base classes that implement widget functionality                                                                      6
  Dashboard widget types                                                                                                7
Modify sales pipeline calculations                                                                                     14
  To modify the sales pipeline calculations:                                                                           14
  Example of modifying the calculations displayed in the "Number of opportunities" view of the sales pipeline          14
Enable additional filtering in a sales pipeline                                                                        19
  Case description                                                                                                     19
  Source code                                                                                                          19
  Case implementation algorithm                                                                                        20
Add a custom dashboard widget                                                                                          22
  Case description                                                                                                     22
  Source code                                                                                                          22
  Case implementation algorithm                                                                                        22
BaseWidgetDesigner schema                                                                                              28
  Methods                                                                                                              29
DashboardEnums enumeration                                                                                             29
  Properties                                                                                                           29

© 2023 Creatio. All rights reserved.
Dashboard widgets | 4
Dashboard widgets
Advanced
Dashboard widgets (analytic elements) are used for data analysis of sections. Go to the [ Dashboards ] view of
the required section to work with its analytics. Use the [ Dashboards ] section to work with the entirety of Creatio
section data analytics.
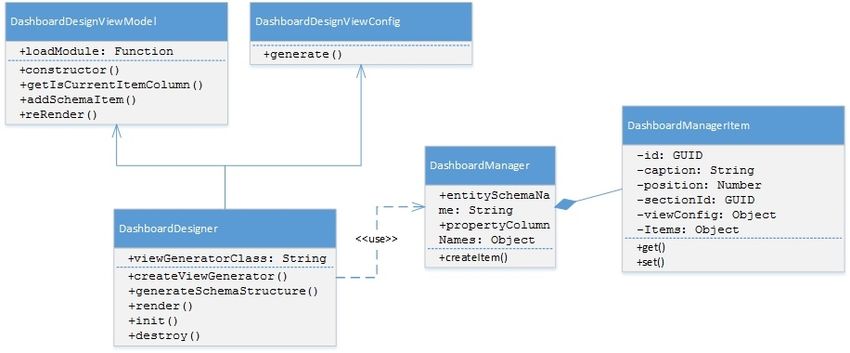
Data storage structure of dashboards
The dashboards section is a user-defined set of tab elements. The mechanism for working with dashboards is
implemented with the help of the DashboardManager dashboard client manager and the DashboardManagerItem
element client manager, which represents the tabs. The SysDashboard object is responsible for dashboards in the
system. The SysDashboard object properties are described in the table.
SysDashboard object properties
Name Header Type Details
Caption Header String This information is displayed in the tab header.
Position Position Number If a position is not specified, the elements are displayed in alphabetica
Section Section Lookup System section.
ViewConfig Element Array
(widget) view
[{
configuration
//Element type (Terrasoft.ViewItemType).
itemType: "4",
// Element name.
name: "SomeInvoiceChart",
// View configuration.
layout: {
columns: 4,
rows: 4,
colspan: 4,
rowspan: 4
}
},
{...}]
Items Element JSON
(widget) Object
{
module
© 2023 Creatio. All rights reserved.Dashboard widgets | 5
module
// The name of the element for which the module setti
Name configuration
Header Type Details "SomeInvoiceChart": {
// Name of the “DashboardItem” view element.
“widgetType”: "Chart",
// Parameters required to display data for a part
“parameters”: {
“caption”: "some caption",
...
},
},
{...}
}
Implementing functionality in the dashboards view mode
The hierarchy of classes that implement functionality in the dashboards view mode:
The SectionDashboardModule module:
SectionDashboardBuilder encapsulates the view generation logic and view model class for the [ Dashboards ]
section module.
– the model class of the [ Dashboards ] section view model.
© 2023 Creatio. All rights reserved.Dashboard widgets | 6
SectionDashboardsViewModel – the model class of the [ Dashboards ] section view model.
SectionDashboardsModule – [ Dashboards ] section class module.
The DashboardModule module:
DashboardViewConfig – a class that generates the view configuration for the dashboards page view module.
BaseDashboardViewModel – a base class for the dashboards page view model.
DashboardModule – a class that contains functionality for working with dashboard modules.
The DashboardBuilder module:
DashboardsViewConfig – a class that generates a dashboards module view configuration.
BaseDashboardsViewModel – a base class of the dashboards section view model.
DashboardBuilder – a class for dashboards module construction.
Implementing functionality in the dashboards view mode
The hierarchy of classes that implement the functionality in the dashboards view mode:
The DashboardDesigner module:
DashboardDesignerViewConfig – a class that generates the view configuration for the dashboards designer
module.
DashboardDesignerViewModel – a class of the dashboards designer view model.
DashboardDesigner – dashboard visual module class.
Base classes that implement widget functionality
BaseWidgetViewModelClass – a base class of the dashboards section view model. To use this class, register the
following messages in the module:
© 2023 Creatio. All rights reserved.Dashboard widgets | 7
following messages in the module:
GetHistoryState (publish; ptp) ;
ReplaceHistoryState (publish; broadcast) ;
HistoryStateChanged (subscribe; broadcast) ;
GetWidgetParameters (subscribe; ptp) ;
PushWidgetParameters (subscribe; ptp) – if the parameters are drawn from modules (
useCustomParameterMethods = true ).
BaseWidgetDesigner – base widget settings view schema.
BaseAggregationWidgetDesigner – contains methods for working with aggregate columns and aggregation types.
DashboardEnums – contains an enumeration of widget properties.
Terrasoft.DashboardEnums.WidgetType – contains the widget view mode and design mode configuration of the
dashboards.
Dashboard widget types
Chart
Charts display multiple system records in the form of diagrams of different types. For example, you can display a
pie chart of accounts distributed by type. Charts display information in the form of different diagram types or in a
data list form.
© 2023 Creatio. All rights reserved.Dashboard widgets | 8
Charts functionality implementation classes
ChartViewModel – chart view model.
ChartViewConfig – generates the chart view model.
ChartModule – a module designed to work with charts.
ChartDesigner – view model schema of a chart.
ChartModuleHelper – generates a query using the Terrasoft.EntitySchemaQuery object.
ChartDrillDownProvider – contains methods for working with the “Show data” function (used for working with
chart series).
Chart setup parameters
To configure a chart, you need to add the JSON configuration object with the chart properties to the widget
module configuration. The widget module configuration is defined by the Items property of the SysDashboard
object.
Set the “Chart” value to the widgetType property in the JSON configuration object with widget settings. In
addition, assign the parameters property to the object with necessary parameters. Possible chart parameters are
listed in the table.
Chart setup parameters
Name Type Details
seriesConfig object The settings of an embedded chart in a series.
orderBy string Sorting field.
orderDirection string Sorting direction.
caption string Chart header.
sectionId string Section id.
xAxisDefaultCaption string Default X-axis header.
yAxisDefaultCaption string Default Y-axis header.
primaryColumnName string Name of initial column. The [ Id ] column is the default one.
yAxisConfig object Array of the Y-axis name settings.
schemaName string Chart object.
sectionBindingColumn string Section link column.
© 2023 Creatio. All rights reserved.Dashboard widgets | 9
func string Aggregate function.
Name Type Details
type string Chart type.
XAxisCaption string X-axis caption.
YAxisCaption string Y-axis caption.
xAxisColumn string The X-axis grouping column.
yAxisColumn string The Y-axis grouping column.
styleColor string Chart color.
filterData object Filter settings.
Metric
The “Metric” dashboard displays the number (or date) received by inquiring system data, for example, a total
number of company’s employees.
Functionality implementation classes of the “Metric” dashboard
IndicatorViewModel – metric view model.
IndicatorViewConfig – generates the configuration of the metric view model.
IndicatorModule – a module designed to work with metrics.
IndicatorDesigner – view model schema of the metric edit page.
Metric settings
To configure a metric, you need to add the JSON configuration object with Metric properties to the widget module
configuration. The widget module configuration is defined by the Items property of the SysDashboard object.
Set the “Metric” value to the widgetType property in the JSON configuration object with widget settings. In
addition, assign the parameters property to the object with necessary parameters. Possible metric parameters
are listed in the table.
© 2023 Creatio. All rights reserved.Dashboard widgets | 10
are listed in the table.
Metric settings
Name Type Details
caption string Metric header.
sectionId string Section id.
entitySchemaName string Metric object.
sectionBindingColumn string Section link column.
columnName string Name of aggregating column.
format object Metric format.
filterData object Filter settings.
aggregationType number Type of aggregating function.
style string Metric color.
Gaude
A gauge dashboard element displays aggregate data from multiple system records in the form of a dial with
green, yellow, and red areas on its scale. For example, you may use this dashboard to display a number of
performed activities and compare it to a desired rate.
Gauge functionality implementation classes
– gauge view model.
© 2023 Creatio. All rights reserved.Dashboard widgets | 11
GaugeViewModel – gauge view model.
GaugeViewConfig – generates the gauge view model.
GaugeModule – module designed to work with gauges.
GaugeChart – implements a gauge chart component.
GaugeDesigner – view model schema of a gauge.
Gauge settings
To configure a gauge, you need to add the JSON configuration object with the gauge properties to the widget
module configuration. The widget module configuration is defined by the Items property of the SysDashboard
object.
Set the “Gauge” value to the widgetType property in the JSON configuration object with widget settings. In
addition, assign the parameters property to the object with necessary parameters. Possible gauge parameters
are listed in the table.
Gauge settings
Name Type Details
caption string Gauge header.
sectionId string Section id.
entitySchemaName string Gauge object.
sectionBindingColumn string Section link column.
List
A list displays multiple system records in a unified visual form. Lists enable you to limit the number of records
displayed to create such dashboards as the “Top ten most productive managers by the number of closed deals”,
for example.
List functional classes
DashboardGridViewModel – list view model.
© 2023 Creatio. All rights reserved.Dashboard widgets | 12
DashboardGridViewConfig – generates list view configuration.
DashboardGridModule – module designed to work with lists.
DashboardGridDesigner – list editing page schema.
List settings
To configure a list, you need to add the JSON configuration object with list properties to the widget module
configuration. The widget module configuration is defined by the Items property of the SysDashboard object.
Set the “DashboardGrid” value to the widgetType property in the JSON configuration object with widget settings.
In addition, assign the parameters property to the object with necessary parameters. Possible list parameters are
listed in the table.
List settings
Name Type Details
caption string List header.
sectionBindingColumn string Section link column.
filterData object Filter settings.
sectionId string Section id.
entitySchemaName string List object.
style string List color.
orderDirection number Sorting options (1 - ascending, 2 - descending).
orderColumn string List sorting column.
rowCount number The number of rows to display.
gridConfig object List configuration.
Web-page
The web-page dashboard is used to display web pages on the dashboard panel. It may be an online currency
calculator, your corporate website, etc.
Web-page functionality implementation classes
WebPageViewModel – web-page view model.
WebPageViewConfig – generates the web-page view model configuration.
© 2023 Creatio. All rights reserved.Dashboard widgets | 13
WebPageModule – module used to work with web pages.
WebPageDesigner – web-page widget view schema.
Web-page settings parameters
To configure a web page, you need to add the JSON configuration object with web page properties to the widget
module configuration. Widget module configuration is defined by the Items property of the SysDashboard object.
Set the “WebPage” value to the widgetType property in the JSON configuration object with widget settings. In
addition, assign the parameters property to the object with necessary parameters. Possible web-page
parameters are listed in the table.
Web-page settings
Name Type Details
caption string Web-page widget title.
sectionId string Section id.
url string Web-page link.
style string Web-page widget CSS-styles
Sales pipeline
The “Sales pipeline” dashboard is used to analyze sales dynamics by stages.
Sales pipeline functionality implementation classes
OpportunityFunnelChart – a class inherited from Chart .
Sales pipeline settings
To configure a sales pipeline, you need to add the JSON configuration object with sales pipeline properties to the
widget module configuration. Widget module configuration is defined by the Items property of the SysDashboard
object.
Set the “OpportunityFunnel” value to the widgetType property in the JSON configuration object with widget
settings. In addition, assign the parameters property to the object with necessary parameters. Possible sales
pipeline parameters are listed in the table.
Sales pipeline settings
Name Type Details
caption string Sales pipeline header.
Section id.
© 2023 Creatio. All rights reserved.Modify sales pipeline calculations | 14
sectionId string Section id.
Name Type Details
defPeriod string Pipeline period (last week by default).
sectionBindingColumn string Section link column.
type string Chart type (“funnel”).
filterData object Filter settings.
Modify sales pipeline calculations
Advanced
You can modify the way values are calculated for the sales pipeline dashboard element in the [ Opportunities
section ]. To do this, you need to create a new module for calculations and replace the sales pipeline display client
schema.
To modify the sales pipeline calculations:
1. Create a new class inherited from FunnelBaseDataProvider and specify the calculation logic.
2. Create a replacing FunnelChartSchema client schema and use the new calculation class in it.
Example of modifying the calculations displayed in the
"Number of opportunities" view of the sales pipeline
Case description
Modify the sales pipeline calculation algorithms by replacing the number of opportunities with the number of
products added to opportunities.
Case implementation algorithm
1. Create a new module in the custom package
Create a new calculation provider client module in the custom package. Calculation provider is a class responsible
for selecting, filtering and processing data for sales pipeline chart.
Specify a name and caption for the new module, for example, UsrFunnelByProductCountDataProvider (Fig. 1).
Fig. 1. Calculation provider module properties
© 2023 Creatio. All rights reserved.Modify sales pipeline calculations | 15
2. Add localizable strings
Add a string with the Number of products value to the collection of localizable strings of the created module. To
do this, right-click the [ LocalizableStrings ] structure node and select [ Add ] from the context menu. Set the
properties for the new string as shown on Fig. 2.
Fig. 2. Localizable string properties
Add CntOpportunity localizable string with the Number of opportunities value in the similar way.
3. Add implementation to the provider module
To modify sales pipeline calculations, override the following methods:
addQueryColumns column generation method for data selection
methods for selection data processing.
To process one record from the selection, define the getSeriesDataConfigByItem method. To process the whole
collection, define the prepareFunnelResponseCollection method. To filter the records, define the
applyFunnelPeriodFilters method.
Below is the source code of the new calculation provider module for the sales pipeline.
define("UsrFunnelByProductCountDataProvider", ["ext-base", "terrasoft", "UsrFunnelByProductCountDataProv
"FunnelBaseDataProvider"],
function(Ext, Terrasoft, resources) {
// Defining a new calculation provider.
Ext.define("Terrasoft.configuration.UsrFunnelByProductCountDataProvider", {
// Inheriting from the basic provider.
© 2023 Creatio. All rights reserved.Modify sales pipeline calculations | 16
extend: "Terrasoft.FunnelBaseDataProvider",
// New provider short name
alternateClassName: "Terrasoft.UsrFunnelByProductCountDataProvider",
// Collection processing method
prepareFunnelResponseCollection: function(collection) {
this.callParent(arguments);
},
// Extending the FunnelBaseDataProvider base model method.
// Sets the column number of products for data sampling
addQueryColumns: function(entitySchemaQuery) {
// Parent method calling
this.callParent(arguments);
// Adds the number of products column to the sample
entitySchemaQuery.addAggregationSchemaColumn("[OpportunityProductInterest:Opportunity].Q
Terrasoft.AggregationType.SUM, "ProductsAmount");
},
// Extending the FunnelBaseDataProvider base class method.
// Sets sample filtration
applyFunnelPeriodFilters: function(filterGroup) {
// Parent method calling
this.callParent(arguments);
// Creates a filter group.
var endStageFilterGroup = Terrasoft.createFilterGroup();
// Sets the group operator type.
endStageFilterGroup.logicalOperation = Terrasoft.LogicalOperatorType.OR;
// Sets the filter that shows whether the sale stage is over yet.
endStageFilterGroup.addItem(
Terrasoft.createColumnIsNullFilter(this.getDetailColumnPath("DueDate")));
// Sets the filter that shows whether the sale stage is final.
endStageFilterGroup.addItem(
Terrasoft.createColumnFilterWithParameter(Terrasoft.ComparisonType.EQUAL,
this.getDetailColumnPath("Stage.End"), true, Terrasoft.DataValueType.BOOLEAN));
filterGroup.addItem(endStageFilterGroup);
},
// Extending the FunnelBaseDataProvider base model method.
// Processes data for the stages in the pipeline.
getSeriesDataConfigByItem: function(responseItem) {
// Object that stores localizable strings.
var lcz = resources.localizableStrings;
// Receives a stage data object from the parent method.
var config = this.callParent(arguments);
// Receives data about the number of products in an opportunity from the sample result.
var products = responseItem.get("ProductsAmount");
products = Ext.isNumber(products) ? products : 0;
// Formats the strings.
var name = Ext.String.format("{0}{1}: {2}{3}: {4}",
config.menuHeaderValue, lcz.CntOpportunity, config.y, lcz.FunnelProductsCaption, pro
var displayValue = Ext.String.format("{0}: {1}", lcz.FunnelProductsCaption, product
// Installs new data in the data object and returns it.
© 2023 Creatio. All rights reserved.Modify sales pipeline calculations | 17
return Ext.apply(config, {
name: name,
displayValue: displayValue
});
}
});
});
4. Create a sales pipeline replacing schema
To use the new provider module in the calculations, override the sales pipeline calculation provider generator
method.
To do this, create a replacing client module and specify FunnelChartSchema as a parent (Fig. 3).
Fig. 3. Properties of the replacing module
Add the new calculation module to dependencies (the Dependencies section), by specifying its name in the
[ Dependency ] field and the UsrFunnelByProductCountDataProvider value in the [ Name ] field (Fig. 4).
Fig. 4. Sales pipeline schema dependency properties
5. Specify the new calculation provider in the sales pipeline replacing
schema
To do this, override the getProvidersCollectionConfig method in the replacing schema that gets the configuration
object with the collection of providers.
© 2023 Creatio. All rights reserved.Modify sales pipeline calculations | 18
define("FunnelChartSchema", ["UsrFunnelByProductCountDataProvider"],
function() {
return {
entitySchemaName: "Opportunity",
methods: {
getProvidersCollectionConfig: function() {
// Calls parent method.
// Gets array of providers.
var config = this.callParent();
// Searches data provider in the measurement by the number of opportunities.
var byCount = Terrasoft.findItem(config, {tag: "byNumberConversion"});
// Replaces with new class.
byCount.item.className = "Terrasoft.UsrFunnelByProductCountDataProvider";
return config;
}
}
};
});
After saving the schema, the new calculation module will be used in the sales pipeline and the sales pipeline itself
will display the total number of products by stages (Fig. 5).
Fig. 5. Sales pipeline displaying the number of products added to opportunities
© 2023 Creatio. All rights reserved.Enable additional filtering in a sales pipeline | 19
Enable additional filtering in a sales
pipeline
Advanced
In Creatio, you can enable additional filtering for calculations in sales pipeline charts.
To do it this:
1. Create a new class inherited from the calculation provider and implement the necessary filtering logic.
2. Create a replacing FunnelChartSchema client schema and use the new calculation class in it.
Case description
Add filtering to sales pipeline calculations displayed in the “Number of opportunities” view for selecting the
opportunities whose [ Customer ] field is populated with an account.
Source code
© 2023 Creatio. All rights reserved.Enable additional filtering in a sales pipeline | 20
You can download the package with case implementation using the following link.
Case implementation algorithm
1. Creating a new module in the custom package
Create a new calculation provider client module in the custom package. Calculation provider is a class responsible
for selecting, filtering and processing data for sales pipeline chart.
Specify a name and caption for the new module, for example, UsrFunnelByCountDataProvider (fig. 1).
Fig. 1. Calculation provider module properties
2. Defining the new provider class and specifying the filtering logic
Inherit the created class from the FunnelByCountDataProvider class and override the getFunnelFixedFilters
method.
The module source code:
define("UsrFunnelByCountDataProvider", ["ext-base",
"terrasoft", "UsrFunnelByCountDataProviderResources",
"FunnelByCountDataProvider"],
function(Ext, Terrasoft, resources) {
// Defining the new calculation provider.
Ext.define("Terrasoft.configuration.UsrFunnelByCountDataProvider", {
// Inheritance from the provider "by number".
extend: "Terrasoft.FunnelByCountDataProvider",
// Contracted name of the new provider.
alternateClassName: "Terrasoft.UsrFunnelByCountDataProvider",
// Extending the FunnelByCountDataProvider base module method.
// Returns filter for selection.
getFunnelFixedFilters: function() {
// Calling the parent method.
var esqFiltersGroup = this.callParent(arguments);
// Adds filter specifying that the customer of an opportunity is an account.
esqFiltersGroup.addItem(
Terrasoft.createColumnIsNotNullFilter("Account"));
© 2023 Creatio. All rights reserved.Enable additional filtering in a sales pipeline | 21
return esqFiltersGroup;
}
});
});
Save the module.
3. Implementing the pipeline chart module in custom package
To use the new provider module in calculations, cerate a replacing client module and specify FunnelChartSchema
from the Opportunity package as a parent schema (fig. 2).
Fig. 2. Properties of the replacing module
4. Specify the new calculation provider in the sales pipeline replacing
schema
Override the provider generator method of sales pipeline calculation in the replacing schema and specify the new
provider class for calculations.
The replacing schema source code is as follows:
define("FunnelChartSchema", ["UsrFunnelByCountDataProvider"], function() {
return {
entitySchemaName: "Opportunity",
methods: {
getProvidersCollectionConfig: function() {
// Calls parent method returning the provider array.
var config = this.callParent();
// Searches for data provider for displaying in the “Number of opportunities” view.
var byCount = Terrasoft.findItem(config, {tag: "byNumberConversion"});
// Changes for a new class.
byCount.item.className = "Terrasoft.UsrFunnelByCountDataProvider";
return config;
}
}
};
© 2023 Creatio. All rights reserved.Add a custom dashboard widget | 22
});
After you save the schema, the new calculation module will be used in the sales pipeline. It will display the
opportunities whose [ Customer ] field is populated with an account.
Add a custom dashboard widget
Advanced
Dashboard widgets (analytic elements) are used for data analysis of sections. Go to the “Dashboards” view of
the required section to work with its analytics. Use the [ Dashboards ] section to work with the entirety of Creatio
section data analytics.
To learn more about Creatio dashboard widgets, please refer to the View analytics article.
You can create custom dashboard widgets in Creatio.
To create a custom widget you need to:
1. Create new or select the existing module. More information about dashboard widget modules can be found in
the “Dashboard widgets” article.
2. Custom module must be an inheritor of the BaseNestedModule module or one of its inheritors: ChartModule ,
IndicatorModule , GaugeModule , etc. Add the source code that implements the necessary functionality to the
created module.
3. Specify the module dependency in the [Dependencies] block of the module properties. Add messages that are
used.
4. Set the widget parameters in the [Module parameters] field when adding widgets on the dashboards panel.
More information about parameters can be found in the “Dashboard widgets” article.
Case description
Create custom widget that shows currency exchange rate.
Source code
Use this link to download the case implementation package.
Case implementation algorithm
1. Create a currency indicator module.
Go to the [ Configuration ] section in the system designer and on the [ Schemas ] tab, select [ Add ] ->
[ Standard ] -> [ Module ] command. For the created module specify (Fig. 1):
[Name] – “UsrCurrencyIndicatorModule”.
[Title] – “Currency Indicator Module”.
© 2023 Creatio. All rights reserved.Add a custom dashboard widget | 23
Fig. 1. Currency indicator module properties
2. Add the source code
The module source code:
define("UsrCurrencyIndicatorModule", ["UsrCurrencyIndicatorModuleResources", "IndicatorModule"],
// Class that generates the configuration of the currency indicator module view..
Ext.define("Terrasoft.configuration.CurrencyIndicatorViewConfig", {
extend: "Terrasoft.BaseModel",
alternateClassName: "Terrasoft.CurrencyIndicatorViewConfig",
// Generates the configuration of the currency indicator module view.
generate: function(config) {
var style = config.style || "";
var fontStyle = config.fontStyle || "";
var wrapClassName = Ext.String.format("{0}", style);
var id = Terrasoft.Component.generateId();
// The returned configuration view object.
var result = {
"name": id,
"itemType": Terrasoft.ViewItemType.CONTAINER,
"classes": {wrapClassName: [wrapClassName, "indicator-module-wrapper"]},
"styles": {
"display": "table",
"width": "100%",
"height": "100%"
},
"items": [
{
"name": id + "-wrap",
"itemType": Terrasoft.ViewItemType.CONTAINER,
"styles": {
"display": "table-cell",
"vertical-align": "middle"
},
© 2023 Creatio. All rights reserved.Add a custom dashboard widget | 24
"classes": {wrapClassName: ["indicator-wrap"]},
"items": [
// Display the name of the currency.
{
"name": "indicator-caption" + id,
"itemType": Terrasoft.ViewItemType.LABEL,
"caption": {"bindTo": "CurrencyName"},
"classes": {"labelClass": ["indicator-caption"]}
},
// Display the currency exchange rate.
{
"name": "indicator-value" + id,
"itemType": Terrasoft.ViewItemType.LABEL,
"caption": {
"bindTo": "CurrencyValue"
},
"classes": {"labelClass": ["indicator-value " + fontStyle]}
}
]
}
]
};
return result;
}
});
// Class of the view model of the currency indicator module.
Ext.define("Terrasoft.configuration.CurrencyIndicatorViewModel", {
extend: "Terrasoft.BaseModel",
alternateClassName: "Terrasoft.CurrencyIndicatorViewModel",
Ext: null,
Terrasoft: null,
sandbox: null,
columns: {
// Currency name.
CurrencyName: {
type: Terrasoft.core.enums.ViewModelSchemaItem.ATTRIBUTE,
dataValueType: Terrasoft.DataValueType.TEXT,
value: null
},
// Currency value.
CurrencyValue: {
type: Terrasoft.core.enums.ViewModelSchemaItem.ATTRIBUTE,
dataValueType: Terrasoft.DataValueType.FLOAT,
value: null
}
},
onRender: Ext.emptyFn,
// Returns the currency value, depending on the name. This method is given as an example.
© 2023 Creatio. All rights reserved.Add a custom dashboard widget | 25
// For each specific task, you should select an individual method to obtain data,
// for example REST API, database query, etc.
getCurrencyValue: function(currencyName, callback, scope) {
var result = 0;
if (currencyName === "USD") {
result = 26;
}
if (currencyName === "EUR") {
result = 32.3;
}
if (currencyName === "RUB") {
result = 0.45;
}
callback.call(scope || this, result);
},
// Gets the data and displays them on the widget.
prepareIndicator: function(callback, scope) {
this.getCurrencyValue(this.get("CurrencyName"), function(currencyValue) {
this.set("CurrencyValue", currencyValue);
callback.call(scope);
}, this);
},
// Initializes the widget.
init: function(callback, scope) {
this.prepareIndicator(callback, scope);
}
});
// Widget module class.
Ext.define("Terrasoft.configuration.CurrencyIndicatorModule", {
extend: "Terrasoft.IndicatorModule",
alternateClassName: "Terrasoft.CurrencyIndicatorModule",
// The name of the wdget view model class.
viewModelClassName: "Terrasoft.CurrencyIndicatorViewModel",
// The name of the view configuration generating class.
viewConfigClassName: "Terrasoft.CurrencyIndicatorViewConfig",
// Subscribing to messages from third-party modules.
subscribeMessages: function() {
this.sandbox.subscribe("GenerateIndicator", this.onGenerateIndicator, this, [this.sandbox.id
}
});
return Terrasoft.CurrencyIndicatorModule;
});
3. Add a style to the LESS tab
© 2023 Creatio. All rights reserved.Add a custom dashboard widget | 26
To display the widget text at the center, add the following style to the LESS tab of the module:
.indicator-module-wrapper {
text-align: center;
}
3. Add the dependencies and messages
The dependencies and messages of parent module should automatically display in the created module (Fig. 2).
Fig. 2. Dependencies and messages of created module
If it doesn’t happen, add them manually:
Add a parent module to the [Dependencies] block
Add the GetIndicatorConfig message to the [Messages] block. Sett the “Publish” direction for the message
and the GenerateIndicator as address message with the “Follow” direction.
Save the new module.
5. Add the widget to the dashboard panel and set its parameters
To display the widget, add it to the dashboard panel (Fig. 3).
Fig. 3. Adding the widget to the dashboard panel
© 2023 Creatio. All rights reserved.Add a custom dashboard widget | 27
In addition, you need to set the parameters of the module bound to the widget (Fig. 4).
Fig. 4. Configuration of the added widget module
To bind the module to the added widget, add the “Currency Indicator Module” value in the [ Module ] field and add
the configuration JSON object with the required parameters to the [ Module parameters ] field.
{
"parameters": {
"CurrencyName": "USD",
"style": "widget-blue"
},
"configurationMessage": "GetIndicatorConfig"
}
© 2023 Creatio. All rights reserved.BaseWidgetDesigner schema | 28
A “ CurrencyName ” parameter sets the currency for which the exchange rate is displayed. A “ style ” parameter
sets the widget style and “ configurationMessage ” parameter sets the message name that will be used to transfer
the configuration object.
You can set up any of Creatio system colors in the style parameter as widget color (Fig. 5).
Fig. 5. Style types of the widget
After saving the created widget and refreshing the page, the custom widget will be displayed on the dashboards
panel (Fig. 6).
Fig. 6. Currency exchange rate widget
BaseWidgetDesigner schema JS
Advanced
© 2023 Creatio. All rights reserved.DashboardEnums enumeration | 29
BaseWidgetDesigner – base widget settings view schema.
Methods
getWidgetConfig()
returns the current widget settings object.
getWidgetConfigMessage()
Returns the name of the message used for getting widget module settings.
getWidgetModuleName()
Returns the name of the widget module.
getWidgetRefreshMessage()
Returns the name of the widget update message.<
getWidgetModulePropertiesTranslator()
Returns the connecting object of widget module properties and widget module settings.
DashboardEnums enumeration JS
Advanced
DashboardEnums – contains an enumeration of widget properties.
Terrasoft.DashboardEnums.WidgetType – contains the widget view mode and design mode configuration of the
dashboards.
Properties
moduleName
Widget module name.
configurationMessage
The name of the module settings receiving message.
© 2023 Creatio. All rights reserved.DashboardEnums enumeration | 30
resultMessage
The name of the message that returns widget designer module settings.
stateConfig (stateObj)
Widget designer schema name.
© 2023 Creatio. All rights reserved.You can also read