COVID-19 IMPACT AND RECOVERY - February 2, 2022 - Montgomery County, MD
←
→
Page content transcription
If your browser does not render page correctly, please read the page content below

COVID-19 IMPACT AND RECOVERY
       February 2, 2022
RESPONSE: EMERGENCY
ASSISTANCE & DEMAND

COVID-19 RENTAL RELIEF UPDATE: WEEK OF JAN 24–30
      APPLICATIONS BY WEEK (ENDED 12/31)                     APPLICANT HOUSEHOLD CHARACTERISTICS
            11,161 total applications
          (excluding 3,706 duplicate applications in grey)

           APPLICANT CHARACTERISTICS
•   51% matched with landlord application
•   53% unemployed past 90 days
•   29% needed to care for self/others
•   23% self-reported receiving an eviction notice
•   Median household income: $20,926
COVID-19 RENTAL RELIEF UPDATE: WEEK OF JAN 24–30
APPLICATION PROCESSING APPROVALS
Denials are primarily Total Approved Payments: $48.3M
(4-day workweek in light blue)
due to applicants not
2.1M
2.1M
2.1M
having
2.0M
1.9M
1.8M
1.7M
1.7M
1.7M
1.7M
1.7M
1.7M
arrears/mortgage
1.6M
1.5M
1.5M
1.5M
1.4M
1.4M
1.4M
1.3M
1.2M
assistance requests,
1.2M
1.1M
1.1M
1.1M
1.1M
1.1M
1.1M
1.1M
1.0M
0.9M
0.9M
0.8M
0.8M
exceeding income
requirements, not
0.3M
demonstrating county
residency, and include
10-18
11-15
11-29
12-13
12-27
5-31
6-14
6-28
7-12
7-26
8-23
9-20
10-4
11-1
1-10
1-24
8-9
9-6
non-responsive and
fraudulent requests.
Total Approved Households: 4,785
(4-day workweek in light blue)
ALL-TIME TOTALS
210
202
198
197
186
184
182
179
177
165
164
163
152
149
145
141
The current round of funding adds to two previous
137
133
132
130
122
121
118
110
109
109
106
105
104
100
rounds of COVID-19 assistance. In total, the Emergency
98
88
73
72
Rental Assistance Program has approved:
24
• $66.2M in payments
10-18
11-15
11-29
12-13
12-27
5-31
6-14
6-28
7-12
7-26
8-23
9-20
10-4
11-1
1-10
1-24
8-9
9-6
• 9,281 households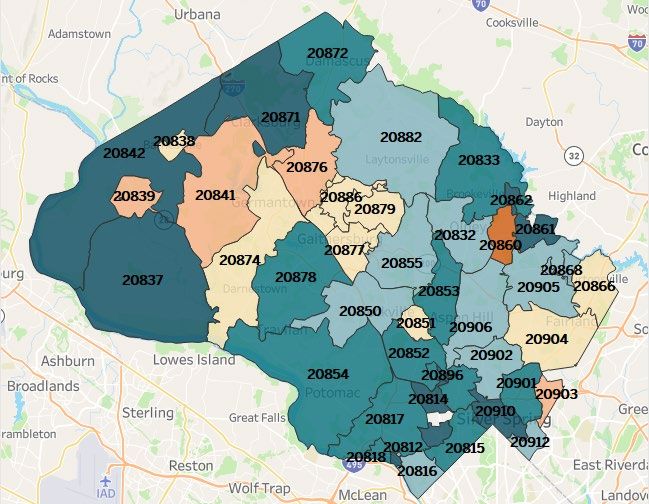
COVID-19 RENTAL RELIEF UPDATE: WEEK OF JAN 24–30
 HEATMAP OF RECIPIENT HOUSEHOLDS            RECIPIENT RACE/ETHNICITY

                                     ADDITIONAL RECIPIENT CHARACTERISITICS

                                   • Average client payment: $10.1K
                                   • 64% of payments arrears; 36% prospective
                                   • 47% of awarded households are in high-
                                    need areas as defined by the Homeless
                                    Prevention Index
COVID-19 RENTAL RELIEF UPDATE: WEEK OF JAN 24–30
               DIRECT ERAP EXPENDITURES                                              STATE EXPENDITURES BY COUNTY
                                                                                                           As of 11.30.2021
              Award
                                                                             Montgomery
         $31.4M                                                          Prince George's                                                     $20.1M
                                                                                                                                                        $25.2M

                                                  93%                           Wicomico
                                                                           Baltimore City
                                                                                                               $8.7M
                                                                                                               $8.4M
     Current spending and                      OF FUNDS
                                                                             Washington                     $6.6M
         encumbered                                                               Charles               $3.8M

         $29.3M                                                                      Cecil
                                                                                    Carroll
                                                                                                        $3.7M
                                                                                                    $1.6M
                                                                                St. Mary's          $1.6M
                                                                               Worcester            $1.4M
                                                                                   Calvert         $1.2M
                STATE ERAP EXPENDITURES                                          Caroline          $1.1M
                                                                                 Allegany          $1.1M
              Award                                                                 Talbot         $1.0M

          $28.1M                                                            Anne Arundel
                                                                           Queen Anne's
                                                                                                  $0.8M
                                                                                                  $0.7M
                                                100%                          Dorchester          $0.7M
                                                                                Somerset          $0.6M
     Current spending and                      OF FUNDS
                                                                                     Kent        $0.4M
         encumbered                                                                Garrett       $0.3M
          $28.1M                                                        Baltimore County
                                                                                Frederick
                                                                                                 $0.0M
                                                                                                 $0.0M

Note: Spending and percentages may shift as payments are reconciled.   Source: Maryland Department of Housing and Community Development, https://bit.ly/3DQSVZV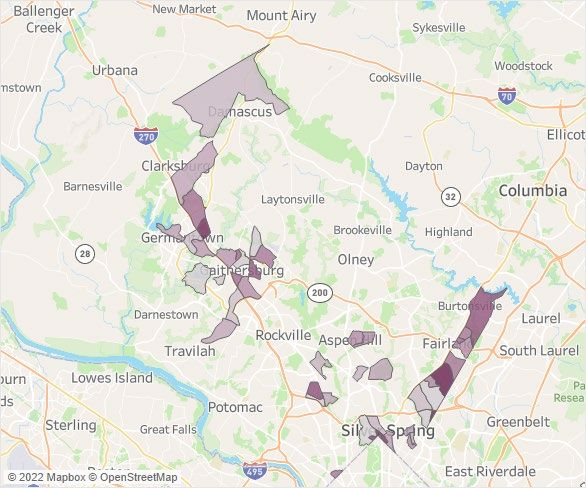
EVICTION TRACKER
NEW WRITS BY WEEK       • 897 residents scheduled for eviction
                          after July 19
                        • 46% of households with writ have
                          applied for emergency rental
                          assistance
                        • Context: fewer than 8% of writs
                          typically result in eviction

                        NOTE: Records on writs for eviction can
                        include commercial tenants as well as
                        multiple notices for a single household.
                        The stats above attempt to capture
                        unique residential households only, but it
                        is not always possible to make such
                        distinctions.
SHELTER OCCUPANCY

NOTE: Total occupancy does not include hotels providing shelter to those who are in quarantine or isolation.

MC311 WEEKLY CALL VOLUME: DHHS
    WEEKLY CALLS BY DEPARTMENT                    WEEKLY CALLS FOR PUBLIC ASSISTANCE
1,334 calls last week for DHHS services        392 calls last week for public assistance*

                                          * Due to changes in the referral system, this metric has changed from counting the number of
                                          calls asking how to apply for public assistance to the number of calls asking about other
                                          aspects of public assistance. Those who want to apply for public assistance are now referred to
                                          MD Think and are not necessarily captured in the count displayed above.
MC311 WEEKLY CALL VOLUME: DHHS
          PUBLIC HEALTH                 SERVICES TO END & PREVENT HOMELESSNESS
358 calls last week for Public Health         342 calls last week for SEPH
   46% related to COVID-19                     57% related to COVID-19
UNEMPLOYMENT RATES IN THE REGION
Fairfax County DC-Metro Region Montgomery County
12%
10.2
10%
9.4
8.6 8.6
8.2
8% 7.7
8.5
8.1
6.7
6.6 6.4
5.9
6% 6.7 5.7 5.7 5.7
5.8 4.9
5.6 5.5 5.6
4.3
5.0 5.0
4.8
4%
3.2 2.9 4.2
4.1
2.6 3.1 3.7
2.5 3.6 3.6
2% 2.7
2.3 2.2 2.2 2.3
2.0 1.9
0%
Nov '19
Mar '20
May '20
Nov '20
Mar '21
May '21
Nov '21
Jul '19
Jul '20
Jul '21
Jan '20
Jan '21
Sep '19
Sep '20
Sep '21COVID-19 CASES, VACCINATIONS, & TESTING
COVID-19 CASES & POSITIVITY RATE
Cases and positivity rate show a sharp decline since early January. Since last week, average cases
over seven days decreased by 53% and the positivity rate decreased by 4 percentage points.

                 CASES AS OF 2/1/22*                                       POSITIVITY RATE AS OF 1/31/22

*Cases may be underreported to some extent due to the increased use of self-test home kits.
NOTE: The MDH security incident disrupted prior reporting on cases and hospitalizations by vaccination status. Reporting will
resume once access to that database has been restored.

For real-time updates, visit the COVID-19 Surveillance Dashboard: https://www.montgomerycountymd.gov/covid19/data/
COVID-19 HOSPITALIZATIONS
• There are 281 hospitalized
COVID-19 patients as of
1/30/22. Both acute care and
ICU bed usage has declined.
• 18.3% of hospital beds in the
community are occupied by
patients with a COVID diagnosis.
• 69 patients are currently
hospitalized at the alternate care
site. These patients are transfers
from other hospitals and may
come from other jurisdictions.
For real-time updates, visit the COVID-19 Surveillance Dashboard: https://www.montgomerycountymd.gov/covid19/data/COVID-19 DEATHS
Monthly COVID-19 Deaths
Updated 1/31/22
Montgomery County Maryland Montgomery County as a % of Maryland
1,800 30%
1,653
1,600
25%
1,400 1,364
1,225 1,224
1,200 20%
1,029
1,000
859* 15%
800 736
651
600 549 8.7% 10%
486
454 452
414 421
400 343
300 309
229 250 5%
193 195 169 179 185
200 127 122 144
82 107 82
51 59 *78
32 27 50 30 31 29
18 21 18 11 15 18
0 0%
Mar '20 Apr '20 May '20 Jun '20 Jul '20 Aug '20 Sep '20 Oct '20 Nov '20 Dec '20 Jan '21 Feb '21 Mar '21 Apr '21 May '21 Jun '21 Jul '21 Aug '21 Sep '21 Oct '21 Nov '21 Dec '21 Jan '22
*VSA revised death data on May 27, 2021 to include COVID-19 deaths not previously counted.COVID-19 CASES & DEATHS BY VACCINATION STATUS: US The CDC has case and death data of jurisdictions representing more than half the US population, showing that in November, unvaccinated adults (ages 18+) had 4X the risk of testing positive for COVID-19, and 15X the risk of dying from COVID-19 compared to fully vaccinated adults. Source: https://covid.cdc.gov/covid-data-tracker/#rates-by-vaccine-status
COVID-19 CASES & DEATHS BY VACCINATION STATUS: US
  The same analyses showed that in November, unvaccinated adults (ages 18+) had 13X the risk of testing
  positive for COVID-19, and 68X the risk of dying from COVID-19 compared to fully vaccinated adults
  with a booster.

Source: https://covid.cdc.gov/covid-data-tracker/#rates-by-vaccine-status
COVID-19 VACCINATIONS: TOTALS FROM CDC
         TOTAL VACCINATIONS (AS OF 2/1/22)                                                            VACCINATIONS BY AGE GROUP
• ≥95%1 of total population received at least                                                                                              At Least 1   Fully Vaccinated

  ONE DOSE [N=1,041,814]                                                                     ≥95% 94%            ≥95%
                                                                                                                        89%
                                                                                                                                     ≥95% 87-96%

• 84%2 of total population received at least                                                                                                            64-69%
  TWO DOSES (fully vaccinated) [N=881,952]                                                                                                                     49-53%

• 50% of fully vaccinated population received
  a BOOSTER/ADDITIONAL DOSE [N=442,768]
1. The CDC caps percentages at 95% to account for margins of error in data entry
   and population estimates.                                                                  AGE 12+              AGE 5+           AGES 12-17           AGES 5-11
2. On 1/19 the CDC revised its method for counting vaccines administered at Bureau     Chart reflects percent of total age group population that received doses. Percentage
   of Prisons and at Department of Defense facilities to better align vaccine counts   estimates are reflected as ranges for ages 12-17 and ages 5-11 due to higher margins
   with residential county of recipient instead of county where vaccine was            of error.
   administered. This revision has decreased the vaccine county for Montgomery
   County.                                                                             • 55% of the fully vaccinated 18+ population
                                                                                         received a BOOSTER/ADDITONAL DOSE
                                                                                          [N=417,860]
NOTE: The CDC vaccination count includes Montgomery
County residents who received their shots in Maryland or                               • 74% of the fully vaccinated 65+ population
outside the state. It also includes vaccinations administered                            received a BOOSTER/ADDITIONAL DOSE
in some federal entities within Montgomery County.                                        [N=121,640]
COVID-19 VACCINATIONS: FIRST-DOSE WEEKLY VOLUME
Charts below show most recent full weeks of data, up to January 23, 2022.
VACCINATIONS BY TYPE ADDITIONAL DOSES BY AGE GROUP
An additional dose is the third dose identified on or after 8/13 for individuals first administered
Pfizer or Moderna, and the second dose identified for individuals first administered J&J.
Calculations also account for at least 2 months between prior dose and additional dose to help
circumvent data entry errors. Note that total counts are estimations and not precise due to entry
errors and missing doses for Marylanders who received any of their doses out of state.
Unlike the CDC vaccination data, data from Maryland Health Department only include Montgomery County residents who were vaccinated in
Maryland. Totals do not include vaccinations administered at federal entities within the county to non-residents.COVID-19 VACCINATIONS: GAPS
TRACTS WITH BELOW AVERAGE FIRST-DOSE RATES FIRST-DOSE VACCINATION RATES BY RACE
ADDITIONAL DOSE RATES BY RACE & AGE
Across the highlighted tracts above, 29% of the population is White non-
Hispanic, 27% is Black non-Hispanic, 26% is Hispanic, and 14% is Asian/Pacific
Islander.COVID-19 VACCINATIONS: PEDIATRIC VACCINATIONS
FIRST DOSES BY RACE/ETHNICITY VACCINATION RATES BY ZIP CODE
% of 5-11 population % of 5-11 year olds who received first dose Vaccination rates among residents ages 5-14 are used as a proxy for pediatric
vaccination rates in the map below due to the availability of population
60%
estimates only for certain age categories. Zip codes with fewer than 100
41%
residents ages 5-14 are excluded.
40% 34%
26%20%
20%16%
20% 13%16%
8% 7%
0%
Black or AA Hispanic Asian or PI White Other
Nearly 1% of vaccinated children identify as Native American; they are included in the “Other”
category. Approximately 3% of pediatric records do not contain race/ethnicity information.
PEDIATRIC VACCINE PROVIDERS
Other
2% Pharmacies & Pediatric vaccinations
Grocery Stores are distributed evenly
Montgomery 30%
between Montgomery
County DHHS
34% County DHHS (in
partnership with MCPS,
Physicians' physicians and medical
Offices &
Hospitals clinics, and pharmacies
Medical Clinics
2% and grocery stores.
32%COUNTY GOVT COORDINATED TESTING & VACCINATIONS
DHHS-ADMINISTERED TESTING: 4,490 TESTS ADMINISTERED LAST WEEK
DHHS-ADMINISTERED VACCINATIONS: 2,454 DOSES ADMINISTERED LAST WEEK
14K 12.8K
11.6K
12K 11.0K Pediatric second dose
9.9K
8.8K 9.1K
10K 8.5K Pediatric first dose
8K 7.0K 6.7K 7.1K 6.2K
Adult additional dose
6K 4.7K
3.5K Adult second dose
4K 1.9K 2.5K
1.6K 1.6K 1.4K 1.3K 1.2K 1.5K 1.3K
2K Adult first dose or single dose
0
7/6
7/12
7/19
7/26
8/2
8/9
8/16
8/23
8/30
9/6
9/13
9/20
9/27
10/4
10/11
10/18
10/25
11/1
11/8
11/15
11/22
11/29
12/6
12/13
12/20
12/27
1/3
1/10
1/17
1/24
Data are subject to retroactive changes.DISTRIBUTION OF RAPID TESTS 2,144,000 additional rapid tests have been ordered by the County from vendors • A total of 2,057,000 rapid test kits have been received (as of 2/2/22) • 995,841 kits have been distributed, with an additional 196,000 allocated • 572,893 kits distributed through 3 weeks of Library distribution • 505,667 masks distributed at libraries. • 340,000 rapid test kits have been provided to MCPS. • 62,948 test kits & 108,815 masks distributed (+41k allocated) to childcare, private schools, & community non-profits. • Online portal to report rapid tests results.
DATA SOURCES
This report aggregates data from several sources, some of which are publicly available. Nearly all data are
subject to retroactive changes.

•   Rental assistance data is generated by DHHS each Sunday prior to the publication of this report.

•   Data on evictions are provided by the Montgomery County Sheriff’s Office each Monday for the week prior.

•   Data on shelter occupancy are collected by DHHS weekly.

•   MC311 data are downloaded weekly from DataMontgomery.

•   Unemployment data are downloaded monthly from FRED.

•   Case data are provided by Maryland Department of Health. Real-time data can be found on the
    Montgomery County COVID-19 Surveillance Dashboard.

•   Data on COVID-19 deaths are available through the Maryland Department of Health dashboard and ArcGIS
    platform.

•   Vaccine data are downloaded from the CDC website each Tuesday.

•   Data on county government coordinated testing and vaccinations are collected by DHHS daily.
You can also read