Technical Advisory Panel Meeting - November 18, 2021 - Colorado Department of ...
←
→
Page content transcription
If your browser does not render page correctly, please read the page content below
Technical Advisory Panel Meeting

              November 18, 2021

1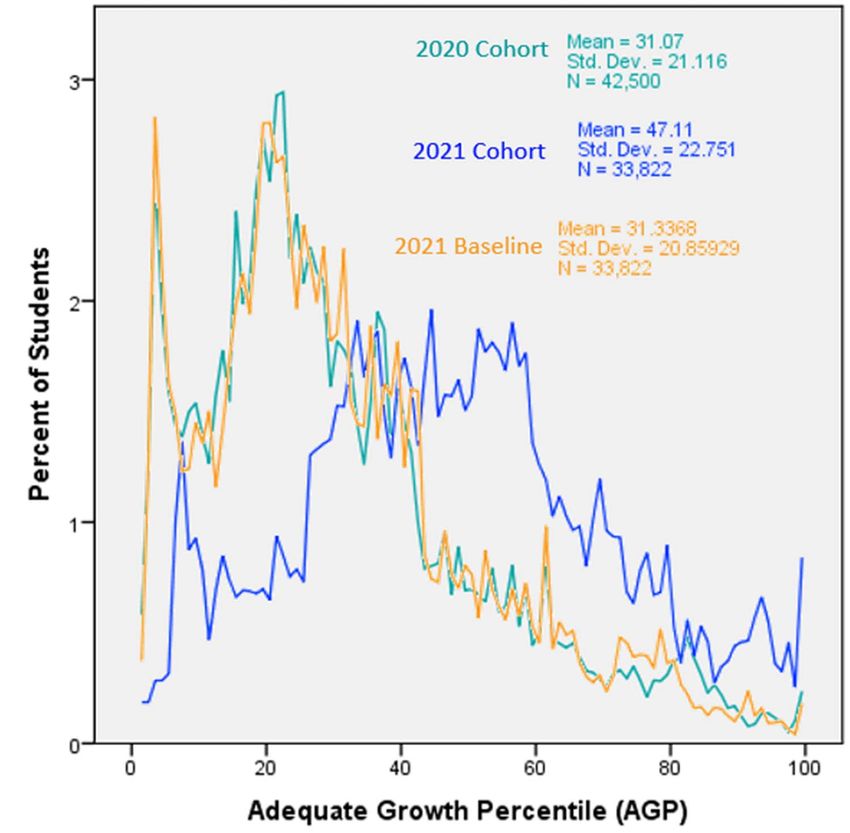
Welcome & Introductions

     • Welcome!
         • The purpose of the TAP is to provide non‐binding technical
           recommendations to CDE regarding the Colorado Growth Model, state
           accountability, and other topics as needed.

     • Meeting Logistics:
         • Non‐members please add your Name/Affiliation to the chat box.
         • Everyone please mute your sound.
         • We ask all non‐TAP members to hold any comments until the end of the
           meeting. We do this to ensure we have sufficient time to address all
           meeting agenda items.

2
Agenda for Today

    • WIDA ACCESS On Track Growth and the 6‐year Countdown
      Clock – Marie Huchton
        • Discussion and Informal TAP feedback

    • Accountability Audit Update‐ Lisa Medler
       • Information Item

    • 2022 Accountability Planning – Lisa Medler & Marie
      Huchton
       • Discussion and Informal TAP feedback

3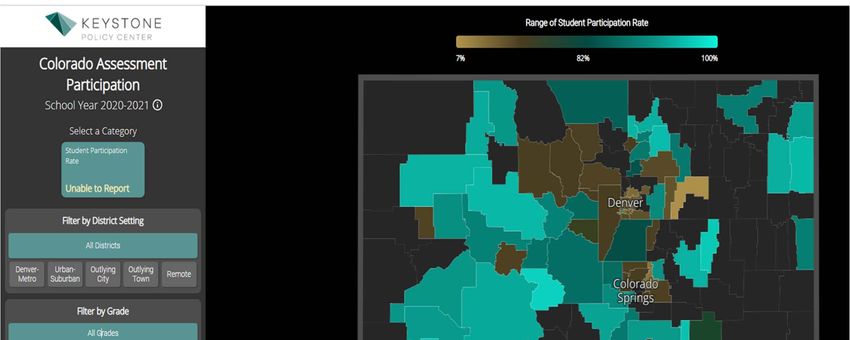
WIDA ACCESS On Track Growth and the
          6‐year Countdown Clock

                 Marie Huchton

           Discussion and Informal Feedback

4
Metrics for English Language Acquisition

       Achievement                                  Growth
       Student scale scores, performance            Students making progress in
       levels, and                                  attaining English language
       attainment of                                proficiency
       English language                                                                Level 4
                                                                                                 Level 5

       proficiency and                                           Level 2
                                                                             Level 3

       redesignation                                   Level 1

       eligibility

                        Growth To Standards (On-Track Measure)
       Students making enough progress to attain English language proficiency in
       the designated time period
                                                                                  Level 5
                                                                   Level 4
                                                      Level 3
                                          Level 2
                                Level 1

5
Growth in English Language Proficiency

• Measure of the relative growth                             Growth
  students are making on the WIDA
  ACCESS 2.0 assessment, compared to
                                         Students making progress in
  students with similar language          attaining English language
  proficiency histories                           proficiency
• Cohort-referenced growth                     (median growth
  contributed to 2019 performance                percentiles)
  frameworks and ESSA identifications                                             Level 5

• Both cohort- and baseline-                                  Level 3
                                                                        Level 4

  referenced 2021 growth results
                                                   Level 2
                                         Level 1

  provided to districts for
  informational purposes
• Baseline-referenced 2021 results
  publicly released for informational
 6   purposes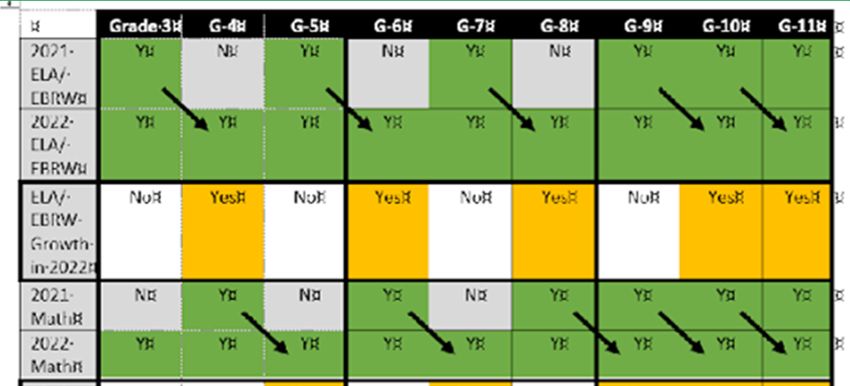
Progress in Attaining English Language
Proficiency

                       Growth To Standard (On Track Measure)
     Students making enough progress to attain English language proficiency in the
                              designated time period

• Determine what is “enough growth” for a student
  to reach language proficiency within allotted
  timeframe (also known as adequate growth)
• Adequate growth needed to reach next level of                                     Level 4
                                                                                              Level 5

  language proficiency is compared to actual                    Level 2
                                                                          Level 3

  growth percentile, and student flagged as     Level 1

  on or off track
• Aggregated ELP On Track measure included in
  2019 performance frameworks and ESSA
  identifications

 7
Stepping‐Stone Trajectories for Attaining English
Language Proficiency

       Proficiency Level Trajectory   Timeline         Relation to Redesignation
                                                           Eligibility Criteria
     Level 1 increasing to Level 2+    1 Year      6‐year timeline to achieve
                                                   redesignation eligibility criteria
     Level 2 increasing to Level 3+   2 Years
     Level 3 increasing to Level 4+   3 Years
     Level 4 staying at Level 4+       1 Year      If scoring at/above redesignation
                                                   eligibility criteria, maintain
     Level 5 staying at Level 5+       1 Year
                                                   performance level

2017 WIDA ACCESS 2.0 proficiency level used as baseline to set English‐acquisition
timelines for all ELs in program at the time and to determine whether they are on or
off‐track to meet their proficiency targets.

For ELs new to Colorado since 2017, their initial ACCESS performance has been used to
establish a projected English‐acquisition timeline and to determine whether they are
on or off‐track to meet their proficiency targets.
 8
Percent of Students On Track – 2020 Cohort‐referenced

                                                                                          33.5%
                                                                         60.7%
                                                      44.6%                         Level 5
                                     59.0%                        Level 4
                  76.3%                          Level 3
                                Level 2                    3 years
                                                                                  On Track Any
              Level 1                       2 years                               Trajectory = 53.9%
                          1 year

                    L1 to L2+      L2 to L3+   L3 to L4+    L4 & Stay      L5 & Stay    On Track Any
                     in 1 yr        in 2 yrs    in 3 yrs   L4+ in 1 yr    L5+ in 1 yr    Trajectory
     Elementary         81.1%       64.9%       64.3%         82.5%         59.6%          70.2%
     Middle             56.2%       45.7%       17.4%         42.2%         10.2%          31.0%
     High               41.2%       35.6%       16.4%         46.8%         24.4%          28.5%

9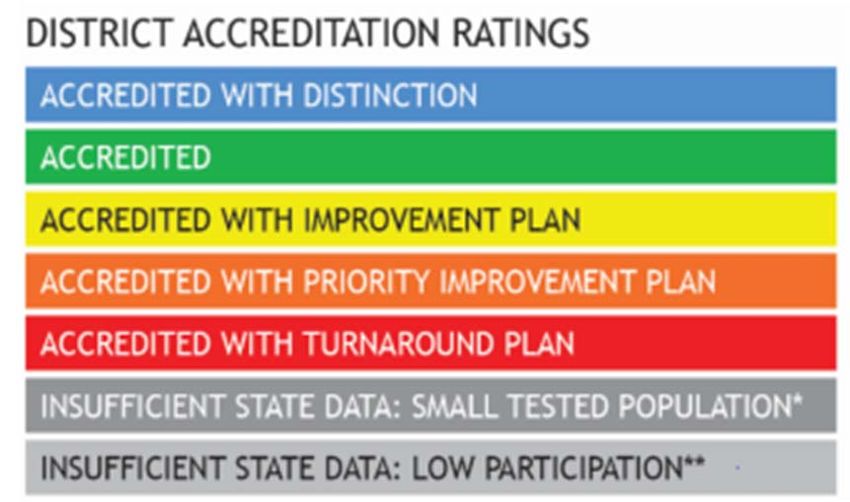
Percent of Students On Track by Year and
Referenced Norming Group– All Grades

10
Percent of Students On Track by Year and
Referenced Norming Group– Elementary

11
Percent of Students On Track by Year and
Referenced Norming Group– Middle

12
Percent of Students On Track by Year and
Referenced Norming Group– High

13
Comparison of 2020 Baseline‐ and Cohort‐
referenced SGPs – All Grades

                                           corr = 0.992

14
Comparison of 2021 Baseline‐ and Cohort‐
referenced SGPs – All Grades
corr = 0.954
15Comparison of 2021 Baseline‐ and Cohort‐
referenced AGPs – All Grades
corr = 0.959
16Distribution of Adequate Growth Percentiles by Year and Referenced Norming Group– All Grades 17
Distribution of Adequate Growth Percentiles by Year and
Referenced Norming Group– Elementary

18
Distribution of Adequate Growth Percentiles by Year and
Referenced Norming Group– Middle

19
Distribution of Adequate Growth Percentiles by Year and
Referenced Norming Group– High

20
Discussion Questions

     Discussion Item and Informal TAP feedback
     • Should CDE ask USDE if we can amend our ESSA waiver and
       increase the total number of years allowed to achieve
       proficiency? If yes, what would be the rationale and
       applicable time‐limit for this request?
     OR
     • Should CDE ask USDE if we can amend our ESSA waiver
       changing the On Track Growth targets to reflect 2021/2022
       results? If yes, what would be the rationale and applicable
       time‐limit for this request?

21
Discussion Questions
Discussion Item and Informal TAP feedback
• How should CDE approach calculating and communicating
about WIDA ACCESS Growth and On Track Growth for spring
2022?
• Baseline SGPs are lower than previous years, while AGPs stayed
consistent
• Cohort SGPs seem consistent with previous years, but AGPs are
inflated
22Accountability Audit Update
Lisa Medler
Information Item
23Implications for the future: Accountability Audit
• HB 21‐1294: Audit of Statewide Education Accountability Systems
• Audit is run by the Office of the State Auditor. They selected HumRRO to
collect and evaluate the system.
• CDE is providing data currently. HumRRO may approach districts for additional
data. Report due by November 15, 2022; made public by December 2022.
• The intent is to determine whether the current system:
• Meets the goals and intentions of the General Assembly, as stated in the legislative
declarations set forth in Section 22‐7‐1002, C.R.S., and Section 22‐11‐102, C.R.S.
• Contains institutional or cultural biases based on race, ethnicity, religion, sex, sexual
orientation, nationality, disability, age, or economic status.
• Provides an accurate, credible, and comparable assessment of public education throughout
the state.
242022 Accountability Planning
Lisa Medler & Marie Huchton
Discussion and Informal Feedback
25Current Context for Accountability
• Current policy landscape for fall 2022
• Full state assessment schedule in spring 2022
• Performance frameworks resume in fall 2022
• Elementary and Secondary Education Act (ESEA) identification
process resumes in fall 2022
• Consideration for 2022 frameworks
• We are still in a pandemic and moving toward recovery
• Many data elements will be available, but growth will be more
limited (e.g., alternating grades/content area schedule in 2021,
cannot offer 3‐year frameworks).
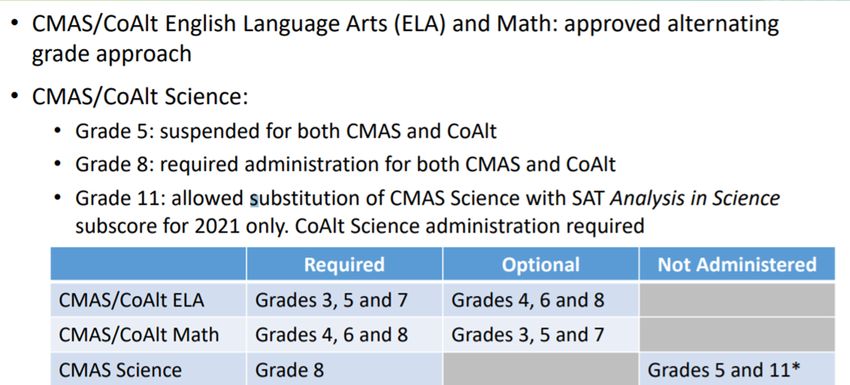
26What Data Will be Available in 2022‐23:
Anticipating Performance Frameworks
1-Year Growth Availability in 2022
Performance Availability for
Indicator
Weight
2022 Frameworks
40% 2 out of 4 possible
Elementary & grades/content available: 4th
Academic grade English/Language
Middle Schools Yes, assuming participation
Achievement Arts and 5th grade Math
in spring 2022 assessment
30% is adequate
High Schools &
Districts 3 out of 6 possible
grades/content
60% available: 6th and 8th
grade
Elementary & English/Language Arts
Middle Schools and 7th grade Math
Academic
To some degree
Growth
40%
High Schools & 5 out of 6 possible
Districts grades/content available:
10th and 11th grade
English/Language Arts
and 9 – 11th grade Math
Yes, assuming participation (Note: 9th grade math
Postsecondary 30%
in spring 2022 assessment was not released in 2019
and Workforce High Schools & due to data irregularities)
is adequate
Readiness Districts
27Projected Impact of Plan Type Assignment due to
Data Availability
Summary of Increases in ISD
Elementary Projection: From 30
(2019) to at least 187 Schools (2022)
Middle Projection: From 10 (2019) to
at least 128 Schools (2022)
High Projection: From 12 (2019) to at
least 77 Schools (2022)
These estimates are based upon 2021 state assessment data. Because 2022 assessment data is not
available yet, ISD plan types could be higher if participation is low.
28Continuum of Options for 2022 Accountability
Restart Provide
Performance Informational
Frameworks with Performance
no adjustments Frameworks
Consideration for:
• Request to Reconsider
• Impact on schools/districts on
accountability clock and with state board
directed action
• School Improvement Funds – Driving
resources to need
• Other accountability elements (e.g.,
planning, accreditation contracts)
• Assessment participation
29Themes from State Board Member Comments
• The state board is in the process of discussing the
accountability frameworks for 2022
• Generally, board members have shared the following
interests:
• Increase assessment participation and share data with the public
• Resources should follow need based on data – Push for more
supports to schools
• Some special consideration may be needed for schools/districts on
the accountability clock (e.g., offer request to reconsider)
30Current Data Requests from the State Board
• CDE’s role is not to advocate for a position but instead to
provide information and share considerations.
• We are engaging in discussions with the state board who may
likely advocate for a position. They have requested the
following information:
• Impact study on plan type assignments using 2019 data with
“missing” data elements project for 2022
• AG’s Office analysis on State Board authority to adjust accountability
system
31Gathering Input from the Field
• CDE can collect information and suggestions from the field to
share with policymakers
• What advice do you have for collecting this feedback?
Possible Questions
• What would you like policymakers to know as they think
about accountability in 2022?
• How should the state drive school improvement efforts and
resources to schools that need them most?
• How should need be defined during the pandemic recovery?
• What (if any) additional considerations should be made for
schools and districts on the accountability clock (e.g.,
request to reconsider)?
32Appendices: Supporting Documents 33
What we have learned: Resources

     ● During the August 12, 2021 State Board of Education
       meeting the 2021 State Level Assessments Results were
       presented.

     ● Statewide growth trends are available here (starting on p. 6)
       in the Baseline Growth fact sheet.

     ● School and District Dashboards

34
2021 CMAS and PSAT/SAT Assessment Schedule 35
State Assessment Participation

           Keystone Policy Center:
36         https://maps.keystone.org/missingyear/participation.html
School and District Performance Framework
Ratings (2019)
Ratings
Performance Indicator Weight
40%
Elementary & Middle
Academic Achievement
Schools
30%
High Schools & Districts
60%
Elementary & Middle
Schools
Academic Growth
40%
High Schools & Districts
Postsecondary and 30%
Workforce Readiness High Schools & Districts
37School & District Performance Frameworks
Performance
Indicator
Performance Data Weight
• Mean scale score
40%
• English language arts, math, and science assessments.
Elementary &
Academic Grade 9 PSAT Mean Scale Scores with DLM performance. Results will be
Middle Schools
Achievement combined with grade 10 PSAT and reported by content area (Evidence Based
Reading and Writing and Mathematics) in the high school achievement
indicator. Two years of grade 9 PSAT data and three years of grade 10 PSAT 30%
data will be used for the multi‐year frameworks. High Schools &
• Overall and for disaggregated groups Districts
• Median student growth percentile
60%
• English language arts and mathematics.
Elementary &
Growth will be calculated for all grades 4th to 11th in math and English
Middle Schools
Academic language arts except for 9th grade ELA (i.e. CMAS to PSAT9).
Growth • ACCESS 2.0 growth calculations from 2018 and 2019 will be included.
• Overall and for disaggregated groups 40%
High Schools &
Districts
• Graduation Rates & Dropout Rates
Postsecondary • Overall and for disaggregated groups
and • SAT Mean Scale Score 30%
• Overall and for disaggregated groups High Schools &
Workforce
• Matriculation Rate Districts
Readiness
38Availability of Growth Data in 2022‐23
ELA = English/
Language Arts
EBRW = Evidence
Based Reading
and Writing
392022 Data Availability for Elementary and Middle
Schools
2022 Growth Data Availability
‐ Elementary Elementary and Middle School
Weightings
4th Grade English/Language
Arts
4th Grade Math
5th Grade ELA
60% ‐ Academic 40% ‐ Academic
5thGrade Math Growth Achievement
2022 Growth Data Availability
– Middle School
6th Grade ELA
6th Math
7th Grade ELA
7th Grade Math
8th Grade ELA
40 8th Grade Math2022 Data Availability for High Schools and
Districts
High Schools and Districts 2022 Growth Data Availability – High School
9th Grade Evidence‐Based Reading & Writing
9th Math (Note: 9 th grade math was not released in 2019 due to data irregularities)
30% ‐ Post
Secondary & 30% ‐ Academic 10th Grade EBRW
Workforce Achievement
Readiness
10th Grade Math
11th Grade EBRW
11th Grade Math
40% ‐ Academic
Growth
2022 Growth Data Availability – Districts
Available: 4th g ELA, 5th g Math, 6th g ELA, 7th
Math, 8th g ELA, 9th Math, 10th g EBRW, 10th g
Math, 11th g EBRW, 11th g Math
Not Available: 4th g Math, 5th g ELA, 6th g
Math, 7th g ELA, 8th g Math, 9th g EBRW
41CMAS and PSAT/SAT Achievement
CMAS English Language Arts Achievement CMAS Math Achievement
2019 2021 2019 2021
2021 Participation 2021 Participation
Grade n MSS n MSS % Grade n MSS n MSS %
65,004
Grade 3 62,809 739.6 46,195 735.8 75.8% Grade 4 734.8 47,100 729.2 75.7%
Grade 5 65,812 746.8 47,194 745.7 74.4% Grade 6 65,174 732.1 45,144 726.2 68.6%
Grade 7 62,753 745.2 43,163 741.8 63.7% Grade 8 59,343 735.4 39,523 729.8 57.9%
PSAT/SAT EBRW Achievement PSAT/SAT Math Achievement
2021
2019 2021 2019 2021
Participation 2021 Participation
Grade n MSS n MSS % Grade n MSS n MSS %
All 182,018 478.4 149,948 485.6 74.9% All 182,152 467.2 149,948 467.2 74.9%
42ACCESS Achievement
ACCESS Domains - Elementary ACCESS Domains - Middle ACCESS Domains - High
2019 2021 2019 2021 2019 2021
Domain n MSS n MSS Domain n MSS n MSS Domain n MSS n MSS
57066 302 44723 292 18339 349 13084 343 17476 366 10738 365
Overall Overall Overall
57066 295 44871 285 18339 343 13231 336 17476 368 10904 367
Literacy Literacy Literacy
57066 347 45362 337 18339 404 13450 400 17476 400 11289 402
Listening Listening Listening
57066 301 45345 293 18339 352 13440 347 17476 381 11263 382
Reading Reading Reading
57066 286 44991 277 18339 324 13127 318 17476 321 10777 321
Speaking Speaking Speaking
57066 289 44884 277 18339 334 13231 325 17476 355 10908 351
Writing Writing Writing
43CMAS and ACCESS Growth (Baseline Growth)
CMAS Math Growth CMAS English Language Arts Growth
2021
2019 2021 2019 2021
2021 Participation Participation
Grade n MSS n MSS % Grade n MSS n MSS %
Grade 6 60,176 50 40,752 33 68.6% Grade 5 60,656 50 41,521 46 74.4%
Grade 8 53,119 50 35,622 37 57.9% Grade 7 57,980 50 39,012 40 63.7%
WIDA ACCESS Growth
2020 2021 2021 Participation
Grade n MGP n MGP %
Elem 42,537 51 34,676 32 86.1%
MS 15,035 51 11,476 35 77.9%
HS 13,216 51 8,879 50 64.7%
Note: PSAT/SAT Growth is not available.
44Technical Advisory Panel
• Meeting Summary
• Suggested future analysis
• TAP recommendations from this meeting
• Public Comment
• Close Meeting
• Next Scheduled Meeting: January 27th
45You can also read