Overview of water quality in the Upper Waiau - Te Anau area - For the Te Anau Basin Catchment Group
←
→
Page content transcription
If your browser does not render page correctly, please read the page content below
Overview of
       water quality in the
Upper Waiau – Te Anau area

       For the Te Anau Basin Catchment Group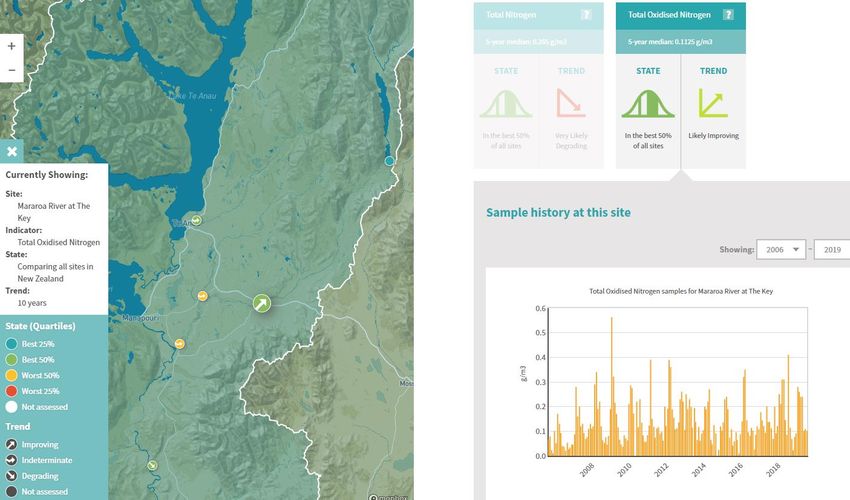
Prepared For
Te Anau Basin Catchment Group & Thriving Southland
Prepared By
Landpro Ltd
13 Pinot Noir Drive
PO Box 302
Cromwell

Tel +64 3 445 9905

                                             i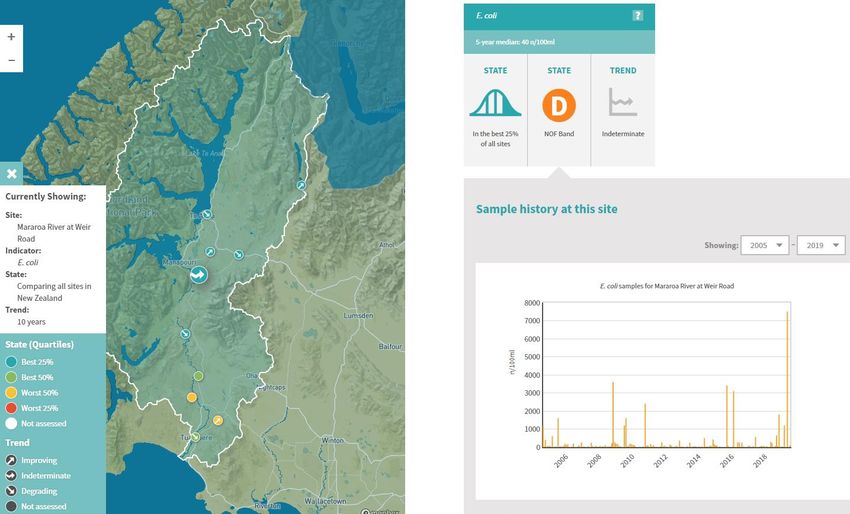
QUALITY INFORMATION
Reference:                  L:\20266 - Thriving Southland - Literature Review\Docs\Notes for Te Anau
                            group\140421 20266 Upper Waiau Te Anau presentation notes final.docx

Date:                       14 April 2021
Prepared by:                Mike Freeman
Reviewed by:                Simon Park
Client Review:              Poppy Hardie
Version Number:             Final

Disclaimer:
We have prepared this report for our client based on their instructions. They may use it, as agreed between us.
Landpro has no duty, and does not make or give any express or implied representation or guarantee, whatsoever
to any person other than our client. If you are not our client then, unless this report has been provided to you as
a local authority or central government agency as part of a public process:
    •    you have no right to use or to rely on this report or any part of it, and
    •    you may not reproduce any of it.
We have done our best to ensure the information is fit for purpose at the date of preparation and meets the
specific needs of our client. This report has been done using the information supplied and publicly available
information. Sometimes things change or new information comes to light. This can affect our recommendations
and findings.

                                              © Landpro Limited 2021

                                                           ii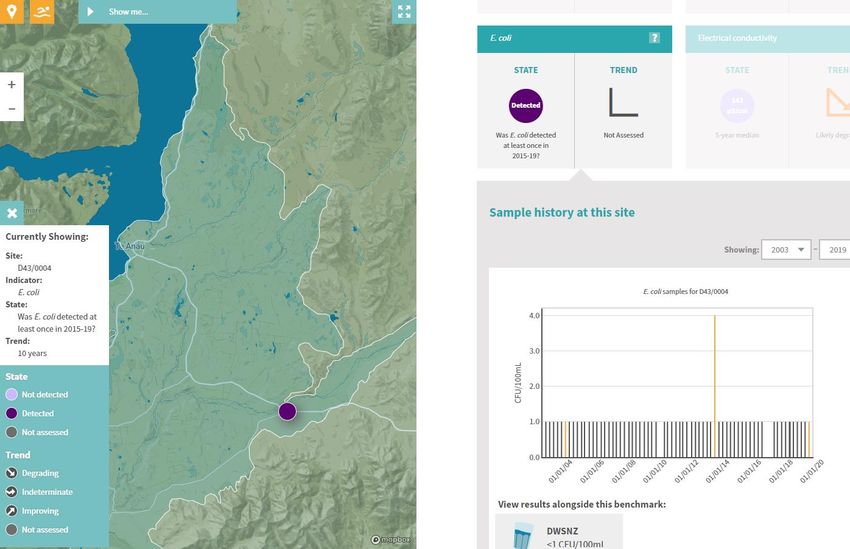
1.         Introduction
Thriving Southland has asked Landpro to provide a brief report that provides more background
information to explain the summary of information on water quality of the Upper Waiau - Te
Anau area provided in an earlier report1.
The outline information that was included in the original literature report is provided in Appendix
A. The report considers river water quality and groundwater only. It does not consider lake water
quality. This brief report provides additional background information and context to understand
the state and trends of water quality in this area.
The summary information focussed on two water quality indicators, E. coli and nitrate nitrogen,
because with just two indicators a reasonable understanding can be developed of water quality,
the likely pressures on water quality, and the extent of water quality improvement that may be
needed to meet current regional and national requirements.

2.         Water quality standards
A key water quality consideration is comparing water quality with reference water quality
standards. In Southland, the relevant regional plans include a range of water quality standards.
However, in September 2020 Central Government released the National Policy Statement
Freshwater Management 2020 (NPSFM). This document includes a National Objectives
Framework (NOF) that includes detailed Water Quality Attributes with a banding (grading)
system (A, B, C, D & E) (See Appendix B) and for most attributes, National Bottom Lines, that
are designed to be the lowest acceptable water quality. This highly complex approach effectively
sets minimum national water quality standards and regional councils have to develop regional
plans that ensure that the national bottom lines are met. The key water quality standards
(attributes) are: phytoplankton, periphyton, total nitrogen, total phosphorus, ammonia, nitrate,
dissolved oxygen, suspended fine sediment, and Escherichia coli (E. coli).
This report focuses specifically on E. coli and nitrate nitrogen.

3.         River water quality - E. coli & water contact recreation
       •   Indicator of microbial pathogens (disease-causing organisms) – important for water use.
       •   Microbiological water quality monitoring and reporting are complex and risk-based.
       •   ‘A’ is the best grade but surface waters in agricultural catchments will have some level of
           microbiological contamination.
       •   Indirect rough indicator of surface run-off contaminants such as sediment and phosphorus.

The summary results that show Mararoa River at the Key having a five-year median grade of ‘D”
indicates that the water quality has a relatively high risk of infection for swimming or similar water
contact recreation. However, this result needs to be interpreted carefully. Sometimes, they can
indicate recent poor water quality. These are the current NPSFM somewhat complex definitions:

1
    https://www.thrivingsouthland.co.nz/science-report/
                                                          1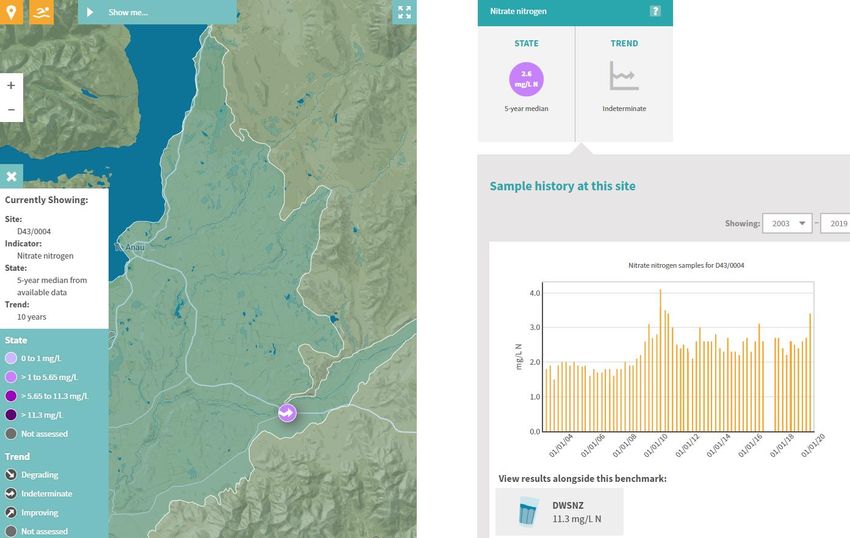
Band   NPSFM Description – for water contact recreation                 English translation
    A      For at least half the time, the estimated risk is 3%*.             unsuitable
    E      For more than 30% of the time, the estimated risk is >=50 in Bad - definitely
           1000 (>5% risk). The predicted average infection risk is >7%*.

Long-term relatively frequent water quality monitoring and an understanding of infection risk is
needed to build an understanding of the suitability of water for swimming. Environment Southland
(ES) has been carrying monthly microbiological monitoring for over 15 years so a reasonable
understanding has developed. Five-year trends can be potentially misleading, or they can indicate
recent changes. For example, the reported five-year state and trend data needs to be considered
carefully in the context of whether the data indicates a real change occurring or just the timing of
sampling and high flows/time of year.

Environment Southland monitoring data is provided to the national LAWA water quality reporting
website2. Microbiological water quality reporting be challenging to interpret. For example, the data
for the Mararoa River at Weir Road is illustrated below and on the following page.

Figure 1. E. coli data for Mararoa River at Weir Road (LAWA website, ES data)

2
    www.lawa.org.nz
                                                     2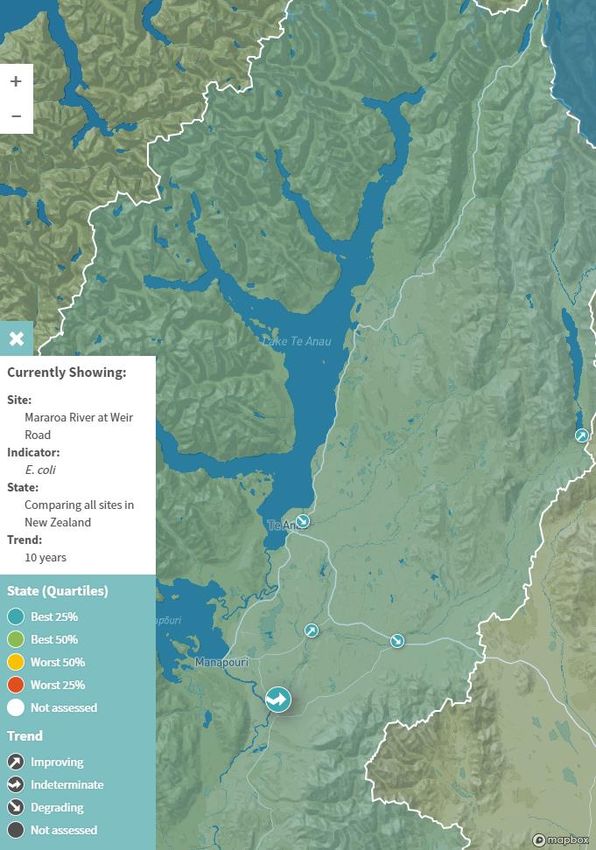
Mararoa River at
                                                                     South Mavora Lake

                                                               Upukerora River at Te
                                                                Anau-Milford Road

                          Whitestone River D/S
                           Manapouri Hillside

                                                                              Mararoa River
                                                                                at the Key

                                                         Mararoa River
                                                         at Weir Road

Figure 2 River E. coli monitoring site locations (LAWA website, ES data)

In summary, the microbiological water quality data for river water quality (no lake E. coli data) in this
area indicate that at times the water quality is relatively poor (D Band), while at other times the
                                                   3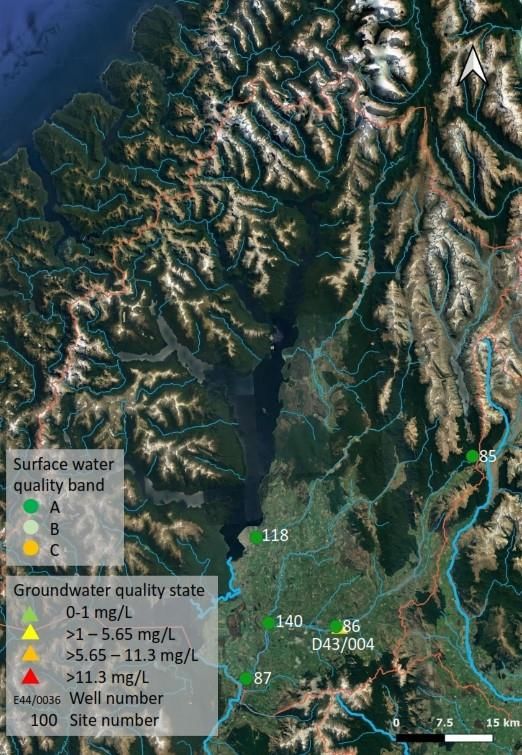
microbiological water quality will have been significantly better. This variability is caused by a wide
range of factors, particularly the amount, location, and timing of rainfall events and land use prior
to those rainfall events.
Figure 1 indicates that the recent very high value will have influenced the D grading while sampling
in earlier periods would almost certainly have scored a slightly better five year median result.

4.          River water quality - nitrate nitrogen (NO 3 -N, TON 3)

       •    Important nutrient for plant growth but too much can result in accelerated growth of plants
            in rivers & estuaries.
       •    Can also cause toxic effects on aquatic life.
       •    Simpler water quality indicators set to protect against toxicity effects – bands A & B are
            acceptable. However, a new stricter National Bottom Line established in September 2020
            means that C & D bands are not acceptable.

The data for the Te Anau area indicates relatively high quality surface water but with the possibility
that the lower Mararoa River has very slowly deteriorated over the past 20+ years. However, this
needs to be carefully considered in the context of longer term water quality. The following figure
illustrates sampling results for the river water quality monitoring sites in this area including sites in
the Mararoa River.

In addition to this overview picture, it is useful to look at one site where there is a long-term record
e.g., for the Mararoa River at The Key for the last 20 years.

Figure 3. Total oxidised nitrogen (TON) data for Mararoa River at The Key (LAWA website, ES
data)

3
    Nitrate nitrogen and total oxidised nitrogen (TON) are effectively equivalent.
                                                               4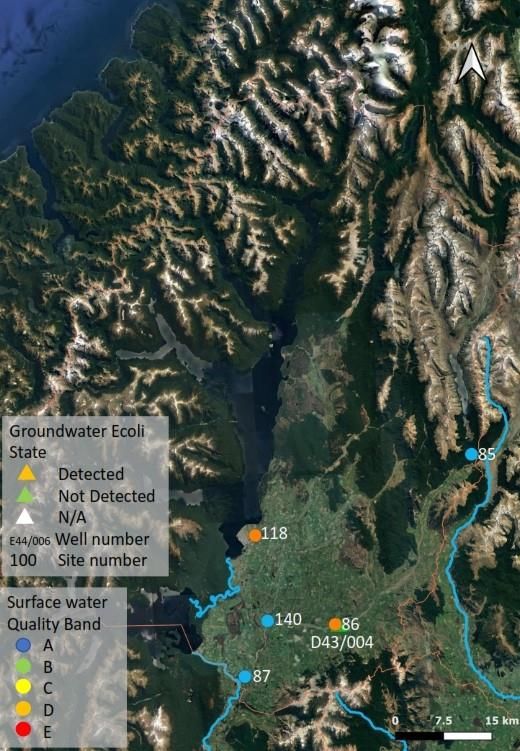
Figure 4. 20 year data for nitrate nitrogen for the Mararoa River at The Key (ES data)

The same data compared to the ‘A’ band threshold and the National Bottom Line.

Figure 5. 20 year data for nitrate nitrogen for Mararoa River at The Key compared to NPSFM A
band threshold and the National Bottom Line (ES data)

                                                5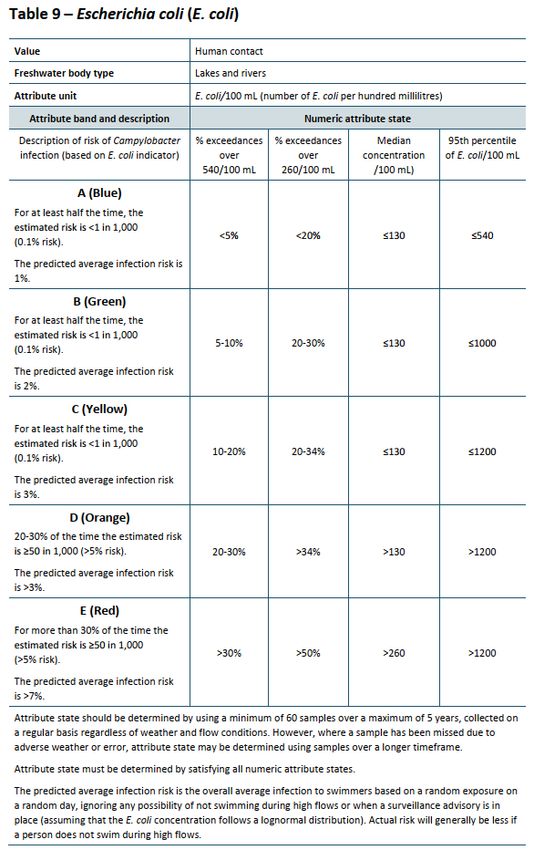
5.      Groundwater quality
There is only one long-term groundwater monitoring site in this area at site D43/004 a 13 metre
deep bore at The Key. Results from monitoring groundwater quality at this site are summarised in
the following figure. The recent five-year nitrate nitrogen median was 2.6 g NO3-N/m3 and
generally, microbiological testing has shown no E. coli. Modelled TON (nitrate nitrogen) for the wider
area is also illustrated in Figure 7.

Figure 6. Nitrate nitrogen and E. coli monitoring results for bore D43/0004 at The Key (LAWA website, ES
data)
                                                  6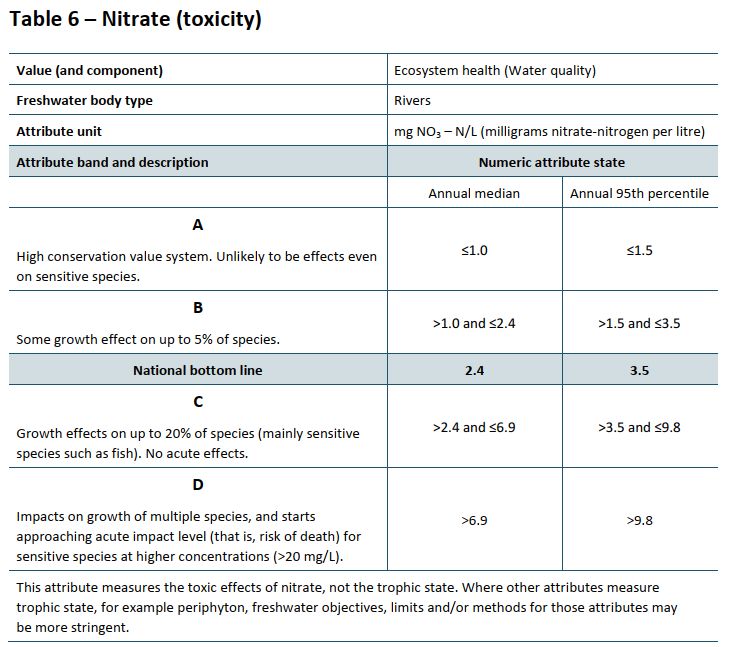
6.      Te WaeWae (Waiau) Lagoon
The focus of this report is on river and groundwater quality. However, it is useful to have an overview
understanding of the status of the state of water quality at the bottom of the Waiau River catchment,
because the achievement of water quality goals for a coastal lagoon or estuary can have an influence
on land use and management upstream in the catchment.

The Te Waewae Lagoon has been monitored monthly since 2016 and Environment Southland is
building up knowledge of the state and trends in the water quality and ecological status of the lagoon.
As at the end of 2019, important water quality indicators such as total phosphorus, total nitrogen and
secchi disc depth each have ‘C’ gradings indicating moderate adverse effects but unlikely to be
breaching any national bottom lines. The current status of the lagoon is summarised in Figure7.

This data strongly indicate that as part of Environment Southland’s future limit setting process there
are likely to be land use initiatives that would apply to land in the Te Anau Basin to assist in achieving
Te Waewae Lagoon water quality improvements.

                                                  7
Figure 7. Summary of water quality sampling for the Te Waewae (Waiau) Lagoon (LAWA website, ES data)
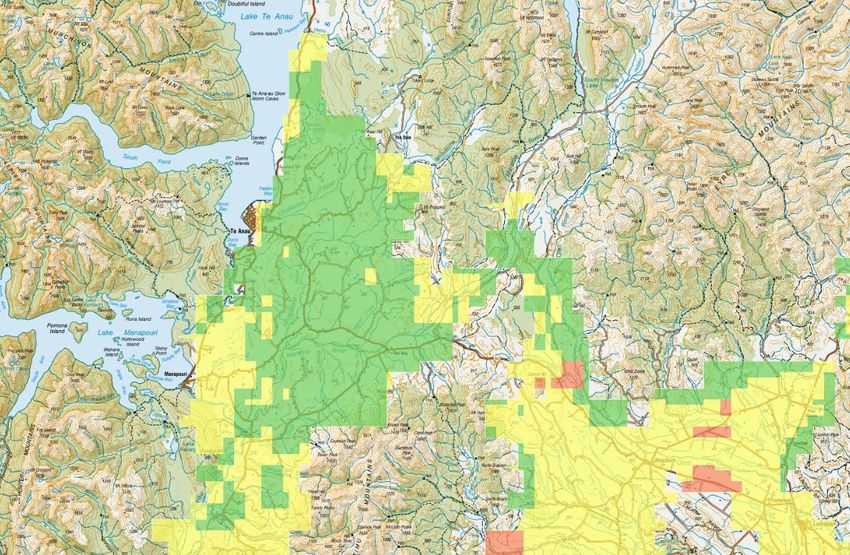
8Figure 7. Environment Southland modelled TON (nitrate nitrogen) in the wider Te Anau area (from Beacon website https://maps.es.govt.nz)
97. Conclusions
• The data summarised in this brief report indicate that shallow groundwater quality in the wider Te
Anau area is likely to have relatively low nitrate nitrogen concentrations compared to the NZ
drinking water standard (MAV) of 11.3 g NO3-N/m3. However, the shallow unconfined nature of
the groundwater means that it is vulnerable to contamination, particularly microbiological
contamination and therefore treatment would generally be appropriate if groundwater is to be
used as a source of drinking water.
• Microbiological river water quality is frequently poor and means that there is often a relatively high
risk of infection for water contact recreation. This is not unexpected for rivers that receive
significant amounts of surface runoff from agricultural land in Southland.
• Nitrate nitrogen concentrations in rivers in the area are relatively low compared to the NPSFM
bands and are unlikely to be having any adverse ecosystem toxicity effects. Nitrate nitrogen
concentrations in the rivers tested appear to be generally lower than in lowland rivers in other
parts of Southland.
• The water quality data indicates that some rivers have trends of increasing nitrate nitrogen
concentrations. However, the concentrations are relatively low and do not appear to indicate any
significant adverse effects are likely in the medium term.
• Nitrate nitrogen concentrations in rivers generally increase as a river moves through agricultural
areas and the Te Waewae (Waiau) Lagoon has relatively high concentration of total nitrogen and
total phosphorus. As a consequence it is likely that Environment Southland’s future limit setting
process will involve catchment land use management initiatives to improve the water quality of
the Te Waewae Lagoon.
• These conclusions support the catchment group initiatives to maintain and improve the relatively
good quality of rivers and groundwater in the Te Anau Basin area.
10Appendix A: Original data from literature review
A copy of the information in the original report is included below. However, note that LAWA data has been
updated.
Left: E. coli surface and groundwater monitoring sites current state
Right: TON (surface water) and NO3-N (groundwater) monitoring sites current state
Site key: Groundwater as labelled
Surface water ⃝ refer to Appendix B for site names
Surface Water Quality State and Trends
Summary of E. Coli state and trends in surface water
E. Coli State* Trend
Monitoring sites in catchment NOF 5-year 10-year 15-year
band
Mararoa River at South Mavora Lake A Not assessed Indeterminate Indeterminate
Indeterminat Very likely
Mararoa River at The Key D Likely improving
e improving
Indeterminat Very likely Very likely
Mararoa River at Weir Road A
e improving improving
Indeterminat Very likely
Upukerora River at Te Anau Milford Road D Indeterminate
e improving
Likely Very likely Very likely
Whitestone River d/s Manapouri-Hillside A
improving improving improving
* 2014-2018 LAWA median graded as per NPS-
FM 2020
11Summary of Total Oxidised Nitrogen (TON) state and trends in surface water
Total Oxidised Nitrogen (TON)^ State* Trend
Monitoring sites in catchment NOF band 5-year 10-year 15-year
Not
Mararoa River at South Mavora Lake A Not assessed Not assessed
assessed
Very likely Indeterminat
Mararoa River at The Key A Not assessed
degrading e
Likely Likely
Mararoa River at Weir Road A Not assessed
degrading degrading
Indeterminat
Upukerora River at Te Anau Milford Road A Indeterminate Not assessed
e
Likely Likely
Whitestone River d/s Manapouri-Hillside A Not assessed
improving degrading
^ Total Oxidized Nitrogen (TON) is the sum of nitrate and nitrite. Nitrite is generally a very small fraction of the TON
concentration in rivers, TON is taken to be equivalent to the nitrate concentration
* 2014-2018 LAWA median graded per NPS-FM 2020 using TON as surrogate for N03-N
Groundwater Quality State and Trends
Summary of E. Coli state and trends in groundwater
E. Coli Statistics NZ comparison to DWSNZ* or LAWA data
Monitoring sites in catchment Median (2014-18) Exceedance category^
D43/0004 Not detected 0%
* https://www.stats.govt.nz/indicators/groundwater-quality
^ Grades Stats NZ (2014-2018)
12Appendix B: Detailed NPSFM E. coli and nitrate nitrogen “attribute” definitions
1314
You can also read