The JPL Tropical Cyclone Information System: A Wealth of Data for Quickly Advancing the Physical Understanding and Forecasting of Hurricanes ...
←
→
Page content transcription
If your browser does not render page correctly, please read the page content below
The JPL Tropical Cyclone Information System:
            A Wealth of Data for Quickly Advancing the Physical Understanding and
                                                                 Forecasting of Hurricanes.
       Svetla Hristova-Veleva1, P. Peggy Li1, Brian Knosp1, Quoc Vu1, F. Joseph Turk1, William L. Poulsen1, Ziad Haddad1, Bjorn Lambrigtsen1, Bryan Stiles1,
       Tsae-Pyng Shen1, Noppasin Niamsuwan1, Simone Tanelli1, Ousmane Sy1, Hui Su1, Deborah G. Vane1, Yi Chao1, Philip S. Callahan1, R. Scott Dunbar1,
         Michael Montgomery2, Mark Boothe2, Vijay Tallapragada3, Samuel Trahan3, Anthony J. Wimmers4, Robert Holz4, Jeffrey Reid5, Frank Marks6,
          Tomislava Vukicevic6, Saiprasanth Bhalachandran7, Hua Leighton8, Sundararaman Gopalakrishnan6, Andres Navarro 9, Francisco J. Tapiador9

   1 – Jet Propulsion Laboratory, California Institute of Technology, Pasadena, CA     6 – Hurricane Research Division, AOML/NOAA
   2 - Naval Postgraduate School, Monterey, CA                                         7 – Purdue University
   3                                                                                   8
     – EMC/NCEP/NOAA, College Park, MD                                                   – Hurricane Research Division/AOML/NOAA/University of Miami, RSMAS
   4                                                                                   9
     – UW/Space Science and Engineering Center                                           – UCLM, Earth and Space Sciences Research Group
   5
     – Naval Research Laboratory, Monterey, CA

                                                                              July 9th, 2021

© 2021. California Institute of Technology. Government sponsorship acknowledged.                                                          Thanks to Robin Vane for video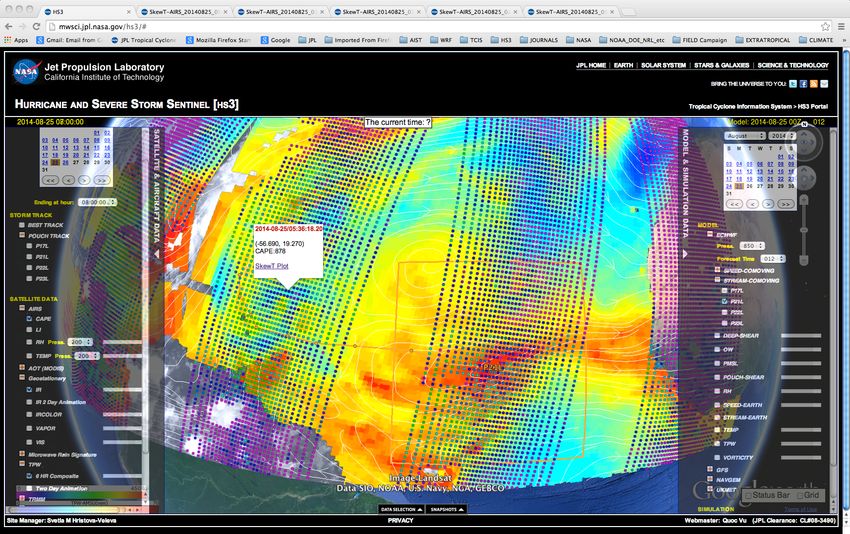
1. Motivation:
   The critical pathway to hurricane forecast improvement is to
   use observations and models together to:

 • Advance the still-lacking understanding of the governing processes

 • Evaluate and improve models through the use of satellite data

 • Develop advanced techniques for assimilating of satellite observations inside
  the hurricane core

 Despite the significant amount of satellite data today, they are still underutilized in
 hurricane research and operations, due to their volume and complexity (indirect and very
 nonlinear sensitivity to the most important underlying model variables).
To support the needs of the research and operational
communities, several NASA –funded efforts
resulted in the development of
the Tropical Cyclone Information System – a
hurricane-specific Data Analytic Center Framework
The TCIS components:
• Three interactive portals:                                                 https://tropicalcyclone.jpl.nasa.gov
    • the North Atlantic Hurricane Watch (NAHW -
      https://nahw.jpl.nasa.gov)
    • data portals to support field campaigns to study tropical convection
      • They serve as a very rich information source during the planning
        and particularly during the analysis stages of field campaigns
      • NASA’s 2017 Convective Processes Experiment (CPEX)
        https://cpex.jpl.nasa.gov)
      • NASA’s 2019 CAMP2Ex - https://camp2ex.jpl.nasa.gov
      • NASA’s 2021 CPEX-AW – https://cpex-aw.jpl.nasa.gov

• A 12-year-long (1999–2011) global data archive (TCDA) of satellite
  observations of tropical cyclones (non-interactive).
    • a one-stop place to obtain an extensive set of multi-parameter data
      from multiple observing systems.
    • offers both digital data and imagery, subset to the domain and time
      of interest, thus greatly reducing the volume of unwanted data.
    • This makes TCDA a valuable source to quickly build statistics in
      support of research, forecast improvement and algorithm
      development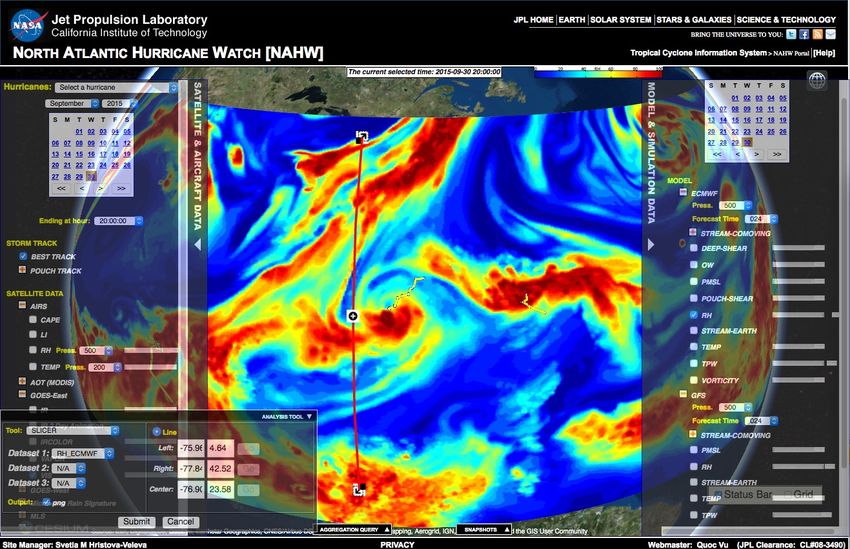
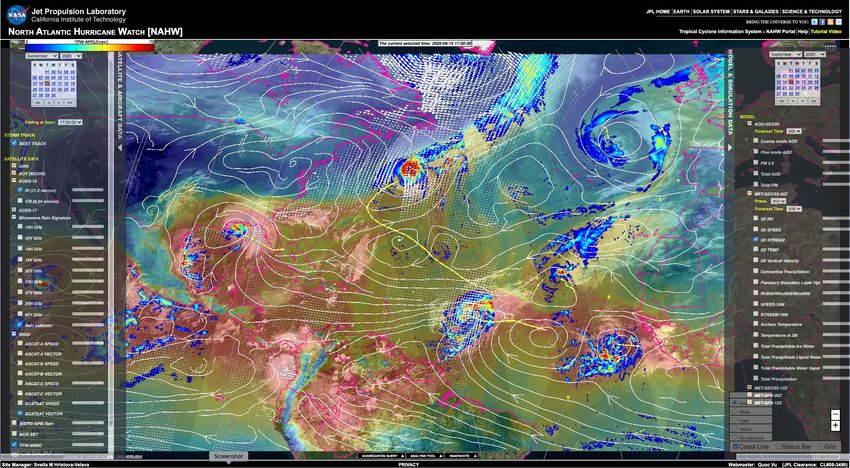
To support the needs of the
JPL TCIS - Interactive Visualization of multiparameter observations and models
                                                                                                  research and operational
                                                       New: Tutorial videovideo
                                                                Tutorial                          communities, several NASA-
                                                                                                  funded efforts resulted in the
            Date / Time
                                                                                                  development of the JPL Tropical
            Observations                                                                 Models   Cyclone Information System – a
             Selection
                                                                                                  Data Analytic Center Framework
                                                                                                  that:
                                        Paulette
                                                                                                  - ingests and processes dozens
                                                                                Invest 99L
                                                                                                      of data streams
                           Sally                                                                  - combines model forecasts
                                   Best Tracks                                                        with satellite and airborne
                                                                                                      observations, bringing them
                                                                            Vicky                     all within a common system.
                                                            Teddy
                                                                                Invest 98L
                                                                                                                         This system
                                                                                                      -   provides interactive
                                                                                                          visualization
                                                                  oo
                                                                       ls                             -   supports some on-line
                                                                sT
                                                         al ysi                                           analysis tools that can be
                                                   A   n
                                                                                                          used with both
                                                                                                          observations and
                                                                                                          models.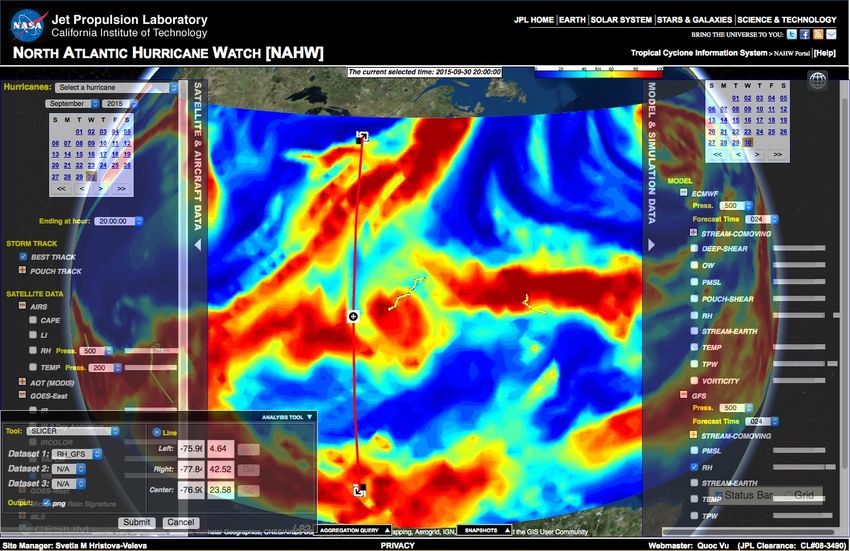
To support the needs of the
JPL TCIS - Interactive Visualization of multiparameter observations and models
                                                                                                          research and operational
                                                               New: Tutorial videovideo
                                                                        Tutorial                          communities, several NASA-
                                                                                                          funded efforts resulted in the
               Date / Time
                                                                                                          development of the JPL Tropical
               Observations                                                                      Models   Cyclone Information System – a
                Selection
                                                                                                          Data Analytic Center Framework
                                                                                                          that:
                                                Paulette
                                                                                                          - ingests and processes dozens
                                                                                        Invest 99L
                                                                                                              of data streams
                              Sally                                                                       - combines model forecasts
                                          Best Tracks                                                         with satellite and airborne
                                                                                                              observations, bringing them
                                                                                    Vicky                     all within a common system.
                                                                    Teddy
                                                                                        Invest 98L
                                                                                                                                 This system
                                                                                                              -   provides interactive
                                                                                                                  visualization
                                                                          oo
                                                                               ls                             -   supports some on-line
                                                                        sT
                                                                 al ysi                                           analysis tools that can be
                                                           A   n
                                                                                                                  used with both
                                                                                                                  observations and
The goal of the JPL TCIS data analytic framework is to help scientist:                                            models.
1. gain intuition in the complex multi-scale interactions that lead to the evolution
  of tropical convection in general and hurricane processes, in particular
2. To support airborne flight campaigns: planning, in-air flight operations
3. To provide a common system for post-event exploratory analysis
4. To provide the data (satellite and model) that are included in the TCIS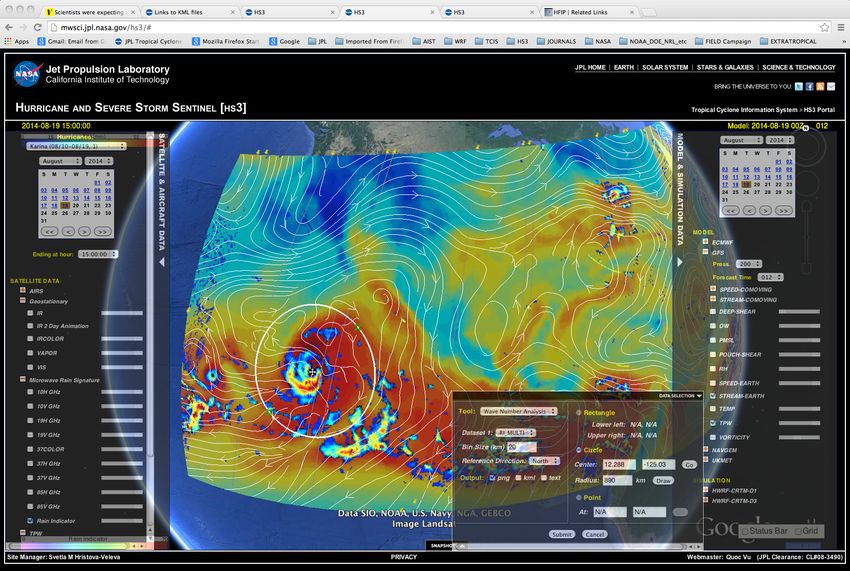
To support the needs of the
JPL TCIS - Interactive Visualization of multiparameter observations and models
                                                                                                          research and operational
                                                               New: Tutorial videovideo
                                                                        Tutorial                          communities, several NASA-
                                                                                                          funded efforts resulted in the
               Date / Time
                                                                                                          development of the JPL Tropical
               Observations                                                                      Models   Cyclone Information System – a
                Selection
                                                                                                          Data Analytic Center Framework
                                                                                                          that:
                                                Paulette
                                                                                                          - ingests and processes dozens
                                                                                        Invest 99L
                                                                                                              of data streams
                              Sally                                                                       - combines model forecasts
                                          Best Tracks                                                         with satellite and airborne
                                                                                                              observations, bringing them
                                                                                    Vicky                     all within a common system.
                                                                    Teddy
                                                                                        Invest 98L
                                                                                                                                 This system
                                                                                                              -   provides interactive
                                                                                                                  visualization
                                                                          oo
                                                                               ls                             -   supports some on-line
                                                                        sT
                                                                 al ysi                                           analysis tools that can be
                                                           A   n
                                                                                                                  used with both
                                                                                                                  observations and
The goal of the JPL TCIS data analytic framework is to help scientist:                                            models.
1. gain intuition in the complex multi-scale interactions that lead to the evolution                          The JPL TCIS is described
  of tropical convection in general and hurricane processes, in particular                                    in the March 2021 issue
2. To support airborne flight campaigns: planning, in-air flight operations
3. To provide a common system for post-event exploratory analysis
                                                                                                              of BAMS and featured on
4. To provide the data (satellite and model) that are included in the TCIS                                    the Cover.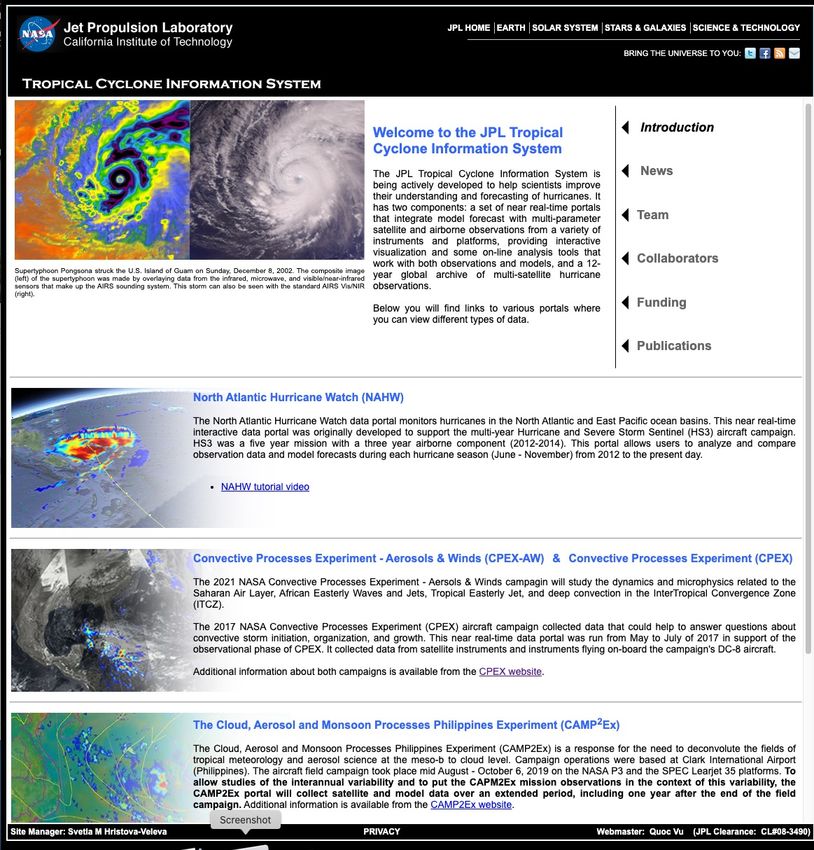
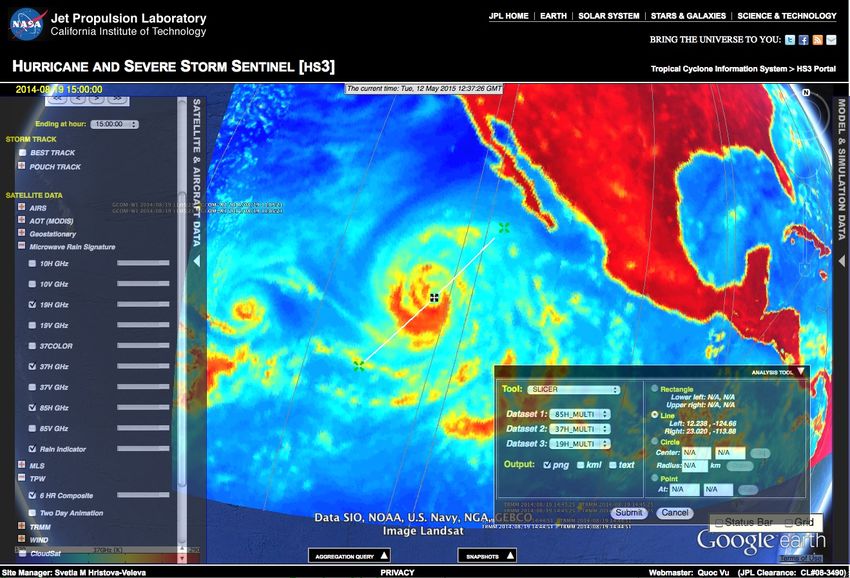
2. Features
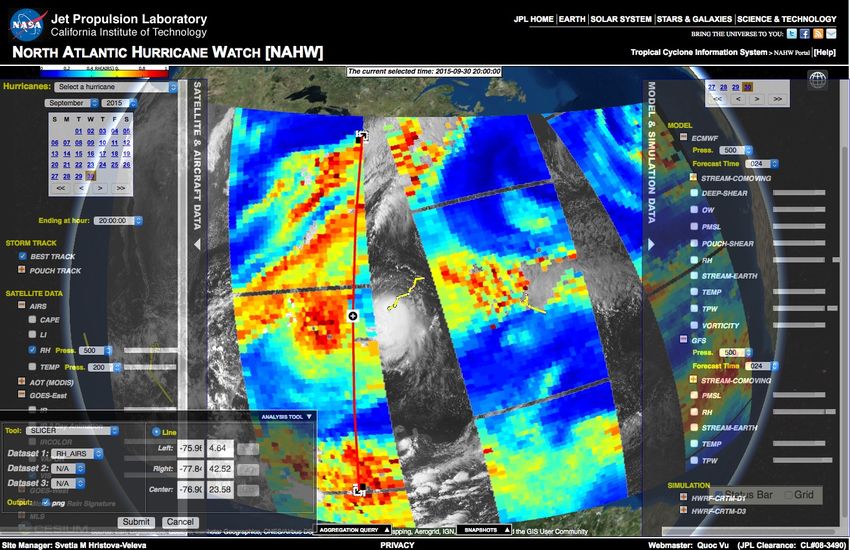
3. Analysis Tools

Looking at the storm structure
The “Slicer” – analysis of the Storm
Statistical Tool: Joint Distribution of Brightness Temperatures
Example: The Joint PDF of 37GHz and 85GHz TBs; Humberto
                             •    The statistical relationship between
                                  the 37 GHz TBs and the 85 GHz TB
                                  presents information on the vertical
                                  structure of the storm
                             •    The vertical branch indicates too much
                                  scattering of radiation by the frozen
                                  precipitation
                             •    Question: Is the ice too much or is its
                                  forward modeling inaccurate?
                                    • Need to consider the resolution!

                               60h forecast              36h forecast
   Observations          At model resolution       At model resolution
TOOLS: The JPL Tropical Cyclone Information System and
The North Atlantic Hurricane Watch
Wave Number Analysis (WNA)
(online)
WNA can be used to evaluate
three important quantities:
• the degree of storm
symmetry
• the precipitation intensity
• the radial distribution of
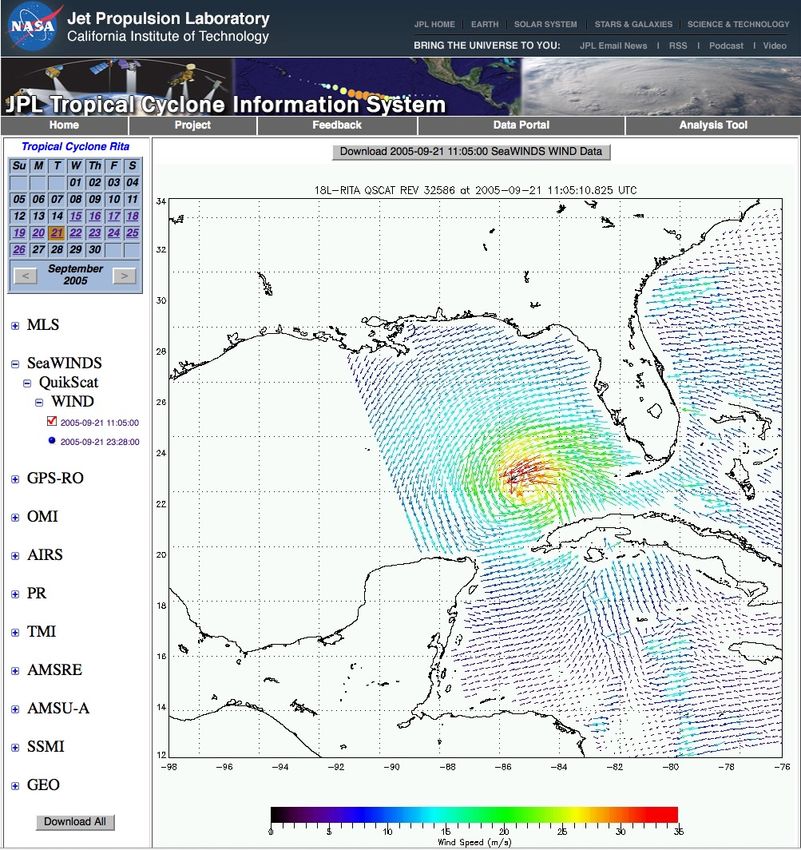
precipitation/windQuestions regarding hurricane evolution: Possible predictors for the Rapid Intensification and
evolution of hurricanes from satellite observations of
What is the role of the azimuthally symmetric, weak convection?
precipitation and surface winds
What is the role of the isolated, intense convection?
Svetla Hristova-Veleva Z. Haddad, B. Stiles, T.-P. Shen, N. Niamsuwan, F. J. Turk, P. P. Li,
What is the importance of the radial distribution of convection? B. Knosp, Q. Vu, B. Lambrigtsen, W. Poulsen
Can we use satellite observations to understand these roles? – It
seems so …J
The JPL Tropical Cyclone Information System and
The North Atlantic Hurricane Watch
Significant Precipitation inside
RMW. Asymmetric.
Will intensify? – Yes, indeed!
Joaquin – went through
a very strong RI
Very asymmetric and intense
away from the center (outside
RMW). Will decrease? – Yes!
Wave Number Analysis
(online)3. Analysis Tools Analyzing the moisture in the environment
(https://nahw.jpl.nasa.gov/ )
Evaluation of the Environment

                                  Signatures of
        The moist layer           subsidence
        is not very deep

                           Deep moist
                           layer
Line for the vertical cross-section
shown three slides later
GFS; 2015-09-30; 24h forecast;
Relative Humidity at 500 mbLine for the vertical cross-section
shown two slides later
ECMWF; 2015-09-30; 24h forecast;
Relative Humidity at 500 mbLine for the vertical cross-section
shown on the next slide
AIRS; 2015-09-30; 20Z;
Relative Humidity at 500 mbNorth Cross-section Along 77W South
AIRS
Is GFS too moist
at upper levels
ahead of the
storm??
GFS
Both models seem
to have deep layers
of moisture that are
not seen in the AIRS
observations.
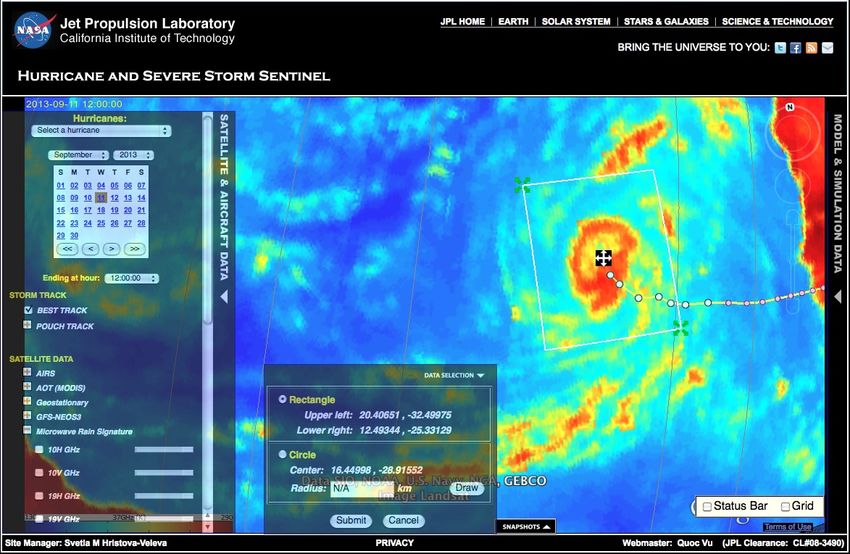
ECMWF4. TC Data Archive
- Satellite depictions
  of hurricanes over
                         http://tropicalcyclone.jpl.nasa.gov
  the globe
- 12-year record
  (1999-2010)
- Offers both data
  and imagery,                                                 Timeline
  making it a unique
  source to support
  hurricane research.                                          View and
                                                               download
  Earl, 2010                                                   Storm-scale
  Download                                                     data
  all data from
  this
  Instrument
                                                               Download
  (TMI)
                                                               Selected
                                                               large-scale
                                                               data from
                                                               this day
At this time
Download
NetCDF
All data on
this dayAsymmetry and Evolution
Statistics from observations ; North Atlantic Hurricanes
Parameter as a function of:
- Quadrant with respect to storm motion
Created composites following
similar approaches:
Lonfat, M., F.D. Marks, and S.S.Chen, 2004:
"Precipitation Distribution in Tropical Cyclones using
the Tropical Rainfall Measuring Mission (TRMM)
microwave imager : A Global Perspective" MWR 132(7)
Q4; Front Left Direction of Storm Motion
Q1; Front Right Rogers et al., 2012 : "Multiscale analysis of mature
tropical cyclone structure from airborne Doppler
composites," MWR, 140 (1)
Wu, L, H. Su, R. G. Fovell, B. Wang, J. T. Shen, B. H.
Kahn, S. M. Hristova-Veleva, B. H. Lambrigtsen, E. J.
Fetzer, J. H. Jiang, 2012: “Relationship of
Environmental Relative Humidity with Tropical Cyclone
Intensity and Intensification Rate over North Atlantic”,
Q3; Back Left Q2; Back Right Geophys. Res. Lett., 39, L20809,
doi:10.1029/2012GL053546.
Many others.Asymmetry and Evolution
Statistics from observations ; North Atlantic Hurricanes
Parameter as a function of:
- Quadrant with respect to storm motion
- distance from storm center (y-axis)
- days from maximum intensity (x-axis)
Q4; Front Left Direction of Storm Motion
Q1; Front Right
Distance from
storm center
Evolution:
-3 to +3 days
from Max Intensity
Q3; Back Left Q2; Back Right
09-year statistics from AMSR-E observations
North Atlantic Hurricanes; 2002-2011
Cat 1-3; Front Left Cat 1-3; Front Right Evolution of asymmetry
Azimuthal/Range Distributions
Direction of Storm Motion of Rain Index
Cat1: 31 cases
Cat 1-3; Back Left Cat 1-3; Back Right Cat2: 9 cases
Cat3: 12 cases
Total Cat1-3 = 52 cases
Cat4: 18 cases
Cat5: 7 cases
Total Cat4-5 = 25 cases
Cat 4-5; Front Left Cat 4-5; Front Right
Day of Maximum
Intensity
Cat 4-5; Back Left Cat 4-5; Back Right9-year statistics from AMSR-E observations
North Atlantic Hurricanes; 2002-2011
Cat 1-3; Front Left Cat 1-3; Front Right Evolution of asymmetry
Azimuthal/Range Distributions
Direction of Storm Motion of Rain Index
Cat1: 31 cases
Cat 1-3; Back Left Cat 1-3; Back Right Cat2: 9 cases
Cat3: 12 cases
Total Cat1-3 = 52 cases
Cat4: 18 cases
Cat5: 7 cases
Total Cat4-5 = 25 cases
Cat 1-3 have rain fields that are larger, Cat 4-5; Front Left Cat 4-5; Front Right
weaker and less symmetric in:
- Space
- More intense precipitation is in
the front 2 quadrants
- Time Cat 4-5; Back Left Cat 4-5; Back Right
- Tendency for radial expansion of
precipitation after the peak of the
storm. Only in the front 2
quadrants.
- Increase in asymmetryThank you!
You can also read