BCCDC Data Summary 2 September 2021
←
→
Page content transcription
If your browser does not render page correctly, please read the page content below
BCCDC Data Summary
    2 September 2021

                       1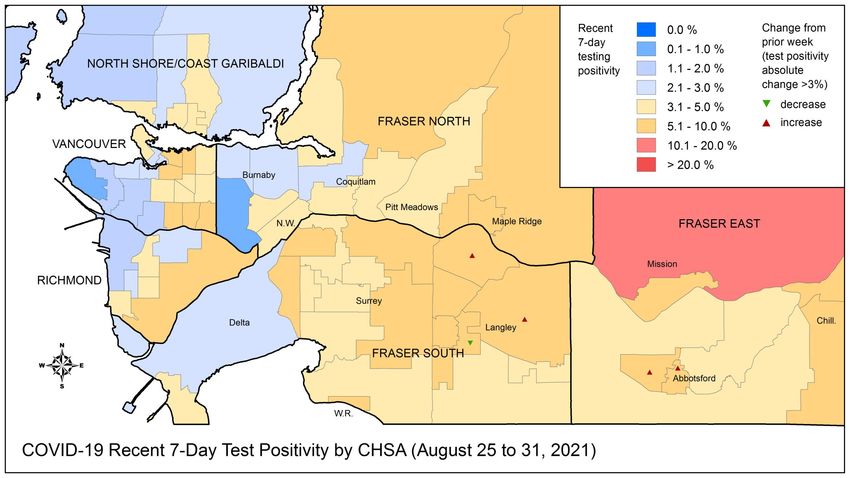
Purpose
The surveillance deck is a summary of COVID-19 related indicators that can help inform the pandemic
response in British Columbia. This surveillance monitoring constitutes the medical chart for population
health assessment that guides the public health community of practice. As such this is a working
document that reflects a snapshot in time and may differ from other published reports.
Data Sources
The collection, use and disclosure of case data is subject to the Public Health Act. COVID-19 cases are
reported under the Public Health Act to the health authority of residence. Public health case
notification, clinical management, contact tracing and follow-up contributes surveillance data for
regional and provincial COVID-19 monitoring. Each regional health authority have their own workflows
and information systems for capture of relevant data. This data foremost serves the public health and
clinical management of the case and their contacts.
Disclaimer
• Data and key messages within these documents are not finalized and considered to be work in
  progress that is subject to retroactive changes as more data and information become available.
• Accurate interpretation of figures may be difficult with the limited inclusion of data notes and
  methodology descriptions in this document.
                                                                                                   2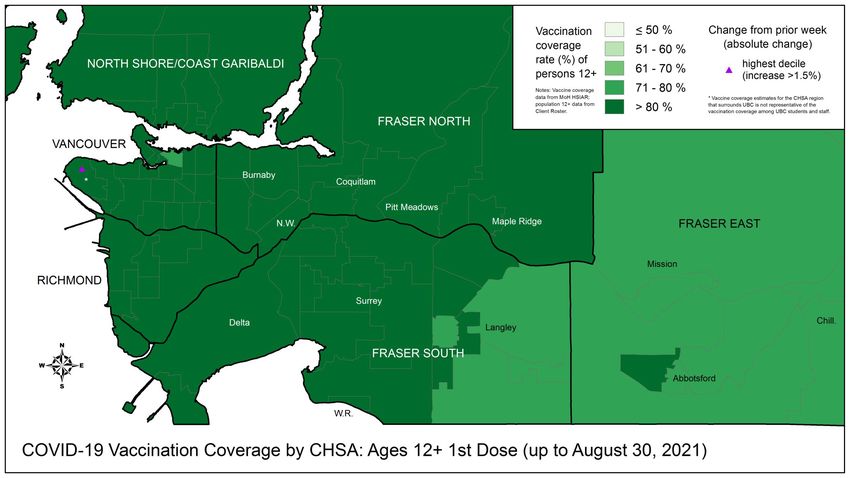
Table of Contents
 Overall Summary ……….…………………………………………………………………………………………………………………………4

 Surveillance ………………………………………………………………………………………………………………………………………….5

       BC Epidemiology………………………………………………………………………………………………………………….….5

       Outcomes by vaccine status……………………………………………………………………………………………………16

       Vaccinations…………………………………………………………………………………………………………………………..26

       Labs/Genomics…………………………………………………………………………………………….……………………….35

 Modelling…………………………………………………………………………………………………………………………………..…………44

 Additional Resources………………….……..………………………………………………………………………………………………….45
Overall Summary for surveillance data up to 31 Aug
• Case rates are increasing in Northern, Fraser and Island Health, incidence in Interior remains elevated,
  but rate is stable; test positivity for public tests has been stable at ≈ 9% provincially, and is highest in
  IH (16%) and NH (22%).
• New hospitalizations are increasing provincially but declining in Interior; hospital/critical care census
  is increasing throughout BC; new deaths are low. Hospitalization rates among children continue to
  remain very low.
• Based on last week’s data, compared with fully vaccinated individuals and after adjusting for age
  differences, unvaccinated individuals are
    • ≈ 11x more likely to become a case
    • ≈ 31x more likely to be hospitalized
    • ≈ 4x more likely to die
• Vaccine coverage in BC, 31 Aug, 1 dose (2 doses): 75% (68%) of total population, 84% (77%) of 12+
  eligible population. Lower vaccine coverage in Interior and Northern and among younger individuals.
• Variants of concern (VOCs) continue to account for ≈ 100% of all positive tests in BC. Delta is the
  dominant VOC (99.5%) across all of BC.
Aug 26 to Aug 31: BC COVID-19 Profile
  166,853 total cases           1,818   total deaths
    4,884 new this week           16    new this week

    8,725 ever hospitalized   158,900   removed from isolation
     225 new this week          4,231   new this week

                                                                 4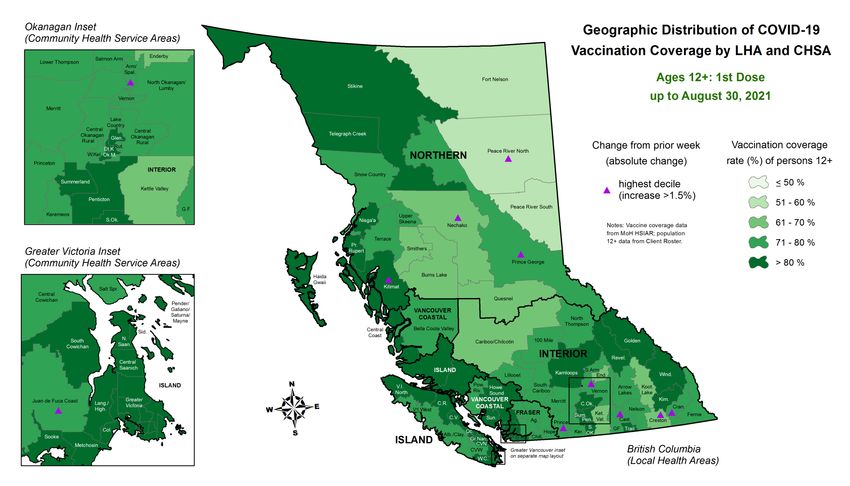
Case rates are increasing in Northern, Fraser and Island regions and stabilizing in Interior and Vancouver
Coastal; new hospitalizations are declining in Interior, increasing provincially; new deaths are stable and low.

                                                                              For latest version of a graph similar to this one (difference:
                                                                              hospital census, not new hospitalizations), see the Epi App

                                                                                                                                    6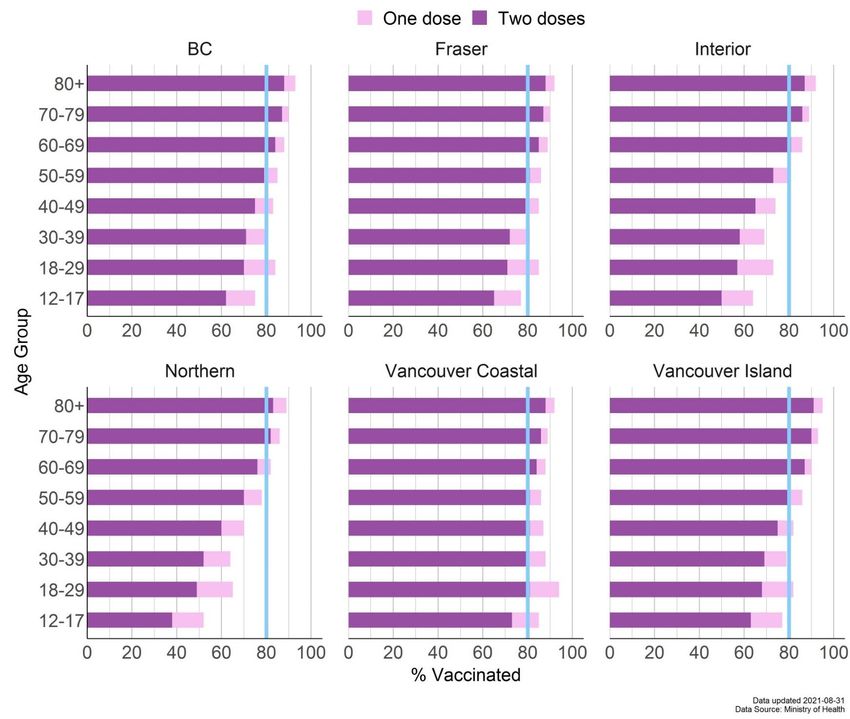
Case counts have increased in all health authorities, with the largest increases in Interior and
Fraser
                                   New daily COVID-19 cases by HA, Jan 01 2021 - Aug 31 2021

                *Data based on surveillance date (i.e. lab result date, or when not available, date reported to public health)   7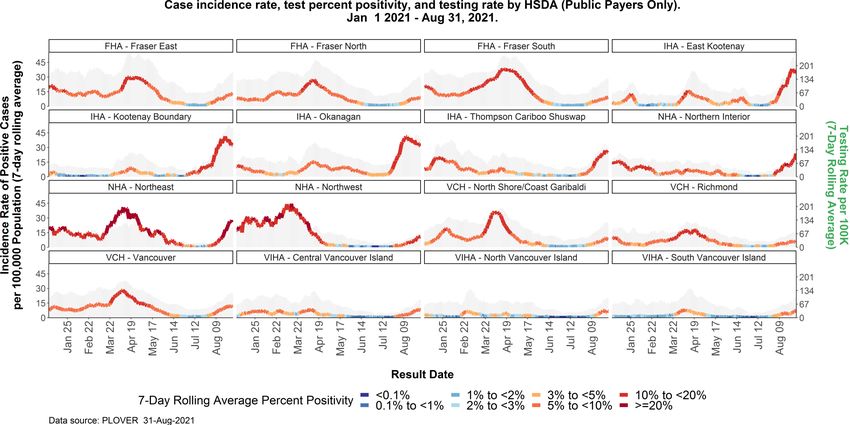
Case counts are highest among 19-39 year olds, consistent with previous resurgences
                           New daily COVID-19 cases by Age, Jan 2021 - Aug 31 2021

                                                                                      8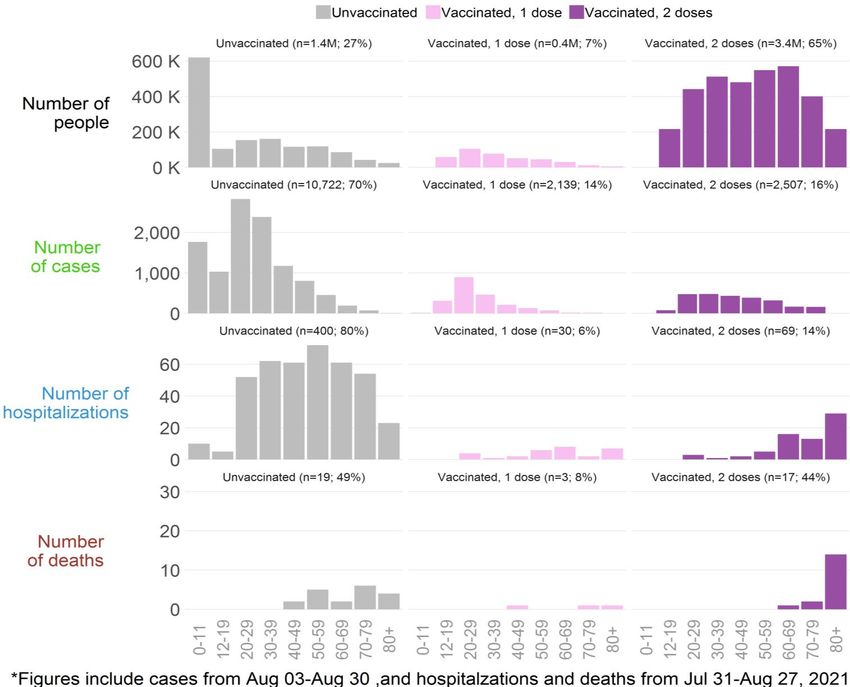
Hospital and critical care census is high and increasing in Interior, and trending upwards in
other parts of BC

                                                                                                9
Number of new hospital admissions is increasing across all ages >20 years, almost all are
among unvaccinated individuals (see slide 23). Deaths are low.

                                                                                            10
Trends in number and rate of new hospitalizations by age group, BC, 1 Jan – 28 August 2021
Hospitalization counts and rates
among children (0-19 years)
continue to remain very low
11
*Data based on admission date for hospitalizationsFor latest version of this map (note: change symbols not 12 included), see COVID-19 Regional Surveillance Dashboard
For latest version of this map, (note: change symbols not   13
included), see COVID-19 Regional Surveillance Dashboard
For latest version of this graph, see COVID-   14
19 Regional Surveillance Dashboard
For latest version of this graph, see COVID-   15
19 Regional Surveillance Dashboard
Key messages – COVID-19 outcomes by vaccine status
• Most of the recent cases and hospitalizations continue to be among unvaccinated individuals
• Based on last week’s data, compared with fully vaccinated individuals, unvaccinated individuals are
    • ≈ 8x more likely to become a case (≈ 11x after adjusting for age differences)
    • ≈ 18x more likely to be hospitalized (≈ 31x after adjusting for age differences)
    • ≈ 4x more likely to die, taking into account age differences

• Hospitalization rates among children continue to remain very low

• Unvaccinated: no dose or
Over the past week, fully vaccinated individuals accounted for 20% of cases, 13% of
hospitalizations, and 65% of BC’s total population
These % fluctuate over time. There are many more vaccinated individuals than unvaccinated individuals, and
thus it is important to take the denominator into account. These figures do not represent vaccine effectiveness.
Aug 30 Aug 24-30 Aug 21-27
6% 7% 6%
30% 12% 22%
64% 80% 72%
We operate in a live database environment and data get updated retrospectively. These figures were run on Tuesday Aug 31 st and may differ slightly from previously reported counts. Vaccinations
represent vaccination coverage as of the last date (Aug 30 th). Cases are captured based on surveillance date. Hospitalizations are by admission date. Please note that there is often a multiple-days
lag in recording hospitalizations, e.g. some hospital admissions that occurred on Aug 24 th may not be captured by our surveillance system until Aug 29th.
17Over the past month, fully vaccinated individuals accounted for 16% of cases and 14% of
hospitalizations
These % are expected to increase over time as more people get fully vaccinated and there are fewer unvaccinated
people. If 100% of population is fully vaccinated (which is almost the case for many long term care residents for
example), then any new cases, hospitalizations, or deaths will necessarily be among vaccinated people.
Deaths continue to occur
6%
primarily among older
individuals (see next slide),
>90% of whom are
vaccinated, which explains
the higher relative % of
deaths among the fully
vaccinated.
67%
We operate in a live database environment and data get updated retrospectively. These figures were run on Tuesday Aug 31 st and thus will differ slightly from previously reported counts. Cases are
captured based on surveillance date. Hospitalizations are by admission date. Deaths are by date of death. Please note that there is often a multiple-days lag in recording hospitalizations and
deaths, e.g. some hospital admissions that occurred on Aug 24 th may not be captured in our surveillance system until Aug 29th.
18COVID-19 health outcomes by vaccination status and age, BC, July 31 – August 30, 2021
COVID-19 case rate by
vaccination status and
Health Authority,
July 1 – Aug 30, 2021

In the past week, case rate
among the unvaccinated
individuals was ≈8x higher
than case rate among fully
vaccinated individuals – but
note that this is crude and
not adjusted for age (see
slides 21, 24).

Denominators for each vaccine status
group are dynamic and change daily
as people flow from being
unvaccinated to protected by 1 dose
to protected by 2 doses. Therefore,
the denominators are different across
groups and over time.

                                        20
COVID-19 case rate by
vaccination status and
age, July 1 – August 30,
2021
Denominators for each vaccine status
group are dynamic and change daily
as people flow from being
unvaccinated to protected by 1 dose
to protected by 2 doses. Therefore,
the denominators are different across
groups and over time.
21COVID-19 hospitalization
rate by vaccination status,
July 1 – Aug 26, 2021
In the past week,
hospitalization rate among
unvaccinated individuals was
≈ 18x higher compared with
fully vaccinated individuals –
but note that this is crude
and not adjusted for age
(see slide 14).
Data by hospital admission date.
Denominators for each vaccine status
group are dynamic and change daily
as people flow from being
unvaccinated to protected by 1 dose
to protected by 2 doses. Therefore,
the denominators are different across
groups and over time.
22COVID-19
hospitalization rate by
vaccination status and
age, July 1 – Aug 26,
2021
Given relatively low
numbers, please
interpret these
results with caution.
Trends tend to be
unstable with lower
counts.
Denominators for each vaccine
status group are dynamic and
change daily as people flow
from being unvaccinated to
protected by 1 dose to protected
by 2 doses. Therefore, the
denominators are different
across groups and over time.
23After taking age differences into account, unvaccinated individuals are much more
likely get infected, be hospitalized, or die from COVID-19
Relative rates fluctuate over time (see graph to the right). These figures do not represent vaccine effectiveness.
11x
31x
4x
24Vaccination progress in BC over time by age group and dose number up to 31 August
25Vaccination progress in BC
and by Health Authority as of
August 31, by age group and
dose number
Blue lines at 80% are for visual reference only for easier navigation across panels
26BC communities
with higher
vaccination rates
generally had
lower total
number of cases
per capita Note the general absence
of dots in this quadrant –
between July 1 very few communities with
high vaccination rates also
and Aug 30 have high case rates
27For latest version of this map, see COVID-19 28 Regional Surveillance Dashboard
For latest version of this map, see COVID-19   29
Regional Surveillance Dashboard
COVID-19 vaccination coverage with 1st dose among 12-17 year olds, by Local Health Area,
up to August 30, 2021: there is more variation in this age group compared with older age groups

                                                           For latest version of this graph, see COVID-   30
                                                           19 Regional Surveillance Dashboard
Nationally, BC’s vaccination rate is very close to the Canadian average; internationally, Canada
is one of the countries with the highest proportion of the population with at least one dose.
Data source: Open Data Data source: Our World in Data
Visualization: BCCDC Visualization: BCCDC
For latest vaccination progress statistics in BC, 31
Canada and internationally, see the Epi AppVaccination rates with at least 1 dose, Canada and US, August 26, 2021
Canada 72%
US 61%
Source: Dr. Trevor Tombe
32In recent months, BC’s case
rate has been similar to AB
and SK rates, but hospital
census has been lower
For most up to date figures, and to make your
own comparisons, please go to the Epi App
33Growth rate of cases in the UK
and US has slowed down;
Israel case rate is declining. In
Europe, situation is variable,
with case rate declining in
some countries (e.g. Spain,
France), but increasing in
others (e.g. Norway, Germany).
Over the past two months,
BC’s case rate has been
similar to Germany’s and
lower than US, UK and Israel.
For most up to date figures, and to make your
own comparisons, please go to the Epi App
34Lab - Key Messages
• Percent positivity among publicly funded tests is stable at ≈ 9%
• Test positivity varies by HA, ranging from 6.8% in VIHA to 21.9% in NH.
• Case incidence rate remains highest among 19-29 years, but rate is levelling; % positivity >10% among 5
to 29 years.
• Testing rates continue to increase this week
• The provincial weekly median turnaround time (time from specimen collection to
lab result) remains low, at 14 hours indicating good testing capacity; 1 in 4 tests
took > 22 hours to result.
• Delta is the most prevalent COVID-19 variant in BC representing 99.5% of all
sequenced specimens in most recent week.Weekly Summary of ALL lab tests performed
3,414,547 total specimens tested
8% relative to last week
86,735 new this epi week
173,386 total positive specimens 5.5% positivity
0.3% absolute change from
4,795 new positive this epi week
last week
16 hr mean turnaround time (TAT)
10% TAT relative to last
14 [9-22] Median [Q1 – Q3] TAT week
Weekly Summary of Lab tests paid Publicly
2,597,748 total specimens tested
17% relative to last week
52,874 new this epi week
171,336 total positive specimens 8.9% positivity 36
0.2% absolute change from
4,678 new positive this epi week
last week
Data source: PLOVER extract at 10:30am on September 1, 2021.
Epi week 34 (Aug 22 - 28)For latest version of this map, see the new (note: change 37 symbols not included) COVID-19 Surveillance Dashboard
Includes all tests

For latest version of this map, see the new (note: change          38
symbols not included) COVID-19 Surveillance Dashboard
Among publicly funded tests: percent positivity is stable at ~9%, and testing rates have
continued to increase (+17%).

                                                                                           39
Overall incidence rate has increased, with positivity being highest in Northern (22%) and Interior (16%)
16%
9.1% 7.0%
7.6%
22% 6.8%
For latest version of a graph similar to this one 40
(difference: all tests, not public tests), see the Epi AppIncidence and test positivity are high across Interior and Northern HSDAs, with many showing
increasing trends.
For latest version of a graph similar to this one 41
(difference: all tests, not public tests), see the Epi AppCase incidence rate remains highest among 19-29 years, but rate is levelling; % positivity >10%
among 5 to 29 years.
42Among sequenced VOC samples provincially based on information for August 22 to 28, the
dominant VOC continues to be Delta 99%
Alpha (%) ≈ 0%
Delta (%) ≈ 99%
Gamma (%) ≈ 1%
43Dynamic modeling: recent trends Modelling indicates that overall Rt is near 1, but trends differ by region. Estimates are shown for last week → this week, with 90% range of possible values given next to most recent estimate.
Additional Resources
• BCCDC COVID-19 Regional Surveillance Dashboard showing maps, vertical plots, and trends by LHA
  can be found here

• More BC COVID-19 data, including the latest Situation Report, maps, and BC COVID-19 public
  dashboard, can be found here

• For more information on variants of concern and whole genome sequencing, the latest report is
  posted here

• To put BC provincial, Health Authority, and HSDA trajectories into national and international
  context, see BCCDC COVID-19 Epidemiology app

• COVID SPEAK 2020 Round 1 Survey results

• Slides for previous public and modelling briefings by Dr. Bonnie Henry can be found here

• PHAC’s COVID-19 Epidemiology update can be found here
You can also read