Data - Does it help or hinder? - Dr John Robson RNZCGP Quality Symposium July 2017
←
→
Page content transcription
If your browser does not render page correctly, please read the page content below

Data – Does it help or hinder?

                                  Dr John Robson
                        RNZCGP Quality Symposium
                                         July 2017
Summary
• Data is important to improvement processes
• Defining the aim and what you want to
  measure is key before you start your Plan – Do
  – Study – Act cycle
• Understand variation


Reflections

• How did this make you feel?
Why Deming?
[QI] aims to improve patient experience and outcomes by
taking a systematic approach that uses specific techniques
to improve quality. These approaches are often known as
‘organisational’ and ‘industrial’ methods, as their origins
are in the manufacturing industries. The approaches help
organisations to analyse performance and make
systematic changes in order to improve quality.
                                                             The Health Foundation. Quality improvement.
                    http://www.health.org.uk/areas-of-work/topics/quality-improvement/quality-improvement
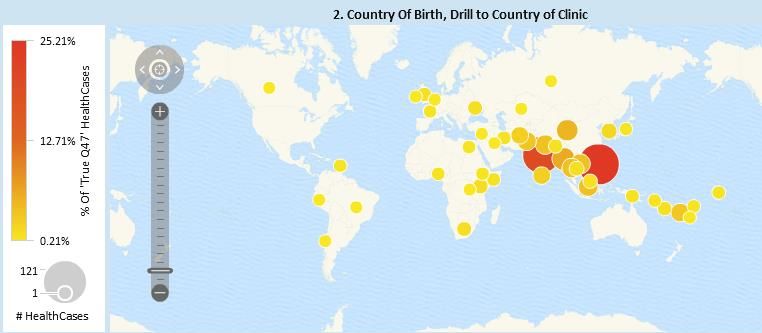
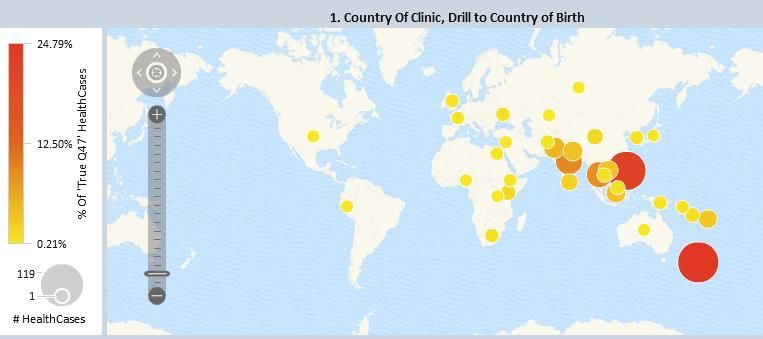
Immigration and Data
Australia’s Department of
                                                       Immigration and Border
Begin preparing an INZ visa application                                                       eMedical Case
                                                          Protection (DIBP)
                                                                                              Attachments
Health information is required (120,000)                                                      e.g. X-ray images

  Client finds             PP submits
                                                                                              eMedical Case Data
   INZ Panel                 IME via
                                                                                              e.g. Client identity data
   Physician                eMedical
                                                                                              and examination
      (PP)                                                                                    results

                                                                                    Business to
                                                                                  Business Gateway
                                                                                       (B2B)

                                           [Commercial In Confidence]
eMedical
health Manual Intervention and Assessment by
case Health Assessment Team (HAT)
received
Medical
Assessors
Automatic
Assessment
~80% of health
cases expected
to be considered
Acceptable
Standard of
Health (ASH)
ASH ASH With Conditions Not ASH
Health Status Assessment Outcome
INZ staff member (internal user)
Staff involved in assessing the
corresponding INZ visa
application will be able to access
the health case outcome and
related information
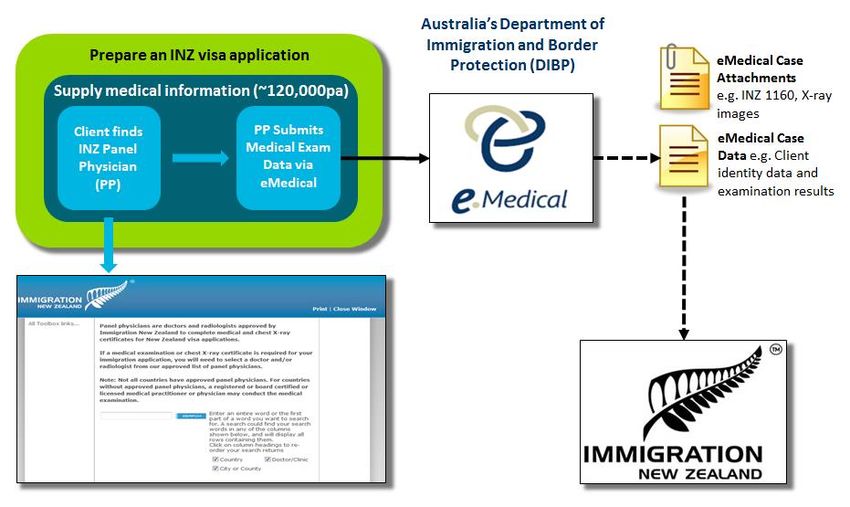
[Commercial In Confidence]Onshore Panel Physician Network
• Onshore panel completed
in January 2016
• 154 onshore panel clinics
– 82 medical
– 60 radiology
– 12 combined
• 16 onshore clinics also
panelled for Australia
Blue – Medical
Red – Radiology
Green – CombinedOnshore Review From 1 April 2015 to 31 March 2016: • 184,061 health cases submitted to INZ; • 32% of these were onshore (58,290); • 60% of onshore cases completed in Auckland region.
75%

                                                                     15%

Estimated Public Hospital Inpatient Costs for Haematological conditions---
Leukaemia, Myelodysplastic Disorder and Haemachromatosis
Colombia, Spain, Hungary, Mexico, Netherlands, Germany, Canada, United States, Poland.
Things we learned from looking at
                 clinics
• Know what you are measuring;
  – Auto-clearance and B-graded rates are not the
    same.

• Same training and education can result in
  different outcomes;

• What we say and what people hear are two
  different things.
Tricks and tips
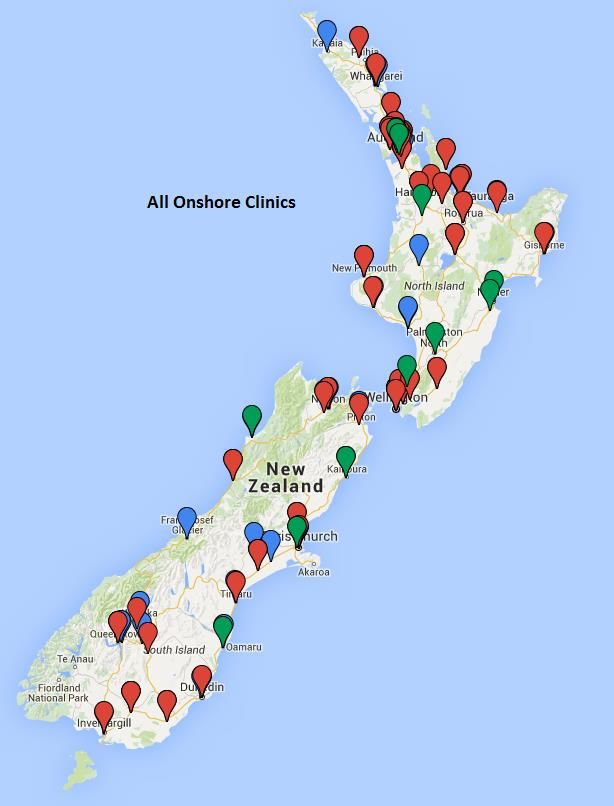
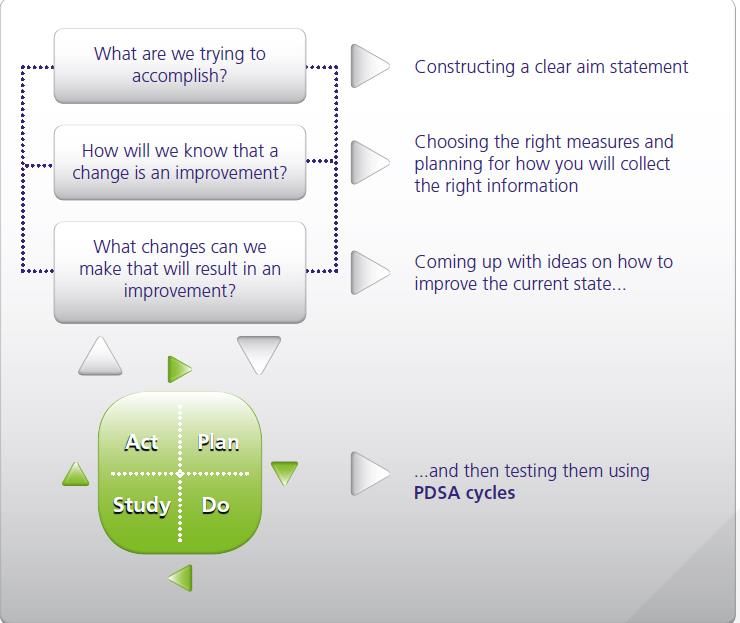
Data process
1. Measurement definition
  For QI crude measurements of the right thing are better than precise
  measures of the wrong thing

2. collection
  Collection process should be defined and accumulated in to some sort of
  data set

3. Analysis
  known before data collection occurs

4. Interpretation
  Understanding variation – common cause and special cause
Exercise – coming up with a measure
Operational Definition for Banana
              Size
Work with team to create a
 step by step operational
 definition to capture the
  concept of the size of a     Then use another
          banana              group’s definition to
                                 measure your
                                    banana

     Your banana measure:
Spot the difference…
Spot the
difference…
Results of this process…
Lets go back to our story
• Growing medicals

• Growing timeframes

• Growing complaints
Next steps…
• Plot the data

• Entered a ‘Plan – Do – Study – Act’ type cycle
  – Created a test environment to do this
  – Data analyst to help

Turned off 8 rules and left on 4!
Time to plot our own data...
Measure how many M & Ms in your packet.
Common Cause vs Special Cause
               Common cause
               • Variation are present in
                 the process due to it’s
                 inherent nature. These
                 are predictable and
                 expected variations.

               • Pitfalls – treating
                 common cause as
                 special cause variation.
Common Cause vs Special Cause
Special cause
• Variation are
introduced in the
process by non-random
events/factors external
to the process
• If special cause
variation is present,
then the process is said
to be unstable.Run charts vs standard statistics
Run charts vs standard Statistics?

Perla, Provost, Murray ‘The run chart: a simple analytical tool for learning from variation in healthcare processes’ - BMJ
Qual Saf 2011;20:46
How to make a run chart
• Where no previous data are
  available;
  – monthly outcome measure – use the first 12
    data points

  – weekly process measure–use the first 10
    data points (remember to keep sample size
    at around 20 for percentages), and

  – monthly process measure – use the first six
    data points.
Things to look for Shift • Is six or more consecutive points either all above or all below the median • Values that fall on the median neither add to nor break a shift.
Things to look for
Trend
• Is five or more consecutive point
  all going or all going down

• Either there is or is not a trend –
  no TRENDING
Things to look for
Astronomical Point
• Data point that is obviously
  different value
• Every data set has high and low
  points
• Worth trying to understand what
  caused it
But really….
• Easy to use quality improvement
  tool
   – ‘a simple way for everyone to see
     where you are at’ (Clinical Nurse
     Manager)

• Run chart as a visual reminder for
  measuring progress
   – ‘…the whole team got behind it-
     including the doctors’ (Practice
     Manager)
Lessons to learn • Start to collect and review data to understand the normal variation • Start with a stable process try and remove special cause variation before you start improving • Measure before you start improving • Understand common cause and special cause variation
Cool things with data
Summary
• Data is important to improvement processes
• Defining the aim and what you want to
  measure is key before you start Plan – Do –
  Study – Act cycle
• Understand variation
Useful tools
• Steps forward
       • https://www.stepsforward.org/modules/pdsa-
         quality-improvement

• University of Toronto Family medicine
   – Introduction to Measurement in Primary Care
     Quality Improvement

• Institute for Healthcare Improvement
   – http://www.ihi.org/resources/Pages/Tools/RunChart
     .aspx
You can also read