Debugging Symbian applications with IDA Pro
←
→
Page content transcription
If your browser does not render page correctly, please read the page content below
Debugging Symbian applications with IDA Pro
Copyright 2008 Hex-Rays SA
Starting from version 5.3 IDA adds the Symbian platform as a debugger target. User applications
and DLLs can be debugged with IDA Pro Standard Edition under MS Windows.
Before we debug any application, we have to install the
MetroTRK agent for the device. It can be downloaded
from this web site: http://tools.ext.nokia.com/agents
We install the MetroTRK .sisx file on the phone. This
icon should appear in the applications folder:
By default MetroTRK is configured to connect over
Bluetooth. For a USB connection, the settings must be
changed:
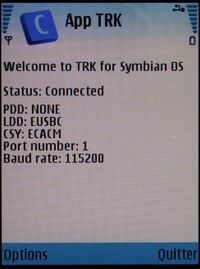
If everything done correctly, upon the « connect »
command we will see the following screen:
We are ready to debug Symbian applications!
Page 1
Let's start with a simple HelloWorld application. It can be downloaded from this link:
http://www.hex-rays.com/idapro/epoc/helloworldbasic.sis It is not signed, so you might need to
change the installation options before installing it. The following steps disable the signature
verification:
    1.   open the “Application Manager”
    2.   click the left soft key to open the options menu
    3.   from the list choose the point “Settings”
    4.   switch the option “Software Installation” to “All”
    5.   switch the option “Online certif. check” to “Off”
The sample application has the following look:

Upon a menu selection it will display a trivial message:

Page 2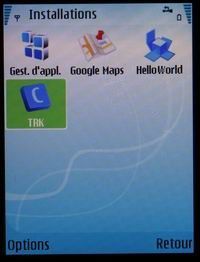
Now let's create a database for the application and debug it. IDA can parse .SIS files and extract
binary files, so we just accept the only file from the list:

We have to tell IDA where the application is located on the device and how to connect to it. This is
done in the Debugger, Process options dialog box:

Since we are debugging an application, the application and input file fields are the same (they are
different if we debug DLLs). Usually Symbian applications are installed on c:\sys\bin, but if your
device has memory extension cards, the device letter can be different.
IDA uses a serial port connection to talk to Symbian devices. The port number is specified in the
« port » input field. The default number proposed by IDA (23946) has a special meaning. It directs
IDA to enumerate all serial ports and find the one with the word « Nokia » in its description1. You
are free to specify a fixed serial port numbere in this field as well.
This completes the initial setup. We are ready to press F9 and run the application. However, it is
really difficult to suspend a Symbian application once it runs, so we better set some breakpoints
before launching it2. We can use only software breakpoints, hardware breakpoints are not available.

The following function is a good candidate because it will be executed at the initialization time.

1 If you want to use the « automatic port » feature of IDA for a phone from another vendor, you will need to define the
EPOC_PORT_DESCRIPTION environment variable with the desired substring.
2 The debugged application stops somewhere in the kernel upon « pause ». MetroTRK does not allow to single step in
the kernel area. Also, the kernel code is invisible. So, we may suspend the application but we will be in the middle of
nowhere.

Page 3
Pressing F2 adds the breakpoint:

We are ready to run the application, so we press F9. If everything goes well, IDA connects to the
device, launches the program, and switches to the debugger desktop (this one is custom made):

Please note that the addresses have been changed. This happens because applications rarely load to
the zero address. The system relocates them somewhere else. IDA detects this and rebases the
database. Usually rebasing is transparent and straighforward but if you notice that your code
disappeared after F9, then you will need to locate it in the memory and manually rebase the
database (Edit, Segments, Rebase program).
By default IDA is able to display addresses up to 0x8000000. If your device rebases applications to
higher addresses, then you will need to modify the memory layout. It can be done with the
Debugger, Manual memory regions.menu item3.

3 MetroTRK provides no information on the memory layout, so it must be done manually. IDA automatically
  determines the memory layout for most platforms.

Page 4
The following list enumerates the defined memory regions:

If you do not see anything meaningful on the screen after launching the application, try to increase
the upper limit of the defined memory region to 0xFFFFFFFE. You are free to manipulate memory
regions as you wish. IDA will use this information to create the program segmentation.

Once we suspended the process, we can use all regular debugger commands like single step, step
over, etc. All usual IDA commands are available. You may write scripts and automate things with
plugins. However, the following limitations exist:
–   The TRK module refuses to single step into system area, we can not do
    anything with it. This means that tracing will go up to a system call and then
    stop because of a failed single step command
–   Hardware data breakpoints are not supported
–   TRK can not properly handle an exception which happens on an instruction
    with active breakpoint. The exception is generated but it is impossible to resume
    the application.
–   There is no notion of 'handled/unhandled exception' in TRK, so modifying this setting
    in the exception definitions will not change anything.

Attaching to running applications
IDA can also attach to running applications. It can be done with an active database or without it. To
attach to a process without a database, select the following menu item:

(You can also run a new application using the Debugger, Run menu.)
If you have an open database, select Debugger, Attach to process.

Page 5
In both cases the following list will appear: We have a web browser running on the phone, so let's attach to it and debug it. After clicking ok, IDA attaches to the process and switches the debugger desktop: Page 6
Please note that we attached to the process but it did not suspend. It is still running, we do not have
any register values, no code is displayed on the disassembly view. This is normal. If we suspend it
by clicking on the pause     button4, we will be in the middle of nowhere (in the kernel).

Unfortunately, MetroTRK gives us no information on the memory layout, exported functions, and
other niceties like other debugger modules do. We will have to find out the code ourselves. First ,we
need to locate accessible memory. You may use the module list (Debugger, Debugger windows,
Module list) to get the list of loaded DLLs. You may also run a script like this:
auto ea;
for (ea=0x1000; ea < 0x8000000; ea=ea+0x10000)
{
  if ( Byte(ea) != 0xFF )
    Message("%a: readable memory\n", ea);
  // print something from time to time
  if ( (ea % 0x1000000) == 0x1000 )
    Message("%a: running\n", ea);
}

to determine readable memory.
Again, this is not enough, we also need to locate the code and put some breakpoints there. Only
after that we can intercept control and examine registers, single step, etc.
The following script can be used to convert the import table into code and add a breakpoint for each
imported function. You will need to find the import table yourself, though:
auto ea,i;
i=0;
for(ea=here; Dword(ea)==0xE51FF004; ea=ea+8)
{
  MakeCode(ea);
  AddBpt(ea);
}

4 In fact, we always need to suspend the attached application at least once because of a bug in IDA v5.3. If we do not
  suspend the application, IDA will not suspend on breakpoints.

Page 7
Troubleshooting If anything does not work, use -z10000 command line switch to get more information on the screen. In particular, communication with the TRK module will be displayed in detail. If you do not see any code after launching the application, check out the memory region setup (Debugger, Manual memory regions). MetroTRK provides no information on the memory layout and it must be congifured manually. If one big memory region is defined for the entire application, IDA might delete code at each pause. You can fix this by disabling the stack reconstruction in the Debugger, Debugger options menu. Page 8
You can also read