DECOMMISSIONING - Communities for a ...
←
→
Page content transcription
If your browser does not render page correctly, please read the page content below
DECOMMISSIONING CALIFORNIA REFINERIES
Machines that burn oil are going away.
We will burn much less oil, either to prevent the
increasing accumulation of pollution impacts
that could cause the collapse of human
societies as we know them, or as a footnote to
                                                                                            DECOMMISSIONING
                                                        A CBE Report . July 2020

the collapse of our societies and economies on
which the petroleum fuel chain now feeds.                                                   CALIFORNIA REFINERIES
Which path we take matters.                                                                 CLIMATE AND HEALTH PATHS IN AN OIL STATE

                                                                                            A Communities for a Better Environment Report . by Greg Karras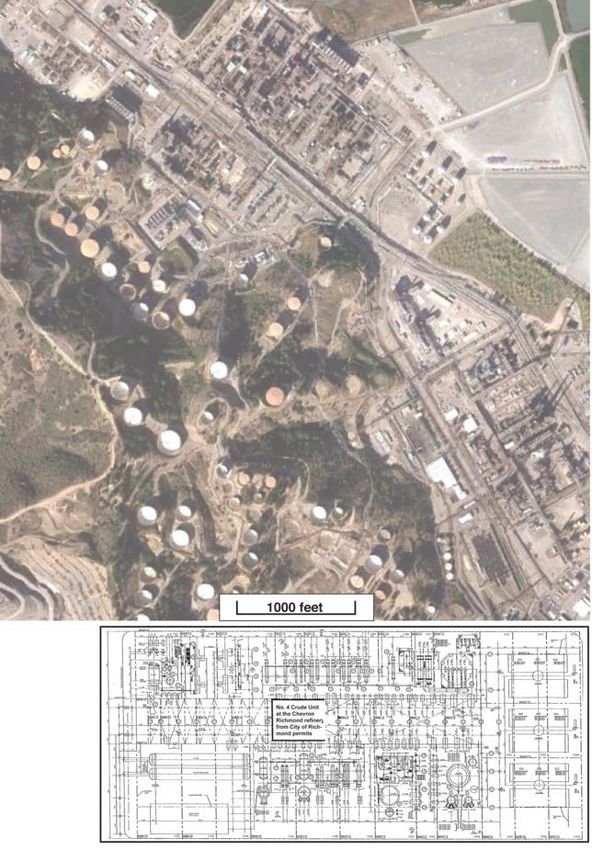
DECOMMISSIONING
        CALIFORNIA REFINERIES:
                CLIMATE AND HEALTH PATHS
                     IN AN OIL STATE

                                JULY 2020

                             A REPORT FOR
                 Communities for a Better Environment
   Huntington Park, Oakland, Richmond, & Wilmington, California
                             www.cbecal.org

                                    BY
                             GREG KARRAS
                      Community Energy reSource
                       www.energy-re-source.com

  CONTRIBUTORS:        Ernesto Arevalo, Gissela Chavez, Tyler Earl, Bahram
   Fazeli, Laura Gracia-Santiago, Shana Lazerow, Julia May, Darryl Molina
       Sarmiento, Zolboo Namkhaidorj, Alicia Rivera, Dan Sakaguchi
                             and Andrés Soto

COMMUNITIES FOR A BETTER ENVIRONMENT (CBE) is a community-
based environmental justice nonprofit group founded in 1978. CBE
provides residents in blighted and heavily polluted urban communities in
California with organizing skills, leadership training and legal, scientific
and technical assistance to successfully confront threats to their health
and well-being. CBE’s mission is to build people’s power in communities
of color and low income communities to achieve environmental health
and justice by preventing and reducing pollution and building green,
healthy and sustainable communities and environments.
Relevant to this report, CBE’s work for and with communities on the
frontlines of the largest oil refining center in western North America has,
over four decades, built uniquely independent site-specific knowledge
and expertise regarding oil in California.
ACKNOWLEDGEMENTS

Many people helped to make this report possible in many ways. For their
seminal work this research builds upon, gracious sharing of ideas and insights
on various parts of the analysis, or both we wish to thank Ken Alex, Adrienne
Bloch, Dave Campbell, Danny Cullenward, Steven J. Davis, Bill Gallegos, Erica
Kent, Matt Krogh, Heather Kuiper, Ratha Lai, Roger Lin, Alan Lloyd, Jose
Lopez, Elsa Monroe, Rachel Morello-Frosch, Steve Nadel, Simon Mui, Manuel
Pastor, Alan Ramo, Jim Sadd, Mike Smith, Camille Stough, Janet Stromberg,
Margaret Torn, Kelly Trout, Shoshana Wechsler, V. John White, James Wil-
liams, and Isabella Zizi.                                                          CONTENTS

Funding for parts of this project was provided by CBE’s members and The
Argosy Foundation, The Chorus Foundation, The Mayer & Morris Kaplan                Author’s note
Family Foundation, The Patagonia Foundation, The Resource Legacy Fund,             Executive summary                                   1
The San Francisco Foundation, and The Schmidt Family Foundation / The 11th
                                                                                   Introduction                                         6
Hour Project.
                                                                                   Chapter 1.
Most of all, CBE’s members made this possible. It’s no accident that CBE built     Decoding the petroleum fuel chain in California     10
independent, site-specific oil sector expertise over four decades in California.   Chapter 2.
Our communities shared site-specific knowledge, framed crucial questions,          Why must oil refineries be decommissioned?          29
and supported independent research to answer them, and did so consistently
over 40 years.                                                                     Chapter 3.
                                                                                   When should the decommissioning start?              39
Any error or oversight in this independent analysis is solely ours.                Chapter 4.
                                                                                   Can we wait for the refineries to wear out?         47
Thank you all!
                                                                                   Chapter 5.
                                                                                   What does this say about carbon trading?            53
SUGGESTED CITATION
Karras, G. 2020. Decommissioning California Refineries: Climate and Health         Chapter 6.
Paths in an Oil State. Two volumes including a Supporting Material Appendix        Blueprint for just transitions from oil             67
available online. Communities for a Better Environment (CBE): Huntington                                                               85
                                                                                   Background: refining technology, system boundary
Park, Oakland, Richmond, and Wilmington, CA.
                                                                                   References                                          94
Download a pdf of this report from CBE and Community Energy reSource.              Glossary                                           107
Order the book from Community Energy reSource (energy-re-source.com).

Cover photo: CBE                                                                   Supporting material is available online.
Printed with union labor.                                                          See Reference 1 herein.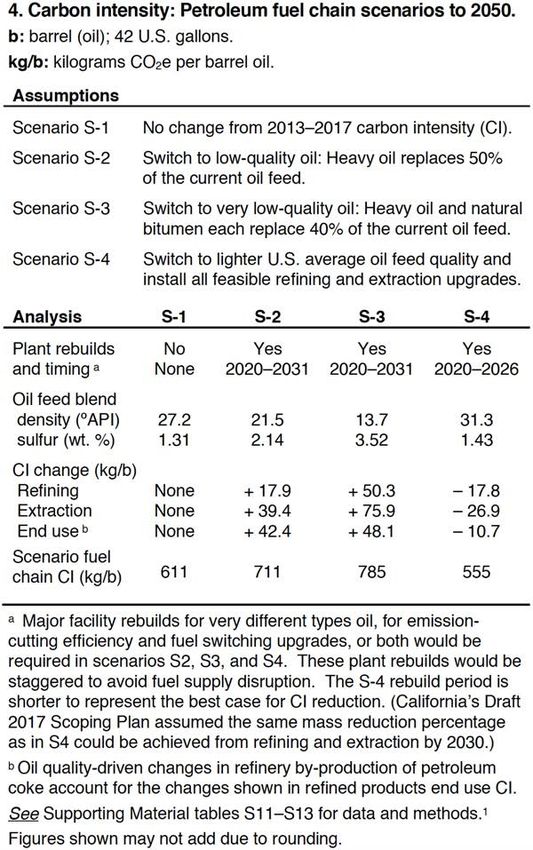
CONTENTS                                                                                                                                   CONTENTS

TABLES
 1. California refineries in service: Energy Commission data.          12    10. Effect of delay on annual refinery feed rate cuts to the 2050
                                                                             climate limit: Scenarios S1–S4, 10–20% capacity reserve.             45
 2. Extraction, refining, and burning of oil refined in California:
 Fuel chain volume and emission, 2013–2017.                            19    11. Refining capacity left in service from 2020–2050 if the state
                                                                             climate limit will be met versus if the refinery equipment already
 3. Petroleum fuel chain CO2e co-pollutant emissions, 2015.            25    built is used for its operable duration.                             49
 4. Carbon intensity: Petroleum fuel chain scenarios to 2050.          35    12. Carbon market data for oil refined in California.                55
 5. Effect of delaying decommissioning on climate-stranded                   13. Fuel shares of electricity used in California, 2007–2017.        59
 refining assets assuming no change in refinery operable duration.     51
                                                                             14. California jobs per $million revenue by economic sector.         69
 6. Comparison of engine fuels production and petroleum fuel
                                                                             15. Effect of decommissioning refinery export capacity first
 chain CO2e emissions from oil refined in California since 2013.       54
                                                                             along early action pathways to the state’s climate limit.            81
 7. Power plant and refinery sales per ton CO2e emitted.               59
 8. Heavy oil refining capacity in California, 1994 and 2017.          63
 9. Climate pathway feasibility before 2023 versus after 2030.         65   IMAGES
                                                                             Decoding the petroleum fuel chain in California.                     10
 10. Costs of crude oil imports to California and of gasoline
 inefficiency to Californians, 2013–2017.                              71    Oil refining centers of western North America.                       13
 11. Evolution of refinery turnaround work to implement least-               Exports of engine fuels by California refineries, 2013.              15
 impact climate and health pathways.                                   75    Chevron Richmond refinery catastrophic pipe rupture fire.            23
                                                                             Refinery workers strike for plant safety, Martinez, 2015.            23
CHARTS
                                                                             Anthony (“Tony”) Mazzocchi.                                          66
 1. California oil imports by region of the world, 2013–2016.          14
                                                                             A refinery’s processing equipment viewed from the sky.               84
 2. Oil feed quality predicts refinery carbon intensity.               17
                                                                             Side effects of refinery processing: three examples.                 87
 3. Energy Commission refinery oil imports forecast.                   21
 4. Community demographics by race in Wilmington, Richmond,
 and Oakland, CA.                                                      27
                                                                            INSET BOXES
 5. Example of cumulative emission without feed rate cuts, assum-
 ing steady progress to California’s 2050 climate limit by all other         Gasoline is an outdated technology.                                  11
 (non-petroleum) emissions.                                            31    Carbon intensity and feed rate drive mass emitted.                   17
 6. Cumulative emission limit defined by state climate targets.        33    Plant ‘turnaround.’                                                  24
 7. Cumulative emission along petroleum fuel chain pathways                  They could just say it’s inherently polluting.                       24
 without refinery feed rate cuts.                                      37
                                                                             Cumulative emission.                                                 32
 8. Effect of delay on annual refinery feed rate cuts to the 2050
 climate limit: Scenario S1, 20% capacity reserve.                     41    The effect of delay on annual refinery cuts is simple math.          39
 9. Effect of delay on annual refinery feed rate cuts to the 2050            Factors affecting operable duration of refining capacity.            91
 climate limit: Scenario S1, 10–20% capacity reserve.                  43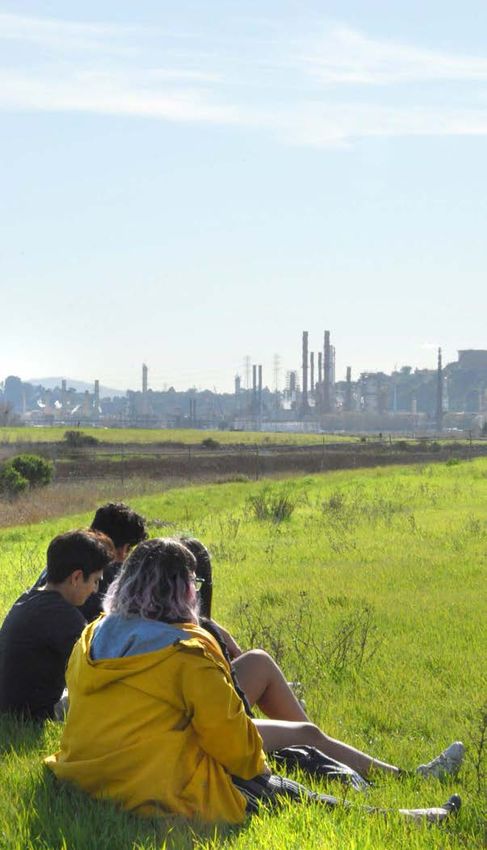
AUTHOR’S NOTE

AUTHOR’S NOTE
Plague struck as this report went to press. Even as the virus, the                                                               crude
                                                                                                12
partial economic shutdown to control it, and the injustice leaving
black, brown, working class and institutionalized people more
vulnerable take still more lives and livelihoods, how to rebuild                                10

                                                                       Millions of barrels per week
is in question. Oil and gas activities were expected to rebound                                                                  gasoline
quickly and, potentially, to retrench thereafter.1–3 † Authoritative                                  8

assessments warned of lasting damage to prospects for stabilizing

                                                                                                                                                       March 20
our climate at 1.5–2ºC above pre-industrial levels in the absence                                     6

of systemic structural change.3, 4 The International Energy Agency
called on governments and banks to rebuild the economy by                                             4
                                                                                                                                 jet fuel
investing in renewable energy instead of fossil fuels.4 In short,
side effects of the pandemic have proven relevant to what this                                        2
report is about.                                                                                                                 distillate-diesel

                                                                                                      0
REFINING EFFECT: CAPACITY IDLED FOR WEEKS                                                                     Jan                               Feb   Mar         Apr            May          Jun

Chart A illustrates a side effect of the virus on refining rates.           A. California oil refining rates, January to mid-June 2020.                                                5

Between March 20 and May 30, 2020, while personal travel was
paused after California’s March 19 shelter in place order, refiners
in the state made 30 % less gasoline and 56 % less jet fuel than
                                                                                                      450
they had in any year of the previous decade.5 By the first week of                                                                                                actual annual emissions
                                                                                                                                                                  weekly variability
May, despite a glut of cheap crude, an unprecedented 33 % of the
                                                                                                                                                                  least disruptive, most feasible
crude capacity they had used in that week every year for a decade                                                                                                 trajectory to state climate
                                                                                                      350                                                         targets starting in 2021

                                                                       Millions of tons per year
was idled.5 By mid June refining rates had begun to go back up.5                                                                                                  cumulative emission (values
                                                                                                                                                                  in shading along bottom axis
While unsustainable, the pause in travel could only idle refining                                                                                                 in billions of tons from 2013)

capacity at all because the links in the petroleum fuel chain are                                     250
interdependent—which is a key theme in the report.

                                                                                                                                 Jan 1 2020
                                                                                                                    Jan 1 2018
EMISSION EFFECT: ONLY A BLIP
                                                                                                      150
This side effect that idled refining capacity for a few weeks cut
well-to-wheel petroleum emissions deeply—for a few weeks.6
The unprecedented weekly variability since March 2020 (red line                                                                               3.3           6.1            7.7                 8.6
                                                                                                       50
in Chart B) changed the annual emissions trajectory (black line)                                            2013                       2020            2030              2040                2050
less in 2020 to date than it changed in prior years. The net effect         B. CO2e emissions from extracting, refining, and burning the oil
on cumulative emissions (the shaded area under the black line) is              refined in California assuming the least disruptive, most feasible
weak. Cumulative emissions from 2013 to June 2020 changed                      path to state climate targets starting in 2021.5–7    Ton: Metric ton

†
    References cited in this author’s note are given on page iv.                                                                                      – ii –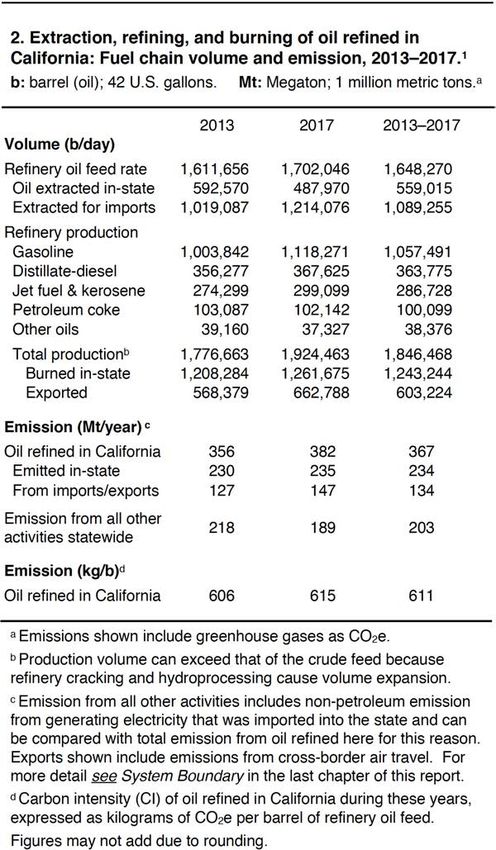
AUTHOR’S NOTE                                                                                                                                          AUTHOR’S NOTE

little (+ 0.5 %) compared with those if the annual emissions had
remained unchanged at their 2013–2017 rate. And by mid June                                                +5

                                                                      Change from same week in 2019 (PJ)
the expected oil rebound1–3 appeared to have begun (Chart A).                                                                                   solar and wind
                                                                                                             0
Year on year emission cuts of the same 4–7 % magnitude now
expected in 2020 will be needed to hold global heating at 1.5–2ºC.3                                        –5
The dashed black line in Chart B shows this for emissions from                                                                                  gasoline, distillate-
                                                                                                                                                diesel and jet fuels
oil refined in California based on current information.7 But this                                          –10
smooth trajectory shown assumes that sustained refining rate
cuts start in 2021. Delay could force the annual refining rate cuts                                        –15

                                                                                                                               March 20, 2020
needed for meeting state climate targets to deepen exponentially,
                                                                                                           –20
forcing them to dive from 20 % per year toward 80 % per year
starting in 2026–2030.7 That is the same timing of potential
                                                                                                           –25
impacts from delay documented in this report.                                                                    Jan   Feb   Mar                Apr         May         Jun
The plague has not bought us time in our climate crisis.                   C. Oil refining v. solar and wind power: change from 2019 in
                                                                              California fuel energy production.8, 9  PJ: Petajoule; 278 MWh.
ENERGY EFFECT: A DIFFERENCE IN RESILIENCE

As California refining assets became unproductive in the weeks
after the shelter in place order,8 built investments in solar and          (1) Adam et al., 2020. Global Energy Review 2020: The impacts of the COVID
wind power did not.9 (Chart C.) And a similar pattern emerged              19 crisis on global energy demand and CO2 emissions. Revised April 2020.
                                                                           International Energy Agency: Paris, FR. www.iea.org.
globally.1 This suggests that the resilience of clean electricity          (2) Short-Term Energy Outlook; U.S. Energy Information Administration:
investments in future crises may be an under-appreciated                   Washington, D.C. June 9, 2020. https://www.eia.gov/outlooks/steo.
advantage of decarbonizing transportation.                                 (3) Le Quéré et al., 2020. Temporary reduction in daily global CO2 emissions
                                                                           during COVID-19 forced confinement. Nature Climate Change.
                                                                           https://doi.org/10.1038/s41558=020=0797-x.
FOR THE FUTURE
                                                                           (4) McGlade, C., and Wetzel, D. 2020. Sustainable Recovery: World energy
Peoples’ collective public health response to this virus began to          outlook special report in collaboration with the International Monetary Fund;
change our energy system. But that unintended side effect is               International Energy Agency: Paris, FR. www.iea.org.
                                                                           (5) Fuel Watch; California Energy Commission: Sacramento, CA. https://ww2.
temporary. It was unplanned, sudden, and achieved by means                 energy.ca.gov/almanac/petroleum_data/fuels_watch/index_cms.html.
too unjust to sustain year after year. The window for organizing           (6) Emissions to date estimated from crude vol. refined in state (ref. 5) and
gradual, smooth, just transitions to sustainable energy is closing.        mean 2013–2017 petroleum fuel chain carbon intensity shown in this report.
                                                                           (7) Trajectory to state climate targets estimated from recent data (ref. 6) and
Our future is at stake.                                                    forecasts to 2021 (ref. 3) based on methods described in chapters 1–3 and tables
                                                                           S1–S17 of this report assuming (a) sustained petroleum emission cuts starting
Greg Karras                                                                in 2021, (b) no change in the carbon intensity of oil, and (c) all non-petroleum
                                                                           emissions meet state targets. Importantly, delaying the start of sustained cuts
June 22, 2020                                                              until after 2025 would result in much steeper trajectories than that shown.
                                                                           (8) From refined fuel volumes (ref. 5) and energy contents (Table 6, this report).
                                                                           (9) Renewables Watch; California Independent System Operator: Folsom, CA.
                                                                           www.caiso.com/market/Pages/ReportsBulletins/RenewablesReporting.aspx.

                               – iii –                                                                                       – iv –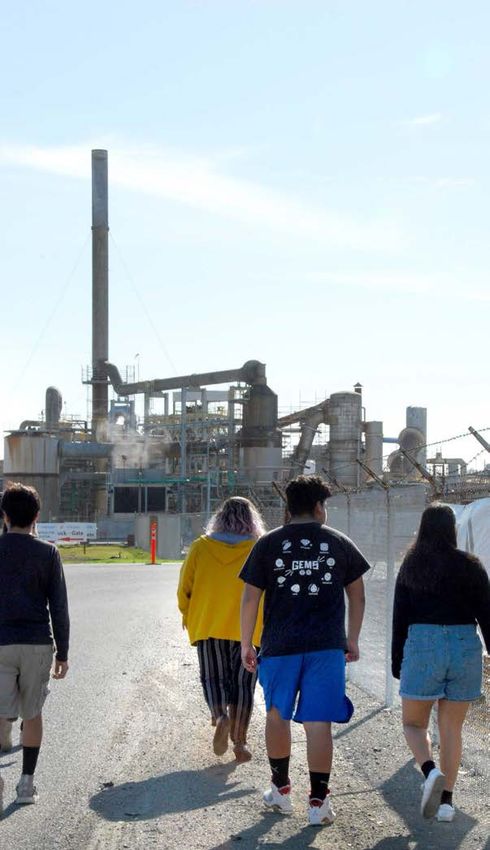
Pathway (climate):  A road map for the array of technologies
               and measures to be deployed over time, and for the
               cumulative climate emission trajectory associated with this
               sequence of actions. Path.

             EXECUTIVE SUMMARY
             This report compares emission, transition, and investment
             impacts of pathways that could be taken in California to identify
             the most feasible paths for climate and health protection. It
             focuses on oil—the most entrenched fossil fuel in this state.
             Here, “climate protection” means meeting the state’s 2050 climate
             limit. This cumulative emission limit is defined by state climate
             targets, and represents the state’s share of global emission cuts for
             a better-than-even chance of holding global heating to between
             1.5ºC and 2ºC above pre-industrial levels.
             Major findings of this work and some immediate implications of
             these findings for policy actions are summarized below.

             FINDING 1: Phasing down oil refining is pivotal to climate
                        and health in California.
             Emissions from burning oil accounted for nearly two-thirds
             of statewide carbon emissions and continued to increase
             from 2013–2017. From extraction to refining to refined fuels
             combustion in transportation and industry, the petroleum fuel
             chain is a series of interdependent and inherently polluting steps
             or “links.” Breaking one link in the chain can cut emissions
             across the whole fuel chain. In California this link is refining.
             Refiners here are increasing production by importing more crude
             and exporting more product. They now import two out of every
             three barrels of crude refined here and export 20–33 percent of
             all fuels refined here. This means actions that limit refining here
Photo: CBE   can cut emissions across the petroleum fuel chain.

                                             –1–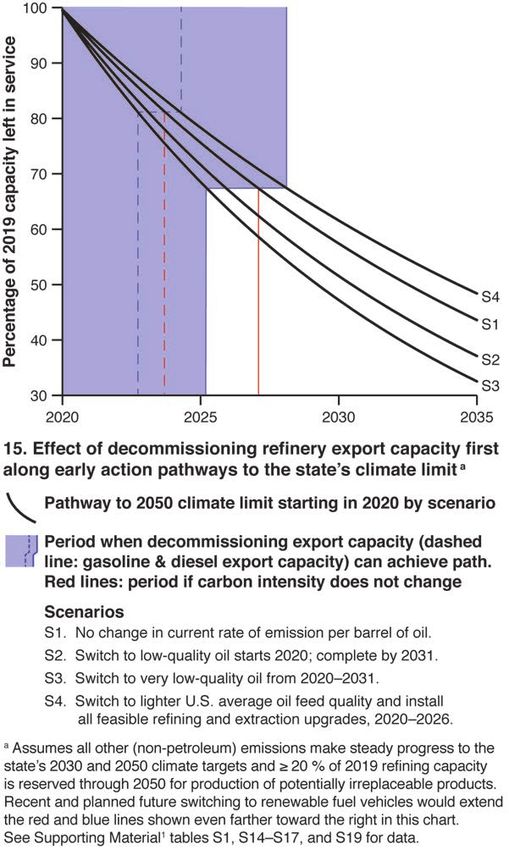
EXECUTIVE SUMMARY                                                                                                  EXECUTIVE SUMMARY

   FINDING 2: To achieve California’s climate and health                   FINDING 4: Paths to the climate limit that start now to decom-
                 protection goals refineries must process less oil.                     mission refining capacity minimize stranded assets.
   Even if all non-petroleum emissions are cut to their share of the       California refiners over-built. Some refining capacity will not
   state’s 2050 climate limit and every measure to reduce petroleum        wear out before it must be decommissioned to meet the state’s
   fuel chain carbon intensity that is proven in practice is used, total   climate limit. Even if no new projects expand refineries, to meet
   statewide emissions will exceed the limit. Emissions from 2017–         the limit, otherwise operable capacity must be decommissioned
   2050 exceed the climate limit by ≈ 4,800–8,350 million metric           at rates of 2.7–3.4 percent per year if we start now, 21–62 % per
   tons, or 46–79 %, without refinery feed rate cuts. Particulate          year starting in 2031, and 62–88 % per year starting in 2033. This
   matter (PM2.5) co-emitted with this 4,800–8,350 Mt petroleum            means we can expect that refiners will fight even harder to keep
   fuel chain CO2e emission excess could kill ≈ 22,000–38,000 people       using their climate-stranded assets if we wait until later to start
   through 2050. All paths to climate and health protection that are       decommissioning.
   known to be feasible involve refining much less oil.
                                                                           FINDING 5: Paths to the climate limit that start now to decom-
   FINDING 3: Paths to the climate limit that start now to                             mission refining capacity support just transitions.
                 decommission refining capacity minimize                   Just transitions could make our path to climate stabilization
                 transition impacts.                                       feasible politically. When we cannot take the collective actions
   Pathways to the state’s 2050 climate limit that start to cut oil        we must take to survive, our solution is clear: help each other.
   use sooner allow decommmissioning more gradually. Starting              We could extend our social safety net to workers, families, and
   now, in 2020–2022, the limit can be met by retiring only 4.4–8.6        communities that now depend on oil taxes and jobs, extend our
                                                      percent of           toxic site cleanup policies to clean up the toxicity that oil depen-
                                                      refining capacity    dence has left in the soils and economies of our communities,
Our most feasible paths to climate and health         annually. This       and target support where it is needed most. But how much of
protection decommission refining capacity             gradual pace can     this we can do for how
gradually by starting to decommission it now.         be met for years     many quickly enough
                                                                                                            To ensure a sustainable future,
                                                      by retiring export   depends on the path of
                                                                           transformative change we         we had better start using all the tools
                                                      capacity, thus
   minimizing the risk of fuel price spikes for California drivers.        choose. Gradually retiring in the policy toolbox.
   Developing already-proven sustainable alternatives to replace           and replacing ≈ 5–7 %
   communities’ oil-dependent taxes and jobs at this rate would be         of our oil dependence annually over 30 years from 2020–2050
   hard work, but doable with transition support. Since refining is a      supports just transitions. Waiting until after 2030 and then being
   jobs-poor business, this could create more jobs.                        forced to replace nearly all of it in just a few short years to meet
                                                                           our climate limit does not.
   In contrast, waiting until 2027–2031 could force steep refining
   losses of 20–80 % per year to meet the limit. And waiting until         FINDING 6: State policy threatens to foreclose feasible
   2033 would force as much as 90 % of all oil refining capacity to                     paths to the state’s 2050 climate limit.
   be lost in only one to three years on the remaining technically
                                                                           State policy prohibits state agencies from applying plant-specific
   feasible paths which could still meet the climate limit by then.
                                                                           carbon cutting limits and other technology-forcing measures to
                                                                           refineries under the state’s carbon trading scheme. This carbon

                                   –2–                                                                    –3–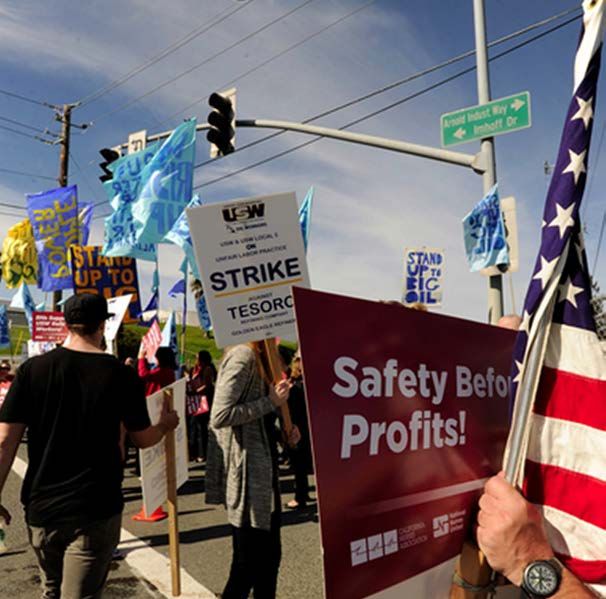
EXECUTIVE SUMMARY                                                                                                   EXECUTIVE SUMMARY

trading-only policy for refining has failed to cut petroleum fuel       5. Set facility-specific refinery combustion emission limits on
chain emissions or incentivize a switch from oil to sustainable            pollutant mass and oil feed throughput which decrease at rates
alternatives. Further, it failed because of inherent limitations of        needed to ensure that state climate and health protection goals
carbon trading that appear unresolvable. But state law mandates            are met (e.g., –5 % or –6 % per year starting in 2020 or 2022,
this failed policy through 2030. That could irreversibly foreclose         respectively, assuming action number 9 below). City, county,
our most feasible paths to climate and health protection.                  regional and state officials could take this action.

SOME STARTING POINTS
                                                                        6. Ensure that California’s transportation fuel-switching effort
                                                                           outpaces its need to decommission refining capacity through
This research suggests some immediate, technically feasible and
                                                                           aggressive measures to ensure clean mobility for all people.
mutually-reinforcing actions which, taken together, would help
                                                                           State officials could take this action.
to ensure that achieving climate and health protection could be
economically sustainable for all Californians—and thus, more            Change the rules
likely to prove feasible politically. Communities could organize to     7. Challenge the environmental injustice of permitting harmful
hold our public officials accountable for these actions:                   refinery emissions solely to export fuels that Californians do
Support just transitions                                                   not use or need. City, county, regional and state officials can
                                                                           take this action.
1. Extend our social safety net so that all those whose jobs or
   communities are now dependent on oil are guaranteed                  8. Revise state law to rescind the exemption from carbon-cutting
   support for job transition, health care, college tuition, housing,      emission limits on refineries and the carbon trading-only policy
   and retirement security. State officials could take this action.        for oil refining enacted by Assembly Bill 398 in 2017. State
                                                                           legislators and Governor Newsom could take this action.
2. Establish Just Transition Bonds to remedy site-specific legacy
   impacts, including pollution and deferred development of             9. Reject new construction projects that would expand or
   sustainable economic alternatives. Secure a Bond from each              prolong the operable duration of oil refining capacity.
   refiner up front to ensure against abandonment upon closure.            Governor Newsom could take this “moratorium” action by
   City, county, and state officials could take this action.               executive order. Alternatively, communities can continue to
                                                                           hold public officials accountable for rejecting these projects.
3. Quantify local taxes and fees paid by oil companies and
   develop sustainable alternatives to replace these revenues
   locally as refineries decommission. City and county officials
   could take this action.

Decommission refining capacity
4. Acknowledge that quickly starting a gradual decommissioning of
   refining capacity is an essential part of the most feasible paths
   to achieving state climate goals with proven technology.
   The state’s Air Resources Board could take this action.

                                –4–                                                                     –5–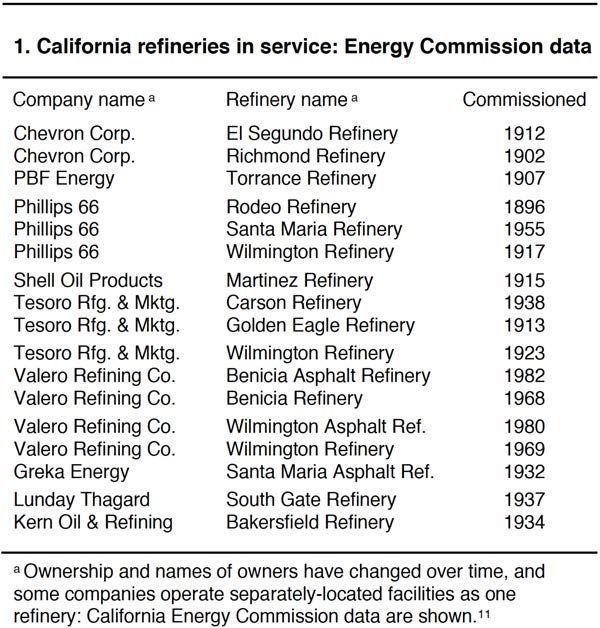
INTRODUCTION

                                                                          Communities rose up to stop tar sands projects in many inspiring
                                                                          efforts that for a decade have held to a trickle the flood of cheaper,
                                                                          dirtier oil that refiners sought. But some projects slipped
                                                                          through. The petroleum fuel chain emits more carbon from
                                                                          extracting, refining, and burning fuels made from the oil refined
From well to wheel, extracting, refining and burning fuels
                                                                          in California than all other activities in the state combined, and
made from the oil refined in California emits more carbon
                                                                          as other emissions have begun to decline, its emissions have not.
than all other activities in the state combined.
                                                                          In fact its emissions increased from 2013–2017 as refiners here
                                                                          increased production for exports that sold for more money than
                                                                          the entire oil sector spent on permits to emit under the state’s
                                                                          carbon trading scheme. They could do that because no refiner
                                                                          faced any limit on carbon emissions from its plant. They still
INTRODUCTION
                                                                          can because politicians caved in to their demand to make carbon
Machines that burn oil are going away. We will burn much less             trading the only curb on those emissions. Since 2017, state law
oil, either to prevent the increasing accumulation of pollution           has prohibited state air officials from setting a carbon-cutting
impacts that could cause the collapse of human societies as we            limit on any oil refining plant under this carbon trading scheme.
know them, or as a footnote to the collapse of our societies and
economies on which the petroleum fuel chain now feeds. Which              Governor Brown argued this law was the best “compromise” that
path we take matters.                                                     was politically feasible. Yet state climate policy has ignored the
                                                                          need, first voiced by the Oil, Chemical & Atomic Workers Union
Sustainable energy technologies that are proven, available now,           decades ago, for a mandate that assures workers a just transition.
and obviously more economic than societal collapse could replace
oil and other fossil fuels. But critical oil infrastructure, permitted    Equally important to political feasibility, communities must
mainly in working class communities and communities of color,             predict how fast to transition their job and tax bases from oil
is still growing. Environmental, economic, and racial injustice           to sustainable alternatives. But by letting any polluter delay
weaken societal capacity to break free of this toxic path. Societal       emission cuts at any time, pollution trading makes it harder to
capacity to organize—political feasibility—has emerged as the             make this very prediction.
primary barrier to solving our existential pollution crisis.              Our situation raises a crucial question:
California has this problem. It hosts the largest oil refining center       What is the least-impact, most socially just, most feasible
in western North America. It has the worst air pollution in the             path to climate and health protection in California?
nation, and yet it has allowed its oil sector’s critical infrastructure
to grow in low-income communities of color, where this                    Despite its claims to climate leadership, the state has not
pollution is disparately severe compared with the state average.          answered or even defined this question specifically for the oil
It uses pollution trading—the exchange of money for permits to            sector in California. Instead, it has relied on the oil companies
pollute—leaving communities largely on our own to fight refinery          and other carbon emitters to figure it out under a carbon trading
and oil terminal expansion projects.                                      program called cap-and-trade. When pressed for its own

                                 –6–                                                                      –7–
INTRODUCTION INTRODUCTION
independent analysis at its Climate Scoping Plan Hearing on path of continuously declining emissions that add up to a total
December 14, 2017, California Air Resources Board Chair Mary cumulative emission limit through 2050. This climate limit is
Nichols explained: consistent with the state’s share of global emission cuts for a 67 %
chance of holding global heating to between 1.5ºC and 2ºC. The
“That’s the point of cap-and-trade … we think that the people
comparisons used a conservative best-case assumption that all
who have these emissions are smarter about where they can
other, non-petroleum emissions will be cut to their share of the
get the reductions cheaper, and that’s what they will do.”
climate limit. Chapter 2 describes these analyses.
And so it is that, in our crisis with oil, we have to find our own
Transition impacts along paths to the climate limit were compared
way. Research reported here reveals specific answers to this
based on the pace of refinery decommissioning to meet the limit
question about the least-impact, most socially just, most feasible
and refining capacity that could remain in service through 2050
path to climate and health protection in California.
along each pathway. These analyses are described in Chapter 3.
Cumulative emissions to 2050 were estimated for the extraction,
Stranded asset impacts along pathways to the climate limit were
refining, and refined fuel combustion associated with oil refined
compared based on the refining capacity that could remain in
in California along 161 potential pathways. A “pathway” is a road
service if it is used for its operable duration. Operable duration
map for the array of technologies and measures to be deployed
was estimated from data on actual usage of critical equipment in
over time and for the emission trajectory to be caused by these
California refineries. Chapter 4 describes these analyses.
actions.
Based on the results of these analyses paths were compared
High quality local, state, and federal data on current conditions
to inform just transition plans and responses to the failure of
were assessed to define the starting point for these paths, as
current oil sector policy. These comparisons reveal crucial
described in Chapter 1, Decoding the Petroleum Fuel Chain in
differences in the extent of disparately severe localized transition
California. This fuel chain emits from the extraction, refining,
impacts between early action and delayed action paths, and
and combustion of fuels made from oil refined here. It imports
the critical role of social justice to the feasibility of climate
crude on top of the crude extracted here. It exports refined fuels
stabilization.
on top of those burned in transportation and industry here. Its
local and global footprint is driven by the quantity and quality of Chapters 5 links the state’s climate policy failure with oil to
oil feeding refineries in California. inherent limitations of carbon trading that threaten to foreclose
feasible pathways to climate stabilization. Chapter 6 describes
Pathways are defined and differences among them are described
some opportunities that emerge from this research for strategic
in chapters 2 and 3. Paths assessed span the range of plausible
action and sustainable climate and health policy, in a blueprint
future emissions per barrel of oil used, oil usage rates (refinery
for organizing just transitions out of our crisis with oil.
feed rates), and start dates for refinery feed rate reduction
(decommissioning) through 2050. A glossary is included at the back of this book to help to solve
the mystery of any unfamiliar terms you might find in the text.
Pathways’ emission impacts were compared based on the state’s
Data and methodological details of this research are given in a
climate targets and the risk of premature deaths from breathing
separately bound “Supporting Material” appendix that is available
co-emitted PM2.5 air pollution. State climate targets quantify a
online free of charge.1
–8– –9–DECODING THE PETROLEUM FUEL CHAIN IN CALIFORNIA
But the oil industry’s political assertion that this dependence on
DECODING THE PETROLEUM FUEL CHAIN IN CALIFORNIA oil is necessary and good for our economy is simply false.
Oil refined here emits all along the fuel chain,
wherever it is extracted and As early as 2011, Williams and colleagues showed that an array
finally used as fuels of proven technologies featuring decarbonized electricity and
electric-drive transportation could be deployed economically
over time to meet California’s climate targets.3 Since then they
EXTRACTION REFINING END USE showed that this pathway could work in the U.S. as a whole.4
Electric cars go three times as far per unit fuel energy as gasoline
CRUDE FUELS cars.5 And while the old combustion technology is mature,6 the
TRANSPORT TRANSPORT
20-33% outside new technology will improve. By 2015, as measured by total
≈ 66% outside the state and
California growing (pet
ownership cost with subsidies, battery-electric cars already
and growing coke, diesel, appeared less expensive than petroleum cars in the United
(the refineries Oil and fuel gasoline, and
here import ports, terminals & pipelines other refined
Kingdom, Japan, Texas—and California.7
crude) in California fuel exports)
Meanwhile, ten of the last 11 U.S. recessions followed on oil price
spikes.8 Even at recent, relatively stable-to-low oil prices,9 crude
oil imports1 cost California an estimated $27.6 billion annually.
And oil is a capital-intensive, jobs-poor technology. Federal
1. DECODING THE PETROLEUM FUEL CHAIN IN CALIFORNIA employment and revenue data10 show that oil refining employs
Current conditions define the starting point for any path into the fewest people per dollar economic activity of any sector in
our future. Finding our way depends in large part on decoding California’s economy.
the petroleum fuel chain in California—the sequence of
interdependent links in a fuel chain that extracts oil, refines
it here, and burns refined fuels in motor vehicles, aircraft and GASOLINE IS AN OUTDATED TECHNOLOGY
industry. Conditions that define our starting point include the Even if burning gasoline wasn’t too polluting there’s a better
current function, setting, and emissions footprint of this fuel way to get get around in cars. Electric cars can go three
times as far on the same amount of energy.5 That’s because
chain, and what is changing it. gasoline-fired cars waste so much fuel energy as heat.
Those fuel savings add up. Looking at the whole cost of
FUNCTION
buying and driving the car, with current subsidies battery
Petroleum fuels transportation. Gasoline, distillate-diesel and electric cars are cheaper than gasoline cars now by some
accounts.7 By others, with the better batteries that are
jet fuel account for some nine-tenths of California refinery
coming they will be cheaper soon.
fuels production.1 Oil-based fuels supply more than 90 % of
How fast things change depends on which technology we
transportation energy needs in California today,2 refiners here
permit, build and subsidize. But the laws of thermodynamics
supply those fuels, and gasoline and distillate-diesel oils—the won’t change: Electricity is a more efficient transportation
ground transportation fuels—account for more than 80 % of the fuel than gasoline.
statewide refined fuels production that is used here.1
– 10 – – 11 –DECODING THE PETROLEUM FUEL CHAIN IN CALIFORNIA DECODING THE PETROLEUM FUEL CHAIN IN CALIFORNIA
If we had solar energy, charging stations and electric vehicles
instead of refineries, gas stations, gasoline cars and diesel trucks,
we wouldn’t switch to oil now. Oil is not the best transportation
technology—it is the one that was built here first.
SETTING
The oldest oil refinery operating in the state was first built in
1896.11 Today, California hosts the dominant oil refining center
in western North America. Statewide refining capacity is more
than three times that of the next largest western North American
refining center, in Puget Sound, WA, and more than six times
that of all Pacific-coast Mexico and Central America combined.12
Concentrated around the major seaports of the Los Angeles and
San Francisco Bay areas, this oil refining behemoth imports twice
the volume of crude that is extracted in California. Two-thirds
(≈ 66 %) of the oil refined here was imported from other states
and nations during 2013–2017.1 More than three-fourths of
the imports were foreign oils, mainly from the Persian Gulf and
South America.13
And further buttressing the refiners’ position in this setting,
mountain ranges effectively isolate the West Coast refining
market, which refiners in California dominate, from other U.S.
refining districts.14
Refiners here export globally. They export transportation fuels
mainly to other West Coast states and eastern Pacific nations, and
industrial fuels mainly across the Pacific to nations such as Japan,
China and India.14,15 They exported 20–33 % of all the fuels they
produced from 2013–2017. The 33 % figure accounts for jet fuel
burned in cross-border flights.1 (See also page 93.)
– 12 – – 13 –DECODING THE PETROLEUM FUEL CHAIN IN CALIFORNIA DECODING THE PETROLEUM FUEL CHAIN IN CALIFORNIA
The reach of the fuel chain anchored by oil refining here is
growing. Foreign crude imports have grown as crude supplies
from California and Alaska dwindle,16 and foreign exports
of refined fuels have
grown when West Coast
The environmental footprint of fuels demand declined.17
California’s oil sector is driven Refineries in California
by the quantity and quality of oil imported ≈ 71.2 million
refined in the state. barrels (≈ 19 %) more crude
from other states and nations
and exported 1.20–1.53 billion gallons (17–22 %) more refined
fuels to other states and nations in 2017 than in 2013.1
Oil refining makes crude oil useable. This is the essential link in
the middle of the petroleum fuel chain. Without refining, crude
could not be used in the transportation and industrial systems we
have now, and would not be extracted. The quantity of oil refined
is a critical driver of the fuel chain’s environmental footprint. But
not the only one: the quality of oil matters too, and that has much
to do with how refineries make crude oil into transportation fuels.
CARBON INTENSITY (CI)
Making engine fuels from denser, more contaminated crude takes
more work, which takes more energy. It increases the processing
and energy intensities of oil refining.18 Burning more fuel per
barrel for that energy, refiners emit more combustion pollutants.
(See how refineries work in the last chapter of this report for more
detailed background on this and other side effects of refining
lower quality oil.)
In fact, the quality of crude refined can affect refinery emissions
1. California oil imports by region of the world, 2013–2016. of carbon dioxide equivalents (CO2e) dramatically.18–24 Refining
Global extraction outside the state fed 66% of the 3.01 billion barrels of
crude oil refined in the state from 2013–2017.1,13
the densest crude feed on average, California refineries emit
– 14 – – 15 –DECODING THE PETROLEUM FUEL CHAIN IN CALIFORNIA DECODING THE PETROLEUM FUEL CHAIN IN CALIFORNIA
more CO2e, as measured in kilograms emitted per barrel of crude
refined, than those in any other major U.S. refining region.18,22–24
See Chart 2.
Notice that instead of the total mass in kilograms (kg), the CO2e
emission measurement used directly above is in kilograms per
barrel of oil (kg/b). This measures carbon intensity (CI): the
amount of climate emission caused by a given amount of activity
at a particular emission source. That’s useful in a couple of
ways. For one thing, it allows us to focus on emissions caused by
something else besides the volume of oil that is used—in this case
the quality of the oil used.
Refining relatively lower quality crude drove California refining
CI to a current 2013–2017 average of ≈ 59.3 kg/b.1 This far
exceeds the U.S. average from refining the less dense, better
quality current U.S. average crude feed (≈ 49.3 kg/b).1 But much 2. Oil feed quality predicts refinery carbon intensity.
higher CI is observed among individual refineries (≈ 79 kg/b)24 CI: carbon intensity (kg CO2e/b); refining carbon intensity is shown.
b: barrel (oil). PADD: Petroleum Administration Defense District.
and worst-case estimates for refining tar sands-derived oils can
Making engine fuels from lower quality oil requires more intensive
substantially exceed 100 kg/b.18,20 Current statewide refining CI
processing and more energy, burning more fuel and creating more CO2
falls within the range of potential future conditions. The same is in refining. The closeness of the observed data to the diagonal line in
true for extraction and refined fuels burning. the chart illustrates how closely oil feed quality predicted the refinery
carbon intensity (CI) observed. Data shown are from previous work by
The CI of extracting the oils refined in California (≈ 89.8 kg/b) CBE and the Union of Concerned Scientists.18,22–24
exceeds that of the current average U.S. crude feed (≈ 66.1 kg/b),1
but the extraction CIs of some potential future oil feeds could be
as high as ≈ 200 kg/b.1,20 Similarly, the end-use combustion CI CARBON INTENSITY AND FEED RATE DRIVE MASS EMISSIONS.
of California refinery fuels production (≈ 462 kg/b, 2013–2017)1 Refinery 1 fed 147,000 barrels of oil per day and emitted 11.3 million
could be lower or higher depending on how much dirty-burning kilograms of CO2e per day, or about 77 kg per barrel. Refinery 2 fed
144,000 b/d and emitted 8.5 million kg/d or ≈ 59 kg/b. Refinery 3
petroleum coke gets into the future fuels mix as a byproduct of
fed 254,000 b/d and emitted 12.3 million kg/d, or ≈ 48 kg/b. This
refining lower-quality, denser oil. example is based on actual data from three California refineries.
A second way this measurement is useful is that, when we know Refinery 1 emits much more than refinery 2, even though refineries 1
both CI (kg/b) and oil feed rate (barrels), we can know the total and 2 have nearly the same feed rate, because refinery 1 emits many
more kilograms per barrel—its carbon intensity is higher.
mass (kg) emitted and how much each of the two big drivers of
oil emissions here—the quantity and quality of oil used—affect Refinery 3 emits more than refinery 1, even though its carbon
intensity (kg/b) is lower, because refinery 3 processes many more
these emissions.
barrels of oil per day—its feed rate is higher.
– 16 – – 17 –DECODING THE PETROLEUM FUEL CHAIN IN CALIFORNIA DECODING THE PETROLEUM FUEL CHAIN IN CALIFORNIA
FOOTPRINT
Oil refined here emits all along the fuel chain, wherever it is
extracted and the refined fuels are burned. And because the
refiners can import more oil and export more fuels as in-state oil
extraction and refined fuels demand decline, the emissions are
not constrained by how much fuel Californians use or how much
oil the state keeps in the ground.
Emissions from the extraction of in-state and imported oil refined
here, refining the oil here, and burning the fuels produced by
this in-state refining both here and elsewhere define the emission
footprint of this fuel chain. This report estimates trajectories for
these petroleum fuel chain emissions—starting with the emissions
from oil refined in California summarized in Table 2.
California can boast some of the highest-quality data on the
petroleum footprint anywhere. This is especially true for CO2e
emissions since 2013, when the “compliance” phase of its carbon
trading began—and oil sector activity, which is seen as critical
economic data. Instead of reporting fuel chain emissions directly,
however, the state reports them in many categories and merges
them with other emissions in some of those categories. Data
reported this way must be separated out and then added up.1
And despite including emissions from power plant exports of
electricity the state imports, the state’s CO2e inventory excludes
emissions from extracting refiners’ oil imports and burning their
fuels exports.1, 25 Data gaps don’t explain the error: the state has
detailed oil import and use data.1 Its source- and fuel-specific CI
data must be applied to its oil import and fuels export volumes
to measure the wrongly excluded emissions.1 Finally, we use a
multi-year average, to better account for variability in electricity
generation emissions, as hydropower supply varies between wet
and dry years.1 For more detail see the Supporting Material.1
This analysis reveals huge petroleum fuel chain emissions. From
2013–2017 the extraction, refining and end-use in transport and
industry of oil refined in California emitted ≈ 1,840 Mt CO2e
– 18 – – 19 –DECODING THE PETROLEUM FUEL CHAIN IN CALIFORNIA DECODING THE PETROLEUM FUEL CHAIN IN CALIFORNIA
(Mt: Megaton; 1 million metric tons). By comparison, all other
activities in the state combined emitted ≈ 1,020 Mt CO2e from
2013–2017.1 Total CO2e emissions were ≈ 2,860 Mt. The 1,840
Mt from oil refined in California accounted for ≈ 64% of total
statewide emissions.
Extraction, refining, and refined fuels use account for approx-
imately 15%, 10%, and 75%, respectively, of these fuel chain
emissions—but the interdependence of these links in the
chain is the crucial point. Across the fuel chain, ≈ 64 % of CO2e
emitted within the state and ≈ 36 % emitted from the extraction
of imported oil and the combustion of exported refined fuels.1
Refining lower quality oil for export increased fuel chain emissions
by up to 60 %: Exporting up to one of each three barrels refined1
increased the oil volume across the fuel chain up to 150 % of what
it would be without exports. The fuel chain CI of using denser 3. California Energy Commission refinery oil imports forecast.
oil here (≈ 611 kg/b)1 is ≈ 107 % of that for the U.S. average crude barrel (oil): 42 U.S. gallons. Excerpted from a 2010 report by the
Commission.26 As in-state oil dwindles refiners maintain (shown) or
feed (≈ 566 kg/b).1 And 107 % of 150% is ≈ 160 %. The toxic increase (not shown) their oil feed rates by importing more and more oil.
impact is even more severe locally. The CI of refining denser oil
here is ≈ 120 % of that estimated for the lighter U.S. average feed.1
This fuel chain interdependence has another implication. Even if But instead of shrinking their fuel chain’s footprint here, refiners’
extraction and refining emissions could be fully captured, three- path-dependent reactions to these strategic disruptions threaten
quarters of the fuel chain emissions could still emit from burning further carbon lock-in. Across the West Coast17 and here in
refined fuels—unless one of the links in the chain breaks. the refining center that anchors its fuel chain,1,26 refiners have
increased production on increased oil imports and refined fuels
TRENDS exports. And as they sell their exports in more distant markets
that command
Current trends suggest that natural limits, and human responses
lower prices, The extraction, refining, and end-use in
to them, already affect the path of the petroleum fuel chain here.
they are seeking transportation and industry, of oil refined
Growth has reversed in the crude supply and market that refineries to expand their
in California were first built to tap. The extraction of in-state oil in California emitted more than 1.8 billion
infrastructure for
resources peaked in 1986 and has declined by half since then.16 metric tons of air pollution, nearly two-thirds
importing and
The use of finished petroleum products peaked on the West Coast refining price-
of total statewide emissions, from 2013–2017.
≈ 2010.17 For the first time in history, refiners supplied a smaller discounted lower
volume of finished petroleum products to the West Coast in the quality oil. Reviews of proposed projects revealed these crude-
decade ending in 2016 than they did in the decade before.17 switching plans across the state.23, 24
– 20 – – 21 –DECODING THE PETROLEUM FUEL CHAIN IN CALIFORNIA DECODING THE PETROLEUM FUEL CHAIN IN CALIFORNIA
Recurrent spills, fires, and explosions, and consequent efforts to
reduce their frequency and magnitude, forced frequent partial CATASTROPHIC PIPE RUPTURE AND FIRE
shutdowns at California refineries. Judging by U.S. Chemical Chevron refinery in Richmond, CA
Safety Board deployment priorities, refinery “incidents” here—a August 6, 2012
15,000 seek emergency room care
1999 fire in Avon,27 2012 fire in Richmond,28 2014 acid spill in
Martinez29 and 2015 explosion in Torrance30—ranked among the
worst industrial disasters in the nation. Workers were injured
and killed.27–29 Nearby communities were poisoned.28,30 Refinery
process equipment was damaged.27,28,30 And hazards that lead
to such disasters continued to arise frequently. For example,
breakdowns, emergency shutdowns, process upsets and planned
shutdowns to address hazards at five California refineries caused
significant flare emissions on 68 days in 2016.31 That’s a plant
average of once every 27 days.
The hazards manifest from processing flammable, corrosive Photo: Richmond Progressive Alliance
and toxic chemicals in huge volumes at high temperatures and
pressures, and from corporate cost-cutting on maintenance, on REFINERY WORKERS STRIKE FOR
staffing, and on cheaper but more hazardous process materials PLANT SAFETY
and feedstocks. Martinez, CA 2015.
Oil refining is inherently hazardous. Severe process conditions
wear parts fast. Periodic inspections and repairs are crucial to
forestall the next disaster—and simply to keep refining oil. Such
maintenance shutdown turnarounds (see Plant ‘turnaround’ box
on page 24) continued to occur each Spring and Fall.
Continued oil use has made healthy-to-breathe air unachievable.
Nearly 50 years after the U.S. Clean Air Act of 1970 saved lives
by spurring a massive effort to capture pollutants from burning
fossil fuels before they emit from smoke stacks and tailpipes, it’s
time to ask if this captures enough pollution. It does not. Some
toxic combustion products inevitably escape capture.32
Along with each Mt of CO2e, from 2013–2017 total fuel chain
emissions from oil refined in California included ≈ 75.9 metric
tons (t) of particulate matter (PM2.5), ≈ 2,110 t of nitrogen oxides
(NOx) and ≈ 58.6 t of sulfur oxides (SOx).1 Breathing these Photo: California Nurses Association
– 22 – – 23 –DECODING THE PETROLEUM FUEL CHAIN IN CALIFORNIA DECODING THE PETROLEUM FUEL CHAIN IN CALIFORNIA
emissions such as those from climate-related wildfires, and it
PLANT ‘TURNAROUND’
underestimates risks for vulnerable populations and for areas
Rebuilding, repairing, or even fully inspecting parts of a refinery for
needed repairs while it is running is a bit like trying to fix a car while
with more stagnant air conditions.
it’s driving down the road—probably impossible and certainly unsafe. Based on this estimate, PM2.5 co-emitted with the 1,840 Mt of
Refiners turn off and ‘park’ (shut down) that equipment, then CO2e emitted from extracting, refining, and end-use of oil refined
inspect and repair or rebuild it, then restart it. They call the planned
sequence of equipment shutdown–maintenance/rebuild–startup a
in California during 2013–20171 killed more than 8,000 people.
plant ‘turnaround.’ That’s on average everywhere. Closer to the stacks and tailpipes,
Turnaround: A planned, periodic, and temporary shut down of a which are concentrated in low-income California communities
refinery process unit or plant to perform maintenance, overhaul and
of color, it’s worse. People of color are disparately exposed
repair operations and to inspect, test, and replace process materials
and equipment. to the pollution from burning refined fuels in transportation
statewide.35 Within 2.5 miles of refineries, the health experts
found,34 mortality risk associated with refinery PM2.5 emissions is
pollutants and others continued to harm people’s health. For 8–12 times that in the Bay Area as a whole.
example, detailed work by the Bay Area Air Quality Management Brechin reports an example of the wealthy and privileged
District,33 and a confirming review of that work by independent choosing to build polluting industries elsewhere—across the
health experts34 estimated the population-level mortality risk Bay from their San Francisco Peninsula homes—as early as the
from chronic exposures to PM2.5. This report uses the lowest of
these estimates, ≈ 0.060113 premature deaths per t PM2.5 emitted
(≈ 4.563 d/Mt CO2e emitted).1 This estimate excludes health
risks from other toxic effects, other pollutants, and indirect
THEY COULD JUST SAY IT’S INHERENTLY POLLUTING.
“Most modern combustion systems produce low concentrations of
criteria and toxic pollutants at individual emission points while
emitting large volumes of air and the end-products of combustion
(carbon dioxide and water). This makes traditional ‘end-of-pipe’
air pollution controls very expensive due to the relatively small
mass of NOx or PM2.5 when compared to the large mass of air,
water and CO2. While the the concentrations may be low at each
emission point, the high volume and large number of sources can
add up to significant criteria pollution, and to a lesser extent toxic
air contaminants, in the atmosphere. Any reduction of fuel use
will result in emission reductions of these compounds ... reducing
fuel consumption, all of the air pollution by-products of fuel
burning are also reduced: criteria, climate and toxic pollutants.”
Bay Area Air Quality Management District refinery strategy report.32
– 24 – – 25 –DECODING THE PETROLEUM FUEL CHAIN IN CALIFORNIA DECODING THE PETROLEUM FUEL CHAIN IN CALIFORNIA
1800s.36 By 2010 refineries accounted for 93% of the disparity
in particulate emission burdens between people of color and
non-Hispanic whites caused by all industries in the state cap-and-
trade scheme combined.37 New extraction projects are banned
in state waters near the wealthier coast but are still permitted
where drilling is concentrated, in communities of color and low
income around Kern County and in Wilmington.38 Diesel trucks
are routed mainly through low-income communities of color
along I-880 in Oakland instead of I-580 in the wealthier and
whiter Oakland hills, and through Southeast Los Angeles and a
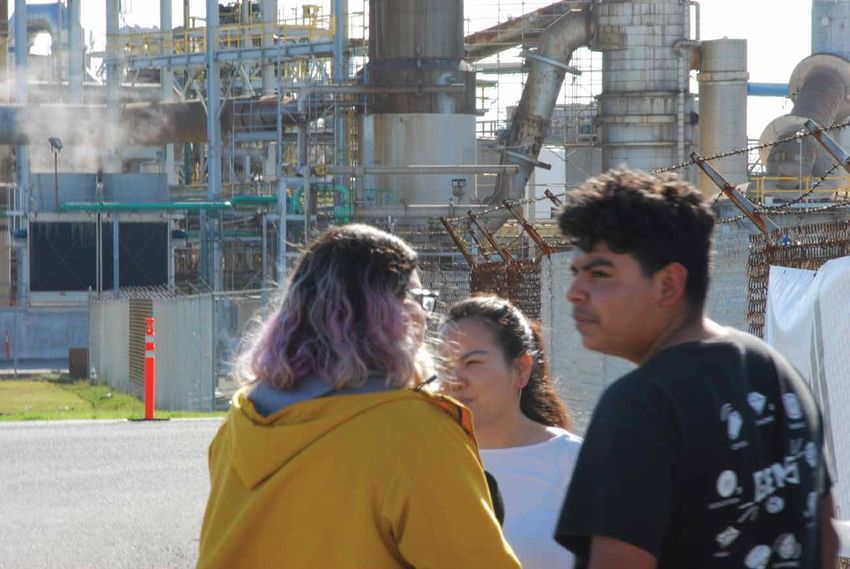
Wilmington on an expanding I-710 instead of I-405 to the west. 4A. Community demographics by race in Wilmington, CA.
Statewide and in general, major oil infrastructure grew where
communities had less say, not where communities had more say.
Communities that host refineries are rising to organize for more
say. Grassroots efforts stopped, slowed, or downsized oil refining
expansions in Santa Fe Springs (2002), Richmond (2009 and
2014), Benicia (2013–2016), Rodeo (2013–2020), Nipomo (2014–
2017), Wilmington/Carson (2016–2019), and elsewhere. And,
seeing more of the wider threat in the “bomb trains” that would
feed oil to some of these expansions, communities across the state
began to join in stopping them. Instead of the massive switch to
refining high-carbon Canadian tar sands oil in California that the 4B. Community demographics by race in Richmond, CA.
a
industry had pushed for since 2007,23 by 2017 Canadian heavy
crude imports were held to only ≈ 1.4 % of total crude refined
statewide.1,39
In these ways human responses to the inherent hazards of oil
have limited the geography of major oil infrastructure within
California and have begun to limit its growth.
But statewide from 2013–2017, as non-petroleum emissions
began to decrease, petroleum fuel chain emissions increased.
See Table 2 (p.19).
a
4C. Community demographics by race in Oakland, CA.
a
Hispanic whites are included only in the Latino/Hispanic count to avoid
double-counting. Data from the 2010 U.S. Census.
– 26 – – 27 –Photo: CBE
2. WHY MUST OIL REFINERIES BE DECOMMISSIONED?
All known paths to climate stabilization cut petroleum use.3,4,40–43
In California, where refiners import oil to export refined fuels,1
this means refining less oil here. We can. Proven, economically
feasible alternatives can replace enough oil-based transport fuels
to stabilize our climate.3 We can retire and replace the energy
function of refining capacity—we can decommission refining
capacity here. And to meet the state’s climate limit, we must.
Proof of this need starts with two facts. Persistent pollutants
build up in our environment over time. And when this pollution
buildup exceeds a critical natural limit, its impacts on us become
irreversible. Thus cumulative emission, rather than the emission
rate in any one year, is driving anthropogenic climate forcing.40–42
And—although they do not express this cumulative emission
limit directly—California’s climate emission targets for 2020,
2030, and 2050 are based on these facts.
– 29 –WHY MUST OIL REFINERIES BE DECOMMISSIONED? WHY MUST OIL REFINERIES BE DECOMMISSIONED?
Chart 5 illustrates an example for one plausible path to 2050 in
California: no change in the feed rate volume or carbon intensity
of oil, assuming steady cuts in all other non-petroleum emissions
to their share of the state’s 2050 climate limit. The buildup of
cumulative emissions over time is shown in Gigatons (Gt):
billions of metric tons. The solid black rising curve shows total
statewide emissions, including petroleum fuel chain emissions
and, below the dashed curve, all other non-petroleum emissions.
As shown, the total emissions
(solid curve) rise far above
Refineries must cut feed rates—
the climate limit (red line).
process less oil—to achieve
California’s climate and health In other words, even if we do
protection goals. everything else, and also stop
the carbon intensity of oil
from increasing, emissions
from the petroleum fuel chain will exceed the state’s climate limit 5. Example of cumulative emission without oil feed rate cuts,
unless we cut its oil feed rate. assuming steady progress to California’s 2050 climate limit
by all other (non-petroleum) emissions.
CLIMATE LIMIT Gt: Gigaton; 1 billion metric tons. CO2e: carbon dioxide equivalents.
Emissions from oil refined in California could cause total cumulative
This climate limit represents the state’s share of global emission
emission (black line) to irreversibly exceed the state’s 2050 climate limit
cuts by mid-century that give us all a 67 % chance of holding the (red line) even if all other emissions (dashed line) meet state climate
increase in global average temperature to between 1.5ºC and 2ºC targets. The example shown assumes no change in the feed rate or
above pre-industrial levels with medium confidence.1 carbon intensity of oil (Scenario S1 without oil feed rate cuts).1
That’s close to but not quite as good as the goal agreed by the
world’s nations at Paris in 2015—to hold this increase to well
up. If cumulative emissions exceed it—as illustrated by the black
below 2ºC and pursue efforts to limit it to 1.5ºC. Deeper cuts
curve crossing the red line in Chart 5—the impacts of that CO2e
could be needed here for a better than 67 % chance, for achieving
buildup could be irreversible.40, 42
1.5ºC, for California’s per capita share of effort, or if unproven
and limited carbon sequestration technologies cannot get us the California’s climate targets through 2050 define its climate limit.1
rest of the way to “carbon neutrality” for climate stabilization.1 The targets seek continuous, proportionate annual emission cuts
Cuts to the state’s 2050 climate limit are the minimum need. during three periods: first, back to the emission rate in 1990 by
2020, then 40% below the 1990 rate by 2030, then 80% below
Cumulative emissions must be limited because CO2e builds up in
the 1990 rate by 2050.44 Now that we are close to the first, 2020,
the atmosphere over time to cause climate impacts for centuries.
target, and have reliable actual emission data from 2013–2017,1
The cumulative limit is a budget that ongoing emissions can use
we are looking at the proportionate annual cuts to the 2030 and
– 30 – – 31 –You can also read