Australia's grain supply chains - Costs, risks and opportunities

Page created by Lee Watkins
 
CONTINUE READING
Australia's grain supply chains - Costs, risks and opportunities
Australia’s grain
                      supply chains
                        Costs, risks and opportunities
           Department of
           Primary Industries and
                   Department of

                                                                                        aegic.org.au
           Regional Development
                  Primary Industries and
                  Regional Development

AEGIC is an initiative of the Western Australian State Government and
     AEGIC
Australia’s    is an
            Grains     initiative
                    Research        of the Western
                              and Development           Australian State
                                               Corporation                 Government
     and Grains Research & Development Corporation
Australia's grain supply chains - Costs, risks and opportunities
Acknowledgements                                                                                                                          Contents
          We gratefully acknowledge the many people who have contributed to this report right from the early                                    Acronyms........................................................................................................................... 4
          scoping of the study, to provision of data, discussion and feedback on various drafts and through to edit                             Abbreviations..................................................................................................................... 4
          and design of the final publication. We are particularly grateful to staff at Viterra, GrainFlow, GrainCorp,                          Foreword............................................................................................................................ 5
          CBH and Emerald Grain who have invested many hours engaging with the authors identifying errors                                       Recommendations.............................................................................................................. 6
          and omissions and generally improving the report. We also acknowledge the important contribution of                                   Key findings........................................................................................................................ 8
          Ms Tamara Alexander (nee Stretch) who contributed to this report directly by compiling and analysing
                                                                                                                                                Executive summary.......................................................................................................... 10
          new information and indirectly through her contribution as the lead author of the first edition of AEGIC’s
          Australian Supply Chain report published in 2014.                                                                                     Methodology..................................................................................................................... 14
                                                                                                                                                  Overview of Australia’s supply chains........................................................................... 14
          We acknowledge that the help provided does not constitute endorsement of the report’s content, findings,
                                                                                                                                                  Our approach................................................................................................................ 16
          or recommendations which are the responsibility of the authors.
                                                                                                                                                  Logic behind our approach............................................................................................ 16
          Please note                                                                                                                             Costs and charges......................................................................................................... 17
          1. 	For international comparisons, export and import values vary depending on exchange rates and the information                     Wheat production and export from Australia.................................................................... 22
               source.                                                                                                                            Location of cropping..................................................................................................... 22
          2. 	All units cited in this report are metric measurements. Of particular note, the unit tonnes is a metric tonne                      Grain production and export......................................................................................... 25
               (1000 kilograms).                                                                                                                  Production and export of wheat.................................................................................... 26
                                                                                                                                                  Export in containers...................................................................................................... 28
                                                                                                                                                  Structure of Australian grain handling and export systems........................................... 29
                                                                                                                                                  Regulation of grain exports........................................................................................... 35
                                                                                                                                                Grain storage.................................................................................................................... 38
    Authors                                                                                                                                       On-farm storage............................................................................................................ 38
                                                                                                                                                  Cost of farm storage..................................................................................................... 40
    Dr Peter White | Senior Projects Manager                                                                                                      Cost of receival and warehouse storage........................................................................ 41
    Dr Chris Carter | Economic Analyst                                                                                                            Financial performance................................................................................................... 44
                                                                                                                                                  Trends in grain storage on farms.................................................................................. 48
    Professor Ross Kingwell | Chief Economist                                                                                                   Freight.............................................................................................................................. 50
                                                                                                                                                  Rail............................................................................................................................... 50
                                                                                                                                                  Road............................................................................................................................. 53
                                                                                                                                                  Competitiveness of rail versus road.............................................................................. 54
                                                                                                                                                  Receival site efficiency.................................................................................................. 54
    Australian Export Grains Innovation Centre
                                                                                                                                                Ports and shipping........................................................................................................... 64
    3 Baron-Hay Court, South Perth, Western Australia 6151                                                                                        Grain port terminals...................................................................................................... 64
    P: +61 8 6168 9900 E: admin@aegic.org.au                                                                                                      Port regulation.............................................................................................................. 66
                                                                                                                                                  Port containerisation facilities....................................................................................... 69
    aegic.org.au                                                                                                                                  Trends in port terminal operations................................................................................ 70
                                                                                                                                                  Port terminal operational charges................................................................................. 71
                                                                                                                                                  CBH rebates.................................................................................................................. 73
                  Department of
                  Primary Industries and                                                                                                          Sea freight.................................................................................................................... 74
                  Regional Development
                                                                                                                                                Other costs....................................................................................................................... 76
                                                                                                                                                  Mandatory federal levies.............................................................................................. 76
    AEGIC is an initiative of the Western Australian State Government and                                                                         Mandatory state levies................................................................................................. 80
    Australia’s Grains Research and Development Corporation                                                                                       End point royalties........................................................................................................ 80
                                                                                                                                                  Organisational costs...................................................................................................... 81
                                                                                                                                                Emerging innovations and technologies within supply chains.......................................... 82
                                                                                                                                                Competitiveness of Australian supply chains.................................................................... 84
    October 2018
                                                                                                                                                  Costs of wheat production in Australia......................................................................... 84
    All contents copyright ©AEGIC. All rights reserved.                                                                                         Concluding remarks.......................................................................................................... 89
    The related bodies corporate, directors and employees of AEGIC accept no liability whatsoever for any injury, loss, claim, damage,          References........................................................................................................................ 90
    incidental or consequential damage, arising out of, or in any way connected with, the use of any information, or any, error, omission
    or defect in the information contained in this publication. Whilst every care has been taken in the preparation of this publication AEGIC
    accepts no liability for the accuracy of the information supplied.

    MIRP18002EN

2   Australia’s grain supply chains: Costs, risks and opportunities                                                                                                                                                       Australia’s grain supply chains: Costs, risks and opportunities   3
Australia's grain supply chains - Costs, risks and opportunities
Acronyms
                        ABS                    Australian Bureau of Statistics                                Foreword
                        ACCC                   Australian Competition and Consumer Commission
                        AEGIC                  Australian Export Grains Innovation Centre
                        AQIS                   Australian Quarantine and Inspection Service                         In 2014 AEGIC published the first of its supply chain reports on the cost of Australia’s bulk
                        CBH                    Co-operative Bulk Handling Ltd                                       wheat export supply chains. Substantial investment, reorganisation and regulatory change
                        CIF                    Cost, insurance and freight                                          was still occurring within the Australian grain industry in response to the removal of the
                        CFR                    Cost and freight                                                     single wheat marketing desk in 2008. The report described these changes as well as the
                        CSIRO                  Commonwealth Scientific and Industrial Research Organisation         structures and costs involved in the bulk export of wheat and showed that supply chain
                        DAWR                   Department of Agriculture and Water Resources
                                                                                                                    charges were the single largest cost item for a grain producer in a typical year.
                        EPPRD                  Emergency Plant Pest Response Deed
                        EPR                    End point royalty
                        FIS                    Free-in-store                                                  That report became widely cited by a range of organisations     International supply and demand for wheat has also
                        FOB                    Free-on-board                                                  in the commercial, regulatory, research and advocacy sectors    expanded rapidly over the past decade, providing market
                                                                                                              of the grain industry (as examples see: Brookfield, 2014;       opportunities and increased competition. Australian wheat
                        GRDC                   Grains Research and Development Corporation                    Morrison, 2014; DAWR, 2014; GrainCorp, 2015; ACCC, 2016;        production in 2016-17 reached record levels, allowing higher
                        GTA                    Grain Trade Australia                                          Kalisch Gordon, 2016; Kingwell, 2017). The report provided      volumes of exports that tested the capacity of Australia’s
                                                                                                              important background information to the SA government’s         storage and handling system.
                        NAT                    Newcastle Agri Terminal                                        inquiry into bulk grain export supply chain costs in SA         Low-cost grain producers in the Black Sea region and
                        NRS                    National Residue Survey                                        (ESCOSA, 2017).                                                 Argentina have emerged as alternative sources of grain.
                        PHA                    Plant Health Australia                                         Reorganisation and new investment in Australian supply          Russia is now the world’s leading wheat exporter and has
                                                                                                              chains has continued since the 2014 report. Providers of        established strong competitive positions in Australia’s
                        RD&E                   Research, development and extension
                                                                                                              grain handling and export services have moved away from         traditional markets. Fortunately, accompanying this increased
                        SLA                    Statistical Local Area                                         auctions to allocate capacity at ports towards offering         supply has been the continued expansion of demand for
                        USDA                   United States Department of Agriculture                        long-term agreements. The ACCC administers the new Port         wheat in Asian countries caused by growing populations,
                                                                                                              Terminal Access regulations and continues to lighten controls   rising incomes and changing consumer preferences.
                                                                                                              by granting exemptions. There have been ongoing reductions      This report responds to calls from grower organisations,
                                                                                                              in the number of upcountry receival sites operated by the       representatives of trading companies and government
                                                                                                              main grain handling and storage service providers and           agencies for an update of the 2014 study. Grain handling

                 Abbreviations                                                                                many farmers continue to increase their on-farm storage.
                                                                                                              Rail regeneration programs have been implemented in Vic
                                                                                                              and NSW, while some rail lines have been closed in SA and
                                                                                                                                                                              service providers were consulted during its preparation and
                                                                                                                                                                              provided useful information and feedback. We have updated
                                                                                                                                                                              our analysis of wheat supply chains to describe the current
                                                                                                              WA. New port developments and commercial agreements             structures and costs and asked how well they serve Australian
                                                                                                              have significantly increased port loading capacities in WA,     farmers striving to compete against low-cost producers
                        Aus                    Australia                                                      NSW and SA. Road maintenance and road and highway               while meeting the quality preferences of an increasingly
                                                                                                              upgrades have occurred to facilitate use of higher capacity
                        Can                    Canada                                                         trucks. Containerisation continues to be a significant export
                                                                                                                                                                              discerning Asian market. This report aims to provide a better
                                                                                                                                                                              understanding of the factors affecting the nature and costs of
                        ha                     hectare                                                        avenue for wheat, especially in NSW and Vic, offering new       export grain supply chains in Australia. We also look beyond
                        km                     kilometre                                                      opportunities to meet the changing demands of customers.        the current situation to consider how supply chains might
                        mmt                    million metric tonnes                                                                                                          evolve to embrace emerging and future opportunities while
                                                                                                                                                                              also being affected by technological change.
                        mt                     metric tonnes
                        t                      tonnes
                        NSW                    New South Wales
                        SA                     South Australia
                        Qld                    Queensland
                        Ukr                    Ukraine
                        US                     United States of America
                        Vic                    Victoria                                                                                      View AEGIC’s past reports
                        WA                     Western Australia

4   Australia’s grain supply chains: Costs, risks and opportunities                                                                                                                Australia’s grain supply chains: Costs, risks and opportunities   5
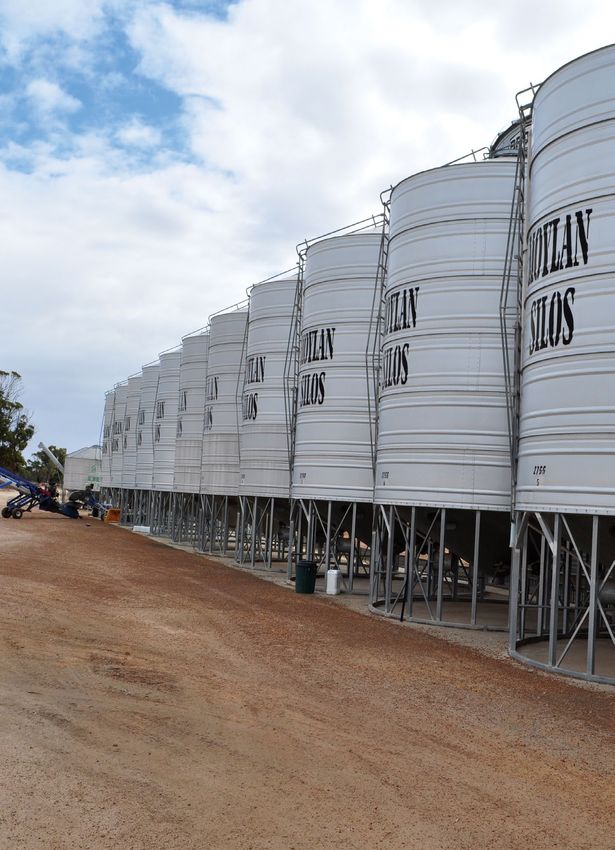
Australia's grain supply chains - Costs, risks and opportunities
Recommendations
            Since 2014 AEGIC has analysed the supply chains of several competitors
            to the Australian grains industry (Canada, Ukraine, Russia and Argentina).
            The recommendations below draw on this research in addition to
            the review of the 2017 grain supply chains presented here. These
            recommendations identify important areas of reform that are likely to
            produce enduring benefits to the Australian grains supply chain.

           Ensure least-cost grain paths are                          Align wheat breeding, varietal                  Ensure there are sufficient incentives          Supply chain owners should consider
           developed and maintained                                   classification, grain assessment                for R&D investment to improve the cost-         making the basis of component charges
                                                                      systems and grain handling to support           efficiency of supply chains                     clearer, to increase confidence in
           First, better coordinate road regulation,
                                                                      the export of Australian wheat to                                                               supply chains and improve perceptions
           planning and investment in roads to                                                                        Technological improvements that lead
                                                                      differentiated, premium markets                                                                 of fairness
           facilitate effective planning and investment                                                               to productivity improvements and
           by grain supply chain owners and                           Wheat exports from Australia and domestic       reduced supply chain costs are important        Greater transparency regarding the
           operators. Second, proactively maintain                    marketing are likely to involve greater         mechanisms to increase the competitiveness      basis of component charges — including
           vigilance over least-cost grain pathways                   segregation, especially as on-farm storage      of Australian supply chains. Whether existing   infrastructure use and efficiencies — could
           to prevent encroachment of incompatible                    increases. Hence, it is vital that all          providers of supply chain services have         become a point of competitive advantage
           urban development leading to future                        stakeholders (breeders, varietal classifiers,   sufficient incentives to commit funds to R&D    and a pathway to lessened regulation
           conflict and contest over land use.                        grain handlers) have incentives that align      that may yield valuable outcomes requires       and associated costs. Information can be
           Australia’s population continues to expand                 to deliver the types of Australian wheat        further examination.                            provided to an independent third party to
           and become increasingly urbanised,                         most preferred in differentiated, premium                                                       maintain commercial sensitivity.
           so there is a risk to freight access and                   markets.
           maintenance of operational flexibility of
           some port terminals. Planning, zoning,
           regulation and development decisions
           affecting freight corridors, port access and
           grain terminal operations require careful
           ongoing oversight. The cost of failure over
           this issue, at all levels of government,
           could be high in real terms for growers and
           users of the supply chains.

6   Australia’s grain supply chains: Costs, risks and opportunities                                                                                                   Australia’s grain supply chains: Costs, risks and opportunities   7
Australia's grain supply chains - Costs, risks and opportunities
Key findings
                  Costs stable                                                                                          Grain quality
                  Despite major investments by many stakeholders, the real costs to users of most export grain          Stewardship of grain quality is an important consideration for the Australian industry as
                  supply chains in Australia have remained stable or slightly decreased, compared to the situation in   the range of grain storage options and pathways to markets increase. The Australian grain
                  2014. There are differences between states in the effective cost to grain producers of supply chain   industry needs to consider how to best ensure stewardship obligations are understood,
                  services (see sections on Supply chain operations: Financial performance indicators – page 44 and     accepted and maintained throughout the industry (see section on On-farm storage – page 38).
                  Trends in port terminal operations – page 70).
                                                                                                                        Containerised exports
                  Costlier than most                                                                                    About 10 per cent of Australia’s export wheat is in containers. About half of these
                  Australian supply chain costs are higher than most of its competitors, except for Canada. Transport   containerised wheat exports are from Victoria (see sections on Export in containers – page 28
                  from upcountry receival sites to port and port charges are generally the highest components of        and Port containerisation facilities – page 69).
                  supply chain costs (see sections on Costs and charges – page 17 and Competitiveness of Australian
                  supply chains – page 84).                                                                             Excess port capacity
                                                                                                                        Excess port terminal capacity is prevalent in some locations in eastern Australia (see sections
                  Regulation                                                                                            on Structure of Australian grain handling and export systems – page 29 and Grain port
                  Regulation of wheat exports has been a requirement for transitioning out of the single wheat          terminals – page 64).
                  marketing desk but has reduced flexibility for providers of bulk handling services, imposing
                  additional costs on users of the bulk handling system, and caused some confusion among                Eastern states complexity
                  customers for Australia’s wheat. Tensions remain within the industry about the need for regulation    Pathways for transporting grain in NSW, Vic and Qld are multidirectional, servicing domestic
                  (see sections on Regulation of grain exports – page 35 and Port regulation – page 66).                and export markets, and requiring a different network structure to the port-based grain
                                                                                                                        catchments of WA and SA. When combined with large annual variations in grain exports,
                  Code of conduct                                                                                       greater competition and a higher proportion of exports in containers, infrastructure planning
                  Moving to a voluntary code of conduct under general competition law, including sufficient             and supply chain investment on the east coast becomes complex (see sections on Wheat
                  transparency and monitoring, may assist Australian supply chains to develop the flexibility           production and export from Australia – page 22 and Freight – page 50).
                  required to meet future challenges from increasingly competitive low-cost wheat exporters in the
                  Black Sea region and Argentina (see sections on Port regulation – page 66 and Competitiveness of      Business transparency
                  Australian supply chains – page 84).                                                                  The reporting of business segment performance of the main companies providing supply
                                                                                                                        chain services is sometimes poorly enunciated. Greater transparency in reporting will build
                  Long-term freight planning                                                                            trust in service providers (see sections on Regulation of grain exports – page 35 and
                  Coordinated long-term planning for high-capacity freight corridors to avoid conflict with urban       Port regulation – page 66).
                  development will be an important ongoing requirement to continue to progress and capture the
                  benefits of improved efficiency of grain road freight (see sections on Freight – page 50 and          Costs can be reduced
                  Port regulation – page 66).                                                                           Reducing Australia’s supply chain costs is feasible and imperative, through synergistic
                                                                                                                        infrastructure investments and emerging innovations involving automation, information
                  Location                                                                                              technologies and organisational change (see section on Emerging innovations and
                  Spatial change in grain production, improvements in harvest technology and seasonal volatility        technologies within supply chains – page 82).
                  are affecting the nature and cost of Australia’s export grain supply chains. Low-yielding locations
                  distant from port are likely to become increasingly expensive relative to high-yielding locations     Costs need to be reduced
                  near to port (see section on Wheat production and export from Australia – page 22).                   Impetus for greater cost-efficiency in Australia’s grain supply chains arises from Australia’s
                                                                                                                        grain export competitors who are undertaking major investments in their supply chains. These
                  Farm storage                                                                                          investments, when combined with attractive sea freight rates, have enlarged the reach of
                  Increased farm storage capacity, particularly in eastern Australia, is changing the demand for        grain from low-cost competitors such as the Black Sea and Argentina (see sections Sea freight
                  upcountry commercial storage of grain. This is affecting scale efficiencies for service providers     – page 74 and Competitiveness of Australian supply chains – page 84).
                  and stimulating the restructure of commercial storage networks (see sections on Grain storage –
                  page 38 and Trends in port terminal operations – page 70).

                                                                                                                        Image courtesy: GRDC
8   Australia’s grain supply chains: Costs, risks and opportunities                                                                                                                      Australia’s grain supply chains: Costs, risks and opportunities   9
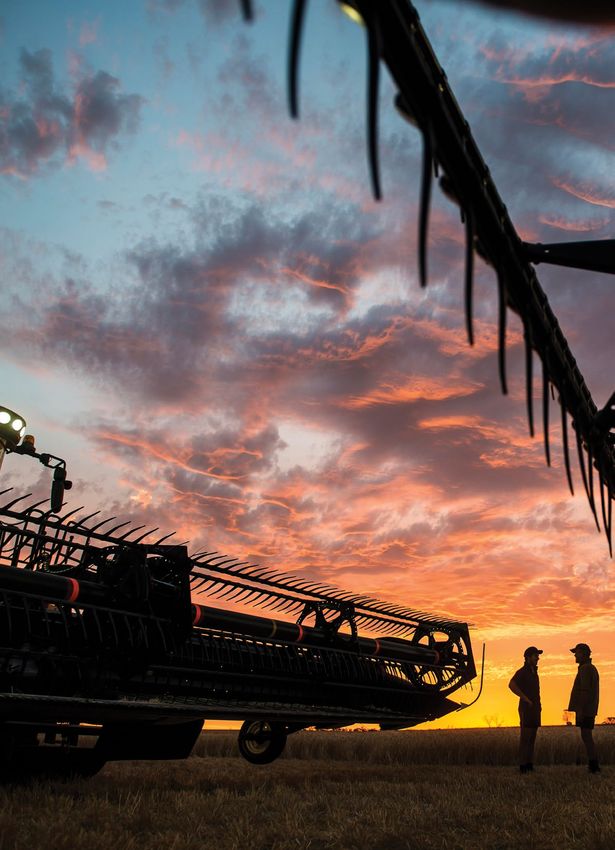
Australia's grain supply chains - Costs, risks and opportunities
Executive summary
            This report examines recent changes to the nature and cost of export grain supply chains in
            Australia. Since AEGIC’s review of Australia’s export grain supply chains in 2014, substantial
            investment in many of those supply chains has occurred, along with mostly beneficial
            regulatory change. Accompanying these changes have been other trends in improved
            harvest technologies — a gradual unfolding of climate change, and agronomic improvements
            — all of which additionally impact on supply chain costs.

     In compiling this report, we have used consultants and              Across many sites, the real costs of export grain supply
     industry experts to assist us. We have also requested               chains, compared to the situation in 2014, have remained
     contributions from industry participants on particular topics.      stable or slightly decreased. However, the direction and
     We appreciate and have valued the supply chain service              degree of changes in the costs of using supply chain services
     providers who have helped ensure, wherever possible, that           differ between sites and between states. For example,
     information in this report is accurate and relevant.                Co-operative Bulk Handling (CBH)’s rebate of charges to
     The costs of Australia’s export grain supply chains are affected    growers who use its facilities has reduced the effective costs
     by seasonal variability in grain production, and increasingly by    of most Western Australian growers’ supply chains over the
     shifting climate patterns. The volatility and change in climate     past two years.
     affect the spatial distribution of crop production, which in turn   Wheat represents 60 per cent of the value of grain exported        Old and new grain receival and loading infrastructure in southern NSW.
     affects export grain supply chains. Increased crop intensity        from Australia over the past 10 years. WA is Australia’s largest
     and greater absolute increases in grain yields are occurring        wheat exporting state, exporting 6.9 million metric tonnes
     in higher rainfall zones. By contrast, reduced cropping and         (mmt) of wheat per annum, on average, from 2006 to 2016 (or
     constrained yield advancement characterise some low rainfall        over 50 per cent of Australia’s wheat exports). During 2012-16,
     locations often distant from port.                                  canola exports have increased in importance, becoming 16           In 2014 there were 623 receival sites in Australia yet by 2016     Industry experts estimate that over the past five years the
     This report examines three supply chain structures,                 per cent of the value of all grain exports. Unsurprisingly, WA     the number had declined substantially such that the major          amount of grain stored in good-quality steel silos in NSW, Qld
     representing how most Australian grain is exported. These           ports feature among the top-ranked ports for grain export,         commercial grain handlers now retain fewer than 480 sites —        and Vic has doubled. Significant amounts of grain have moved
     structures all end with grain being loaded onto a ship. The         with Kwinana being by far the top-ranked port, exporting           and many of these are rarely used and destined for closure         from temporary, or poor quality, shed storage into higher
     three options are: (i) traditional, where a farmer delivers         almost 5mmt of all grain annually. After WA, SA is the next        over the next decade. Many sites now only open in years with       quality facilities that can be gas-sealed, fumigated or aerated.
     harvested grain to a local receival site owned by a bulk            largest wheat exporter, with an average 2.6mmt of wheat            large harvests. For example, in SA, 80 per cent of the grain       More than 80 per cent of an average harvest can now be
     handler. This grain is aggregated at port; (ii) direct, where       exports, contributing 18 per cent of Australia’s average wheat     was received in only about 30 sites in 2016, while in WA, in       placed in permanent storage on-farm in these states. On-farm
     harvested grain is delivered by a farmer directly to port; and      exports. WA also has the most wheat-dominant export trade          the bumper 2016 harvest, 76 of the 178 sites were designated       storage in SA and WA is much less, but continues to grow,
     (iii) on-farm, where grain is first placed into on-farm storage     with about 80 per cent of its grain exports being wheat. This      as surge sites. Across the Australian network of receival sites,   albeit at a slower pace. About 240,000t of permanent storage
     rather than local storage and then is eventually shipped out.       compares to about 40 per cent for Qld and about 50-60 per          227 are classified as primary sites.                               have been added annually in WA over the past few years and
     These three structures are examined against the backdrop            cent for the other states.                                                                                                            more than 30 per cent of an average harvest can be stored
                                                                                                                                            Rail regeneration programs have been implemented in Vic
     of 12 farm locations selected to represent the geographical         Victoria exports the most wheat in containers, accounting for      and NSW, while some rail lines have been closed in SA and          on-farm in either permanent or short-term storage. Hence,
     spread of grain production and the resulting flows of grain to      about half of all containerised wheat exports from Australia       WA. New port developments and commercial agreements                despite the major grain handlers closing some receival sites,
     export. Because wheat remains by far the main grain exported        since 2010. Similarly, over this period, about 51 per cent         have further increased port loading capacities in WA, NSW and      the total capacity to store grain has increased across Australia
     from Australia, the cost estimates of the various supply chains     of Victoria’s total wheat exports have been in containers          SA. Road maintenance and road and highway upgrades have            due to farmers’ increased investment in on-farm storage, and
     are based on wheat.                                                 compared to 30 per cent and 37 per cent for Qld and NSW            occurred, facilitating use of higher capacity trucks.              upgrades to service providers storage at strategic sites.
     There is a wide range in the costs of export grain supply           respectively; and less than 4 per cent for WA and SA.                                                                                 On a per tonne basis, the cost of using smaller on-farm
                                                                                                                                            Grain Trade Australia (GTA) has around 200 ordinary grain
     chains in Australia with many factors contributing to the           Since AEGIC’s previous report in 2014, there have been             trading company members. Of these, the top six companies           storage is usually more than the cost of the service provided
     costliness of each supply chain. Key influences on costs            ongoing reductions in the number of upcountry receival sites       are responsible for about 80 per cent of the wheat exports         by large commercial grain handlers. Large-scale, high-quality
     include distance to port, efficiency of receival and storage,       operated by the main companies providing grain handling            from Australia. CBH is the largest, exporting about 30 per         farm storage can be less costly than several commercial
     duration of storage, type of haulage, ease of ship loading and      services and many farmers continue to increase their on-           cent of Australia’s wheat followed by Glencore with a 17 per       warehouse service providers, though does not include the risk
     time of shipping. For the sites considered, when traditional        farm storage, in spite of its greater cost compared to many        cent share. The dominant wheat exporters are also integrated       management services bundled into the commercial storage
     export occurs – whereby the farmer delivers harvested grain         commercial warehousing opportunities. The major service            marketing and bulk handling companies.                             cost. Hence, depending on the type of farm storage and the
     to a local receival site owned by a bulk handler and then the       providers are concentrating their businesses around high-                                                                             nature of the commercial warehouse service provider, the
     grain is aggregated and loaded onto a ship – supply chain           capacity, efficient and strategic sites and have undertaken        Since the deregulation of wheat marketing in 2008, Australia’s     trend towards increased investment in farm storage can either
     costs vary from $56/t to $110/t. In most cases, the freight to      major investments in their networks and operations to              major bulk handlers are all now agribusiness companies             increase or decrease a farmer’s supply chain costs. This trend
     port is the major component of the supply chain’s total cost.       maintain and improve their fitness for purpose and to deliver      offering integrated marketing and grain handling services.         comes with an increased risk to growers from adverse events
                                                                         business efficiencies. The net outcome of these investments        Four of the six major integrated marketing and grain handling      when storing grain on-farm, as the risk is not transferred to
                                                                         has been little alteration in the costing of these network         companies (representing nearly 60 per cent of total wheat          a commercial service provider. What is apparent is that farm
                                                                         services.                                                          exports) are foreign-owned.

10   Australia’s grain supply chains: Costs, risks and opportunities                                                                                                                                                 Australia’s grain supply chains: Costs, risks and opportunities   11
Australia's grain supply chains - Costs, risks and opportunities
storage does facilitate harvest logistics and helps underpin         In contrast to the quality of its road infrastructure, Australia’s                                                                      The main operating costs for grain storage and handling,
     flexibility in targeted grain marketing, from which many             railroad infrastructure ranks very poorly compared with that             Greater transparency could                                     transport and port terminal services are labour, safety
     farmers derive commercial advantages.                                of most of its major grain export competitors. Australia sits            become a point of competitive                                  and energy costs. Accordingly, any innovation that reliably
                                                                                                                                                                                                                  and cost-effectively reduces these key costs is likely to
     Due to opaqueness in the financial reporting of Australia’s          at 35th — on par with Ukraine (37) but well behind France
     major grain handlers and marketing agribusinesses, it is not         (5), the US (10), Canada (16) and Russia (23). The only                  advantage for the industry and                                 be embraced by these service providers. Illustrations of
                                                                          competitor that ranks substantially lower than Australia is                                                                             automation likely to be more fully embraced within grain
     feasible to identify their profit centres and business segment
     cost structures. The exception is CBH. Its Storage and Handling      Argentina, positioned at 83rd, which, after decades of severe            a pathway to lower regulation.                                 supply chains include:
     Division accounts for three-quarters of CBH’s pre-tax profit and     underinvestment in its rail infrastructure, is now embarking
                                                                          on a staged renovation with an initial $2.8b spend on its                                                                               • driverless chaser bins that deliver grain from farmers’
     generates the largest profit margins of its business segments.                                                                                                                                                 fields to on-farm storage or grain trucks;
     Furthermore, due to CBH’s cooperative structure, this division       northern rail line, and this is well on the way to completion.
                                                                          The Argentinian government’s stated aim is a complete                Australia is geographically close to its primary markets for       • autonomous cartage of grain from upcountry bunkers to
     is tax-exempt, so this unit accounts for an even larger
                                                                          recovery of its freight network by 2035, when 20,000km               wheat and this provides a benefit to the industry through            adjacent rail loading facilities;
     percentage of after-tax profit. All other divisions are subject to
                                                                          of track will have been renewed. Much of the investment              reducing the cost of delivering grain to those markets. Since      • grain rail wagons that automatically load and unload
     company taxation.
                                                                          involves private-public partnerships.                                early 2016, there has been a lift in sea freight rates. Combined
     Over the five years to September 2017, CBH profit margins in                                                                              with the decline in real prices of grain, this increase has        • driverless shuttle trains;
     storage and handling (before applying rebates) have ranged           Australia has 18 ports mostly located within 400km of
                                                                                                                                               meant that sea freight as a share of calculated cost, insurance    • greater automation of grain receival and grain quality
     from 15 per cent to 33 per cent and grain receivals have             production areas and often with just one, or sometimes two,
                                                                                                                                               and freight (CIF) values has risen. If shipping rates climb          assessment; and
     ranged from 9mmt to almost 17mmt. CBH has distributed                major port terminal service providers. The average distance
                                                                                                                                               further in 2018, then the advantages of geographical proximity     • fully automated grain container port operations.
     an increasing proportion of its income as rebates. By driving        to port from upcountry receival sites is about 250km (longer
                                                                                                                                               to major wheat customers become more forceful. This would
     down costs in its Storage and Handling Division, CBH remains         in NSW and shorter in SA). Most ports have a significant
                                                                                                                                               bestow further advantages to EU and Black Sea wheat being          A fundamental issue affecting the development of innovations
     competitive against new entrants into grain storage and              catchment area where road transport costs are competitive
                                                                                                                                               exported to northern African and Middle East markets. South-       and technologies applicable to grain supply chains is whether
     handling in WA.                                                      with rail costs.
                                                                                                                                               East Asian markets would be more commercially attractive           existing providers of supply chain services have sufficient
     In international competitiveness rankings, the quality of            Many port terminals are operated by dominant incumbent               to Australian suppliers, and North Asian markets would             incentives to commit funds to R&D that may yield valuable
     Australia’s road infrastructure ranks 35th in the world, the         grain handlers who since deregulation have developed                 become more attractive to Canadian and Pacific north-west          outcomes. This important issue deserves a separate review.
     same as its ranking for the quality of its rail infrastructure.      or enlarged their marketing arms. The business segment               US wheat marketers. While a higher freight price may lead to       Australia, by international comparison, already has relatively
     Australia’s road infrastructure ranking is considerably higher       performance of these large firms is increasingly opaque. The         some insulation for Australia from competition in South-East       expensive supply chains. Developing and applying innovations
     than that of several of its main grain export competitors —          Australian Competition and Consumer Commission (ACCC) is             Asia, the likelihood of seeing conditions that would lead to       and technologies is one way of reducing the expense of
     Argentina (96), Russia (114) and Ukraine (133) — although still      of the view that it is important to monitor the practices and        a continued strong uplift in sea freight rates is low, at least    supply chains. A corollary is the need to ask: Are there
     behind France (7), the US (10) and Canada (22).                      competitive environment of these incumbents and not just             in the foreseeable future. Moreover, and more importantly,         sufficient incentives for R&D investment to improve the cost-
                                                                          report on their port operations (ACCC, 2018).                        despite the possible changes in sea freight costs, Black Sea       efficiency of supply chains? In this report, we recommend that
     Australia’s road quality ranking could be higher if investments
                                                                          Tensions remain within the industry about the need for               wheat will remain preferred in some of Australia’s key, price-     this question be answered. If impediments to R&D investment
     in regional road infrastructure were better coordinated, with
                                                                          the current port access regulations. Supply chain owners             conscious, South-East Asian markets due to its lower costs of      in supply chains can be identified, then policy or institutional
     a greater emphasis on economic prioritisation. Unfortunately,
                                                                          should consider making their component costs, charges                production and cost-efficient supply chains.                       changes need to occur to address any such impediments.
     road investments have often been more linked to political
     rather than strategic economic imperatives. Consequently,            and performance metrics visible across the supply chain to           Innovation in shipping and associated support services is          In summary, since 2014, despite the endeavours of supply
     often these investments are not the most efficient means to          increase confidence in supply chains and improve perceptions         likely to eventually place downward pressure on sea freight        chain owners and operators, the real costs of many export
     deliver lasting low-cost grain paths.                                of fairness. This information can, as in the Canadian system,        rates. Improvements to engines, better propeller performance       grain supply chains in Australia have remained stable or only
                                                                          be provided to an independent third party to maintain                and high-tech coatings, as well as friction-reducing air           slightly decreased. Importantly, there are differences between
                                                                          commercial sensitivity.                                              cushions and even skysails will reduce the fuel needs of ships     states in the effective cost to grain producers of supply chain
                                                                                                                                               in the future.                                                     services, with WA grain growers benefiting from CBH’s rebate
                                                                                                                                                                                                                  policy in the past two years.
                                                                                                                                                                                                                  What should concern the Australian export grain sector is the
                                                                                                                                                                                                                  high cost of its grain production and supply chains relative
                                                                                                                                                                                                                  to those of its emerging competitors. Moreover, significant
                                                                                                                                                                                                                  investments are underway in these competitors’ supply
                                                                                                                                                                                                                  chains that will further challenge the Australian industry. The
                                                                                                                                                                                                                  Australian export grain industry needs to carefully consider
                                                                                                                                                                                                                  how best to strategically respond to this ongoing competitive
                                                                                                                                                                                                                  challenge.

                                                                                                                                                                                                                  LEFT: Loading wheat into rail wagons at Oaklands,
                                                                                                                                                                                                                  southern NSW, for transport to port.

12   Australia’s grain supply chains: Costs, risks and opportunities                                                                                                                                                   Australia’s grain supply chains: Costs, risks and opportunities   13
Australia's grain supply chains - Costs, risks and opportunities
Methodology
                                                                                                                                                                      GRAIN PRODUCTION ON FARM

                                                                                                                                                                            Farm gate price

                                                                                                                                                                                          PLUS cartage from farm to
     Overview of Australia’s supply chains                                                                                                    TRUCK TO RECEIVAL POINT
                                                                                                                                                                                           upcountry receival point

            There is no single grain supply chain for Australia. Various supply chain options are
            available in all states, with grain being exported in bulk or containers through 25 port                                                                Silo return price or site price
            terminals spread around Australia’s coastline. Grain is delivered to each port via road
            or rail, or their combination.                                                                                                                                             PLUS receival, grain assessment
                                                                                                                                                                                              and storage costs

                                                                                                                                             HANDLE AND STORE GRAIN                      PLUS outturn to truck or rail
     The costs of using these modes can differ across regions and       Services such as managing pests, checking for contaminants,
                                                                                                                                                AT RECEIVAL POINT
     even within a region; and can be seasonally dependent. For         assessing and segregating grain based on its quality and so
     these reasons, the supply chain costs presented in this report     on, can protect or add to the value of Australian grain in the
     should be taken as being broadly representative rather than        market. It is simplistic thinking to view the components of a                                    Track price upcountry
     being fixed in nature or magnitude.                                supply chain as costs to be avoided or slashed. Rather, they
     The cost of a supply chain in this report is interpreted as        are a portfolio of services whose value proposition requires
     the difference between the free-on-board (FOB) price of the        regular review. With that important caveat, the nature and
     grain, net of production costs. That is, the cost that would be    cost of components of export grain supply chains across                                                               PLUS freight to port
     associated with storing grain after harvest and moving it from     Australia are described in the following sections.
     the farm onto a ship. An explanation of the pricing points is      This report also presents trends within various parts of           TRUCK OR RAIL GRAIN TO PORT
     presented in Figure 1.                                             export grain supply chains, and how those trends may affect
     This report also includes comment on the cost of shipping          participants. It also briefly outlines how supply chains might
                                                                        alter in coming years and be affected by technological change.                                    Track price at port
     grain to Australia’s key markets, although these costs are not
     included as a component of the supply chain costs within
     Australia. Shipping costs are set on a global market and there
     is limited capacity for the Australian industry to affect these
     costs.                                                                                                                                                                            PLUS port in-take receival costs
     Although the primary focus of this report is to clarify the                                                                                 HANDLE AND STORE
     cost components of export grain supply chains in Australia,              It is simplistic thinking to view the                                GRAIN AT PORT
     it needs to be noted that many components are best viewed
     not simply as cost items but rather as service activities. Just          components of a supply chain as                                                           Free-in-store (FIS) price
     because a service can be provided at a low price does not
     necessarily mean that service is fit-for-purpose. Indeed, it
                                                                              costs to be avoided or slashed.
     needs to be noted that farmers, freight service providers and            Rather, they are a portfolio of
     grain handlers have invested millions of dollars in recent                                                                                                                            PLUS port out-turn costs
     years in maintaining and upgrading assets that underpin                  services whose value proposition
     Australia’s grain supply chains. As pointed out by Kingwell
     (2017), higher yielding wheat varieties, improved agronomy               requires regular review.                                         LOAD GRAIN ONTO SHIP
     and greater work rates of farm machinery lead to huge
     volumes of grain needing to be carted and stored each day of                                                                                                     Free-on-board (FOB) price
     a modern harvest. Accordingly, millions of dollars need to be
     spent ensuring on-farm and off-farm assets are increasingly
     fit-for-purpose in delivering and storing that rapidly harvested
     grain. Hence, the cost of a service within any supply chain                                                                                                                              PLUS shipping and
     needs to be weighed against the value or benefit it generates,                                                                                                                            insurance costs
     including risk management.
                                                                                                                                                SHIP TO DESTINATION

                                                                                                                                                                  Cost, insurance and freight (CIF)

                                                                                                                                         Figure 1 Pricing points through the Australian grain supply chain

14   Australia’s grain supply chains: Costs, risks and opportunities                                                                                                                            Australia’s grain supply chains: Costs, risks and opportunities   15
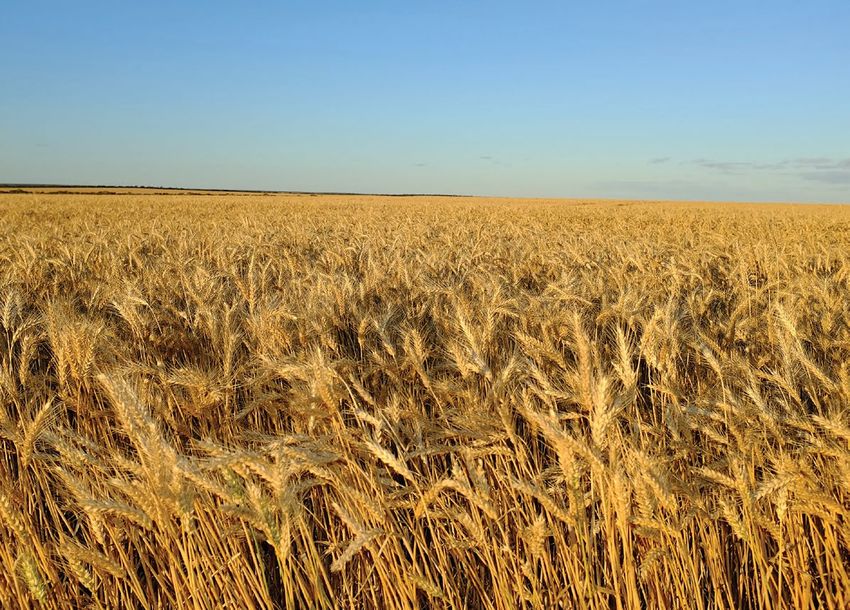
Australia's grain supply chains - Costs, risks and opportunities
Our approach
     Wheat is by far Australia’s principal export grain. Accordingly,   Grain production    Grain production    Grain production
                                                                            on farm             on farm             on farm
     we describe bulk export grain supply chains for wheat.
     Three supply chain structures are examined (Figure 2). These
     are not the only options available to farmers but they are
     representative of most of the grain exported from Australia.
     1. Traditional — Grain is delivered by a farmer into a local                                                    On farm
        receival site, owned by a bulk handler. The bulk handler is                                                  storage
        responsible for storing that grain on-site, and transporting
        it from bin to port, using the preferred method (road or
                                                                                                                                                                                                                                        Emerald
        rail). The grain is aggregated again at port, moved into a
                                                                             Truck to
        shipping position, then onto a vessel and shipped to the          receival point
        receiving port.
                                                                                                                                                                                                                                            Roma
     2. Direct — Grain is delivered by a farmer directly to port,                                                                                                                                                                                     Dalby            BRISBANE
        where it is aggregated, moved into a shipping position,                                                                                      Mingenew
        then onto a vessel and shipped to the receiving port.              Handle and
        Grain in this supply chain bypasses the upcountry receival        store grain at
                                                                                                                                                             Wickepin
        network. It relies on the farmer having access to a port          receival point                                                                                                                                                             Narrabri
                                                                                                                                            PERTH              Hyden                                    Warramboo
        that will accept direct deliveries.                                                                                                                             Grass Patch
                                                                                                                                                                                                              Ardrossan                     Goolgowi
     3. On-farm — This supply chain replaces the storage node                                                                                          Kukerin                                                     Roseworthy
        in the traditional supply chain with on-farm storage. This                                                                                                                                                                                            SYDNEY
                                                                                                                                                                                                      ADELAIDE              Ouyen
        has implications for the activity of transporting grain, as       Truck or rail       Truck or rail       Truck or rail                                                                                                        Deniliquin
        the farmer can decide when, and whether, to deliver grain         grain to port       grain to port       grain to port                                                                           Pinnaroo            Horsham
        into the bulk handling system. The on-farm storage supply                                                                                                                                                              Lake Bolac
        chain has several differences to other chains, such as
        the risk profile inherent within it. There are still common                                                                Figure 3 Locations used within the analysis in this report                           MELBOURNE
        components, such as the delivery to port and the costs
        associated with using the port infrastructure.                     Handle and          Handle and          Handle and
     These different supply chain options are not available to             store grain         store grain         store grain
                                                                             at port             at port             at port
     all growers, and there are different cost items within each                                                                                                                                                                              HOBART
     grain-growing region. For each of the supply chains that are
     available within each region, we present the likely costs,
     using a set of fixed locations to represent some typical supply
                                                                           Load grain          Load grain           Load grain     Costs and charges
     origins. The locations are chosen to illustrate the costs within      onto ship           onto ship            onto ship
     each chain. The locations we selected are presented in                                                                        This report presents publicly available data and published         By illustration, and as discussed later in this report, most
     Figure 3.                                                                                                                     reference prices. Published prices indicate the cost to an         grain farmers in WA are members of CBH, the dominant
                                                                                                                                   Australian wheat producer of using various export grain supply     provider of grain handling and marketing services in WA.
                                                                                                                                                                                                      Particularly in recent years, WA farmers have received rebates
     Logic behind our approach                                               Ship to             Ship to             Ship to
                                                                                                                                   chain services. We recognise that in some cases discounts to
                                                                                                                                   the reference prices are provided, particularly to large growers   of charges when using CBH services, which effectively offsets
                                                                           destination         destination         destination     or traders as regular users of particular supply chains. The       a proportion of the farmers’ future costs of using CBH supply
     The approach taken within this report differs slightly from the                                                               size of these discounts is generally not publicly available.       chains. Hence, in this case, there can be a difference between
     2014 report by Stretch et al. (2014). This shift is in response                                                               Similarly, we do not know the cost of providing supply chain       the charges farmers face for using a supply chain and the net
                                                                        Figure 2 Overview of the three types of supply chains
     to feedback received through the consultation process of                                                                      services, and we have not attempted to estimate these.             cost they incur.
                                                                        presented in this report
     the previous report. This method allows the comparison and                                                                    Our aim is to provide improved visibility of supply chain          Figure 4 shows supply chain costs of various locations when
     discussion of supply chain costs on a node-by-node basis                                                                      charges and provide some explanation as to why these may           commercial upcountry storage is used while Figure 5 shows
     across Australia without explicitly pitching the costs of any                                                                 legitimately vary in different regions and zones. For example:     supply chain costs when farm storage is used and then grain
     one supplier of bulk handling services against another, which                                                                                                                                    is delivered direct to port. In Figure 5 we have used the
     is not the intent of this study.                                                                                              • In most cases, the distance of a production region from
                                                                                                                                                                                                      direct-to-vessel model CBH provides where discounts of $3.80
                                                                                                                                     port increases the cost of freight services for that region’s
     In compiling this report, we have used consultants and                                                                                                                                           and $3.50 to the receival fee and storage and throughput fee
                                                                                                                                     supply chain.
     industry experts to assist us. We have also requested                                                                                                                                            respectively are provided.
                                                                                                                                   • For port terminals not exempt from the regulatory
     contributions from industry participants on particular topics.
                                                                                                                                     provisions of the Port Access Code (the Code’), their port
     We appreciate and have valued the supply chain service
                                                                                                                                     fees will reflect some additional regulatory burden.
     providers who have helped ensure, wherever possible, that
     information in this report is accurate and relevant.                                                                          • Some farmers are not only users of supply chain services
                                                                                                                                     but also co-owners of those businesses and the ownership
                                                                                                                                     structure can affect the net cost of using the supply chain
                                                                                                                                     services.

16   Australia’s grain supply chains: Costs, risks and opportunities                                                                                                                                       Australia’s grain supply chains: Costs, risks and opportunities        17
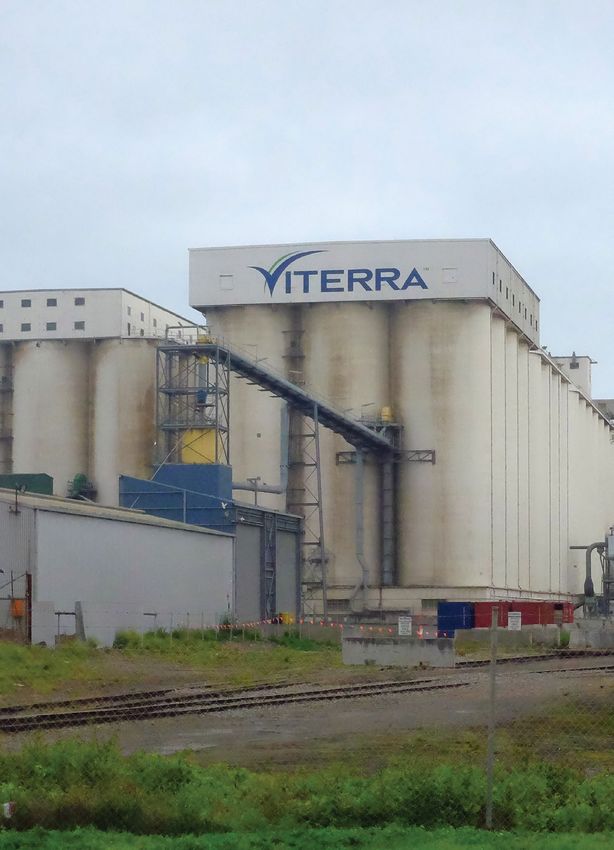
Australia's grain supply chains - Costs, risks and opportunities
120                                                                                                                                                                                                                                                                                                                                                                                                                                                                                       120

             100                                                                                                                                                                                                                                                                                                                                                                                                                                       Port charges
                                                                                                                                                                                                                                                                                                                                                                                                                                                                                                       100                                                                                                                                                                                                                                                                                                                                                                    Port charges
                                                                                                                                                                                                                                                                                                                                                                                                                                                       Port charges (estimateda)                                                                                                                                                                                                                                                                                                                                                                                              Port charges (estimateda)
              80                                                                                                                                                                                                                                                                                                                                                                                                                                       Freight to port (actual)                         80                                                                                                                                                                                                                                                                                                                                                                    Freight to port (actual road)
                                                                                                                                                                                                                                                                                                                                                                                                                                                       Freight to port (estimatedb)                                                                                                                                                                                                                                                                                                                                                                                           Freight to port (estimated roadb)

                                                                                                                                                                                                                                                                                                                                                                                                                                                                                               ($/t)
     ($/t)

              60                                                                                                                                                                                                                                                                                                                                                                                                                                       Storage for three months                         60                                                                                                                                                                                                                                                                                                                                                                    On-farm storage (three months)
                                                                                                                                                                                                                                                                                                                                                                                                                                                       Up country receival and shrinkage                                                                                                                                                                                                                                                                                                                                                                                      Freight: paddock to on-farm storagec
              40                                                                                                                                                                                                                                                                                                                                                                                                                                       Freight: Farm to up-countryc                     40                                                                                                                                                                                                                                                                                                                                                                    State research and biosecurity levies
                                                                                                                                                                                                                                                                                                                                                                                                                                                       State research and biosecurity levies                                                                                                                                                                                                                                                                                                                                                                                  End point royalties
              20                                                                                                                                                                                                                                                                                                                                                                                                                                       End point royalties                              20                                                                                                                                                                                                                                                                                                                                                                    GRDC levy
                                                                                                                                                                                                                                                                                                                                                                                                                                                       GRDC levy
               0                                                                                                                                                                                                                                                                                                                                                                                                                                                                                         0
                       Roseworthy – Outer Harbor

                                                   Ardrossan – Port Giles

                                                                            Grass Patch – Esperance

                                                                                                      Mingenew – Geraldton

                                                                                                                             Lake Bolac – Geelong

                                                                                                                                                    Warramboo – Port Lincoln

                                                                                                                                                                               Wickepin – Kwinana

                                                                                                                                                                                                    Dalby West – Brisbane

                                                                                                                                                                                                                            Kukerin – Bunbury

                                                                                                                                                                                                                                                Pinnaroo – Outer Harbor

                                                                                                                                                                                                                                                                          Horsham – Geelong

                                                                                                                                                                                                                                                                                              Deniliquin – Melbourne

                                                                                                                                                                                                                                                                                                                       Emerald – Gladstone

                                                                                                                                                                                                                                                                                                                                             Narrabri – Newcastle

                                                                                                                                                                                                                                                                                                                                                                    Hyden – Albany

                                                                                                                                                                                                                                                                                                                                                                                     Ouyen – Geelong

                                                                                                                                                                                                                                                                                                                                                                                                       Roma West – Brisbane

                                                                                                                                                                                                                                                                                                                                                                                                                              Goolgowi – Port Kembla

                                                                                                                                                                                                                                                                                                                                                                                                                                                                                                                 Ardrossan – Port Giles

                                                                                                                                                                                                                                                                                                                                                                                                                                                                                                                                          Grass Patch – Esperance

                                                                                                                                                                                                                                                                                                                                                                                                                                                                                                                                                                    Mingenew – Geraldton

                                                                                                                                                                                                                                                                                                                                                                                                                                                                                                                                                                                           Lake Bolac – Geelong

                                                                                                                                                                                                                                                                                                                                                                                                                                                                                                                                                                                                                  Warramboo – Port Lincoln

                                                                                                                                                                                                                                                                                                                                                                                                                                                                                                                                                                                                                                             Dalby West – Brisbane

                                                                                                                                                                                                                                                                                                                                                                                                                                                                                                                                                                                                                                                                     Kukerin – Bunbury

                                                                                                                                                                                                                                                                                                                                                                                                                                                                                                                                                                                                                                                                                          Horsham – Geelong

                                                                                                                                                                                                                                                                                                                                                                                                                                                                                                                                                                                                                                                                                                               Deniliquin – Melbourne

                                                                                                                                                                                                                                                                                                                                                                                                                                                                                                                                                                                                                                                                                                                                         Emerald – Gladstone

                                                                                                                                                                                                                                                                                                                                                                                                                                                                                                                                                                                                                                                                                                                                                                Narrabri – Newcastle

                                                                                                                                                                                                                                                                                                                                                                                                                                                                                                                                                                                                                                                                                                                                                                                        Hyden – Albany

                                                                                                                                                                                                                                                                                                                                                                                                                                                                                                                                                                                                                                                                                                                                                                                                          Ouyen – Geelong

                                                                                                                                                                                                                                                                                                                                                                                                                                                                                                                                                                                                                                                                                                                                                                                                                             Roma West – Brisbane

                                                                                                                                                                                                                                                                                                                                                                                                                                                                                                                                                                                                                                                                                                                                                                                                                                                     Goolgowi – Port Kembla
                        60km                        75km                     85km                     105km 160km 190km 220km 240km 260km 270km 280km 300km 365km 400km 437km 440km 510km 590km                                                                                                                                                                                                                                                                                                                  75km                     85km                      105km                  160km                  190km                      220km                   240km               260km                270km                     280 km                 300km                   365km             400km              437km                   440km

      Figure 4 Comparison of total wheat supply chain costs1, assuming grain is delivered to commercial upcountry                                                                                                                                                                                                                                                                                                                                                                              Figure 5 Comparison of wheat supply chain costs, when grain is stored on-farm for a period of three months,
      storage and outurned after three months2                                                                                                                                                                                                                                                                                                                                                                                                                                                 then delivered direct to port 1

      Notes:   1
                   The export select discount of $0.60 has been applied to Viterra supply chains.                                                                                                                                                                                                                                                                                                                                                                                              Notes:   1
                                                                                                                                                                                                                                                                                                                                                                                                                                                                                                             Port charges for Viterra vary throughout the year. We have applied charges for export at February 2018.
               2
                   Port charges for Viterra vary throughout the year. We have applied charges for export at February 2018.                                                                                                                                                                                                                                                                                                                                                                              a
                                                                                                                                                                                                                                                                                                                                                                                                                                                                                                             Direct charges at port for Bunge in WA relate only to receival fees. Vessel loading charges for Bunge are not publicly available, so do not
                                                                                                                                                                                                                                                                                                                                                                                                                                                                                                             appear here. These are an internal charge for Bunge that should be reflected in the price offered for the grain. We have applied the CBH
                   a
                     Vessel loading charges at port for Bunge in WA are not publicly available. These are an internal charge for Bunge that should be reflected
                                                                                                                                                                                                                                                                                                                                                                                                                                                                                                             vessel loading charges to Bunge’s supply chain costs as an indicative estimate of these charges. CBH costs use the direct-to-vessel model
                   in the price offered for the grain. We applied the CBH port charges to cost of the Bunge’s supply chain as an indicative estimate of these
                                                                                                                                                                                                                                                                                                                                                                                                                                                                                                             where discounts are applied to the receival and storage and throughput fees.
                   charges.
                                                                                                                                                                                                                                                                                                                                                                                                                                                                                                        b
                                                                                                                                                                                                                                                                                                                                                                                                                                                                                                             GTA location differentials have been used to estimate freight charges for NSW, Vic and Qld. We acknowledge that location differentials are
                   b
                     GTA location differentials have been used to estimate freight charges for NSW, Vic and Qld. We acknowledge that location differentials are
                                                                                                                                                                                                                                                                                                                                                                                                                                                                                                             not freight rates and, in some cases, they are an inadequate estimate due to the large variation in freight charges that can occur in these
                   not freight rates and, in some cases, they are an inadequate estimate due to the large variation in freight charges that can occur in these
                                                                                                                                                                                                                                                                                                                                                                                                                                                                                                             states. Industry experts indicate actual freight rates may be higher or lower than GTA location differentials. GrainCorp execution rates offered
                   states. Industry experts indicate actual freight rates may be higher or lower than GTA location differentials. GrainCorp execution rates offered
                                                                                                                                                                                                                                                                                                                                                                                                                                                                                                             to pool providers in 2017–18 were on average 9% lower than GTA location differentials (see Figure 42 on page 60).
                   to pool providers in 2017–18 were on average 9% lower than GTA location differentials (see Figure 42 on page 60).
                                                                                                                                                                                                                                                                                                                                                                                                                                                                                                        c
                                                                                                                                                                                                                                                                                                                                                                                                                                                                                                             Cost of freight from paddock to on-farm storage was estimated at $10.10 per t based on a 5km journey at $0.12 per km plus a $6.50 turn
                   c
                    Cost of freight from farm to receival site was estimated at $10.10 per t based on a 30km journey at $0.12 per km plus a $6.50 turn around
                                                                                                                                                                                                                                                                                                                                                                                                                                                                                                             around cost.
                   cost.

                                                                                                                                                                                                                                                                                                                                                                                                                                                                                               Image courtesy: CBH
18    Australia’s grain supply chains: Costs, risks and opportunities                                                                                                                                                                                                                                                                                                                                                                                                                                                                                                                                                                                                                                                                                                                  Australia’s grain supply chains: Costs, risks and opportunities                                                                19
As is apparent in Figure 4 and Figure 5, there is a large
     variation in total costs with a range of factors contributing to
     this variation so that straightforward comparisons between
     individual supply chains is not always meaningful. Subsequent
     sections of this report provide some explanation as to
     why costs and charges legitimately differ between service
     providers; however, adequate information is not available
     in all cases. For example, distance to port is a significant
     component of the total cost of the export supply chain but
     the cost of transport in Queensland, NSW and Vic is difficult
     to estimate. We have used location differentials published by
     GTA but these are not freight rates (see Box 3 on page 62) and
     have not been updated for the past five years. We are aware
     that actual freight rates in these states are variable and at
     times may be up to $5–10/t higher or lower than the published
     GTA location differential. GrainCorp execution rates offered to
     pool providers in 2017–18 were on average 9% lower than GTA
     location differentials (see Figure 42 on page 60). Nevertheless,
     it is apparent that for sites in NSW that are about 600km from
     port, total supply chain costs are more than $100/t. In SA
     and WA, where the distances to port often range from 100km
     to 200km, the cost of using the supply chain is closer to
     $50–$80/t, dependent on location (Figure 6).
     While the relationship between distance and cost is nearly
     linear across all states (with similar slope irrespective of the
     state), the differences in the fixed-cost component of each
                                                                                 Bulk loading of grain into the ships hold at port.
     supply chain does impart groupings dependent on the state.
     For instance, there is a distinct difference in the costs of
     the supply chains between WA and other states, where the
     distances between the receival sites and ports are similar. The
     fixed costs relate to those static per tonne costs at receival
     sites and ports, as well as the levies and storage costs.

                                                                                                                                      Distance to port is a significant
                                                                                                                                      component of the total cost of the
           120
                                                                                                                                      export supply chain but the cost of
           100                                                                                                 South Australia        transport in Queensland, NSW and
                                                                                                               Western Australia
            80                                                                                                 Victoria
                                                                                                                                      Vic is difficult to estimate.
                                                                                                               Queensland
            60                                                                                                 New South Wales
     $/t

            40

            20

            0
                 0         100          200           300          400     500          600         700
                                              Kilometres to natural port

     Figure 6 Plot of distance to port and cost of the supply chain for each of the examined supply chains
     (except Bunge, WA), grouped by state

20   Australia’s grain supply chains: Costs, risks and opportunities                                                                                                        Australia’s grain supply chains: Costs, risks and opportunities   21
Australia seasonal rainfall zones

       Wheat production
                                                                                                                                                                                      Based on rainfall data 1900–99

       and export from Australia
                                                                                                                                                                                                                                                DARWIN                                            Weipa

                                                                                                                                                                                                                                           Kalumburu
                                                                                                                                                                                                                                                                 Katherine
                                                                                                                                                                                                                                                                                        Kowanyama

                                                                                                                                                                                                                                                                                                                           Cairns
                                                                                                                                                                                                                                                                                                        Normanton
                                                                                                                                                                                                                    Broome              Halls Creek

                                                                                                                                                                                                                                                                                                                                  Townsville
                                                                                                                                                                                                                                                                        Tennant Creek
                                                                                                                                                                                                  Port Hedland                                                                                  Mount Isa
                                                                                                                                                                                                                              Telfer                                                                                                       Mackay

          Location of cropping
                                                                                                                                                                                                                    Newman                                                                                            Longreach                Rockhampton
                                                                                                                                                                                                                                                                       Alice Springs

                                                                                                                                                                                             Carnarvon                                         Giles                                       Birdsville

                                                                                                                                                                                                                     Wiluna                                                                                                  Charleville

                      Over the past 10 years, the Australian grain crop has been produced on about                                                                                                                                                                            Oodnadatta                                                            BRISBANE

                      24 million hectares (ha), which is more than double the crop area in the early 1990s                                                                            Geraldton
                                                                                                                                                                                                                                                                                         Marree
                                                                                                                                                                                                                                                                                                                            Bourke
                                                                                                                                                                                                                                                                                                                                               Coffs Harbour
                      (ABARES, 2017).                                                                                                                                                                                      Kalgoorlie                     Cook

                                                                                                                                                                                            PERTH                                                                     Ceduna                                                             Dubbo
                                                                                                                                                                                                                                                                                        Port Augusta

                                                                                                                                                                                                                                                                                                                                                    SYDNEY
                                                                                                                                                                                                                                                                                                            Mildura
                                                                                                                                                                                                                                                                      Port Lincoln
                                                                                                                                                                                                                           Esperance                                                     ADELAIDE
       Cropping areas in all states are dispersed along the coast                                        The expansion of the cropping area, as mentioned above,                                           Albany                         Climate classes                                                                                  CANBERRA

       making freight distances from the production areas to coastal                                     over the past 30 years has occurred at the same time as there                                                                          Summer dominant                                             Horsham

       ports relatively short for many growers (Figure 7). Distances                                     has been a shift in rainfall zones southward and westward                                                                              Summer                                                                MELBOURNE         Orbost

                                                                                                                                                                                                                                                Uniform
       from grain receival sites to port by road are generally shortest                                  of about 100–400km (Figure 8). The shift in rainfall has seen                                                                                                                          Warrnambool
                                                                                                                                                                                                                                                 Winter
       in SA, averaging about 144km and longest in NSW averaging                                         crop yields grow at a faster rate in the medium and high                                                                                Winter dominant
                                                                                                                                                                                                                                                                                                                 Cape Grim
                                                                                                                                                                                                                                                                                                                                        St Helens
       about 418km1. Very short minimum distances to port occur in                                       rainfall zones compared with low rainfall areas. These effects                           agrometeorology                                Wheatbelt boundary                                          Strahan
       Vic, SA and WA where a good proportion of receival sites are                                      combined seemed to have caused a shift in the location of                                  A U S T R A L I A
                                                                                                                                                                                                                                                                                                                                       HOBART

       located close to ports. This contrasts with Qld and NSW where                                     cropping (Figure 9).                                                          C Agrometeorology Australia, 2018

       the closest receival sites are 120km and 210km respectively
       from the closest port.
                                                                                                                                                                                      Australia seasonal rainfall zones
                                                                                                                                                                                      Based on rainfall data 2000–17
                     700
                                                                                                                                                                                                                                                DARWIN                                            Weipa
                     600                                                                                                                                                                                                                   Kalumburu
                                                                                                                                                                                                                                                                 Katherine

                                                                                                                                                                                                                                                                                        Kowanyama
                     500
                                                                                                                                                                                                                                                                                                                           Cairns
     Distance (km)

                                                                                                                                                                                                                                                                                                        Normanton
                                                                                                                                                                                                                    Broome              Halls Creek
                     400                                                      X                                                                                                                                                                                                                                                   Townsville
                                                                                                                                                                                                                                                                        Tennant Creek
                                                                                                                                                                                                  Port Hedland
                                                                                                                                                                                                                                                                                                Mount Isa

                     300                                X                                                                                                                                                                     Telfer                                                                                                       Mackay

                                    X                                                                                                                                                                               Newman                                                                                            Longreach                Rockhampton
                                                                                                                          X                                                                                                                                            Alice Springs

                     200                                                                                                                                                                     Carnarvon                                         Giles                                       Birdsville

                                                                                                    X                                                                                                                Wiluna                                                                                                  Charleville
                     100                                                                                                                                                                                                                                                     Oodnadatta                                                             BRISBANE

                                                                                                                                                                                      Geraldton
                                                                                                                                                                                                                                                                                         Marree
                       0                                                                                                                                                                                                   Kalgoorlie                     Cook
                                                                                                                                                                                                                                                                                                                            Bourke
                                                                                                                                                                                                                                                                                                                                               Coffs Harbour

                                    Vic                 Qld                 NSW                     SA                    WA                                                                PERTH                                                                     Ceduna
                                                                                                                                                                                                                                                                                        Port Augusta                                     Dubbo

                                                                                                                                                                                                                                                                                                                                                    SYDNEY
                                                                                                                                                                                                                                                                                                            Mildura
      Figure 7 Distance by road from receival site in each state to the closest export port.                                                                                                                               Esperance
                                                                                                                                                                                                                                          Climate classes
                                                                                                                                                                                                                                                                      Port Lincoln
                                                                                                                                                                                                                                                                                         ADELAIDE
                                                                                                                                                                                                                                                                                                                                           CANBERRA
                                                                                                                                                                                                           Albany
      Note:           Mean distance indicated by ‘X’, median distance indicated by horizontal line. The box indicates distances for                                                                                                             Summer dominant                                             Horsham
                      50 per cent of all values bounded by the 1st and 3rd quartiles. The full range of distances is indicated by the                                                                                                           Summer                                                                                  Orbost
                                                                                                                                                                                                                                                                                                                      MELBOURNE
                      upper and lower bars.                                                                                                                                                                                                     Uniform
                                                                                                                                                                                                                                                                                                Warrnambool
      Source: AEGIC and GTA                                                                                                                                                                                                                      Winter
                                                                                                                                                                                                                                                 Winter dominant                            Cape Grim
                                                                                                                                                                                                                                                                                                                                        St Helens
                                                                                                                                                                                                                                                 Wheatbelt boundary
                                                                                                                                                                                                  agrometeorology
                                                                                                                                                                                                    A U S T R A L I A                            Change 2000-2017 compared to 1900-1999
                                                                                                                                                                                                                                                                                        Strahan
                                                                                                                                                                                                                                                                                                                                       HOBART

                                                                                                                                                                                       C Agrometeorology Australia, 2018

      1
            Determined using Grain Trade Australia’s location differential tables and calculating the shortest distance by road from the receival site in each state to the natural
            port (http://www.graintrade.org.au/location_differential_tables)                                                                                                           Figure 8 Shift in Australian rainfall zones from 20th century (top) to the first 17 years
                                                                                                                                                                                       of the 21st century (above).
                                                                                                                                                                                       Source: Agrometerology Australia

22    Australia’s grain supply chains: Costs, risks and opportunities                                                                                                                                                                                                                  Australia’s grain supply chains: Costs, risks and opportunities         23
You can also read