Demand Response ELCC CAISO - Zach Ming, Director Vignesh Venugopal, Consultant
←
→
Page content transcription
If your browser does not render page correctly, please read the page content below
Demand Response ELCC
CAISO
June 24, 2021

 Zach Ming, Director
 Vignesh Venugopal, Consultant
 Arne Olson, Sr. Partner
Overview In May 2020, E3 publicly released a study quantifying the reliability contribution of demand response in the CAISO • This original study is contained in slides 4 – 37 of this presentation In December 2020, E3 publicly released an update of the study based on new information provided by SCE • This updated study results are contained in slides 38 – 43 of this presentation In June 2021, E3 publicly released an update of the study, quantifying the ELCC based on DR bids placed by PG&E, SCE and SDG&E in 2020 • This updated study results are contained in slides 44 - 54 of this presentation 2
Outline for Today’s Meeting Background on ELCC and RECAP Performance of PG&E, SCE and SDG&E programs in 2020 Questions 3
Original Demand Response
 ELCC Study
 CAISO ESDER Stakeholder Meeting
 May 27, 2020

 Zach Ming, Director
 Vignesh Venugopal, Consultant

Overview Background California has a unique approach to capacity procurement, where the CPUC administers a Resource Adequacy (RA) program to ensure sufficient resources to maintain an acceptable standard of reliability, but the CAISO retains ultimate responsibility for the reliable operation of the electricity system The CAISO was concerned that demand response (DR) was being overcounted in the Resource Adequacy program based on observed demand response bid data Project The CAISO retained E3 to investigate the reliability contribution of DR relative to its capacity value in the CPUC administered RA program To the extent that DR is overvalued, the CAISO asked E3 to suggest solutions to issue E3 provided technical analysis to support the CAISO in this effort 5

Disclaimer required by the California
 Public Utilities Commission

This report has been prepared by E3 for the California
Independent System Operator (CAISO). This report is separate
from and unrelated to any work E3 is doing for the California
Public Utilities Commission. While E3 provided technical
support to CAISO preparation of this presentation, E3 does
not endorse any specific policy or regulatory measures as a
result of this analysis. The California Public Utilities
Commission did not participate in this project and does not
endorse the conclusions presented in this report.

 6
Outline Refresher on March 3 CAISO stakeholder meeting presentation Background on ELCC Performance of Existing DR Characteristics of DR Needed for ELCC • Time availability • # of calls / duration of calls • Penetration of DR Incorporating DR ELCC into Existing CPUC RA Framework Questions 7
Acronyms
Acronym Name Description
API Agricultural and Pumping Interruptible DR program to suspend agricultural pumping

BIP Base Interruptible Program Participants are offered capacity credits for reducing their demand up to a pre-determined level in
 response to an event call

CBP Capacity Bidding Program DR program where aggregators work on behalf of utilities to enroll customers, arrange for load
 reduction, receive and transfer notices and payments

DR Demand Response Reductions in customer load that serve to reduce the need for traditional resources

ELCC Effective Load Carrying Capability Equivalent perfect capacity measurement of an intermittent or energy-limited resource, such as DR

LCA Local Capacity Area Transmission constrained load pocket for which minimum capacity needs are identified for reliability

LIP Load Impact Protocol Protocols prescribed by the CPUC for accurate and consistent measuring (and forecasting) of DR
 program performance

LOLP Loss of Load Probability Probability of a load shedding event due to insufficient generation to meet load + reserve requirements

NQC Net Qualifying Capacity A resource’s contribution toward meeting RA after testing, verification, and accounting for performance
 and deliverability restrictions

PDR Proxy Demand Response Resources that can be bid into the CAISO market as both economic day-ahead and real-time markets
 providing energy, spin, non-spin, and residual unit commitment services

PRM Planning Reserve Margin Capacity in excess of median peak load forecast needed fore reliability

RA Resource Adequacy Resource capacity needed for reliability

RDRR Reliability Demand Response Resources that can be bid into CAISO market as supply in both economic day-ahead and real-time
 Resource markets dispatched for reliability services

SAC Smart AC Cycling Direct air conditioner load control program offered by PG&E

SDP Summer Discount Plan Direct air conditioner load control program offered by SCE

SEP Smart Energy Program SCE program wherein a smart thermostat provider adjusts A/C usage in response to an event

LCR Local Capacity Requirement Resources procured by SCE (incl. DR) for local capacity needs in the LA Basin

SubLAP Sub-Load Aggregation Point Defined by CQAISO as relatively continuous geographical areas that do not include significant
 transmission constraints within the area
 8
Refresher on March 3 CAISO ESDER
 Meeting

 Provided E3 thoughts on how to match
 CAISO and utility DR bid data as well as
Established disconnect between ELCC
 techniques to extend this data over
 and NQC
 multiple historic weather years. Both
 points were addressed with the 2019 data.

 9
Key Questions to Answer
1) How are demand response programs performing today, relative to what
 they are being credited for?
 NQC ELCC

2) What characteristics of demand response are needed today and in the
 future?
 hrs/call
 availability
 # of calls/yr
3) How should a resource adequacy program be designed to allocate and
 credit both DR in aggregate and individual DR programs?
 Resource Portfolio
 Resource Class

 DR DR Storage Storage Solar Solar
 DR DR Storage Storage Solar Solar
 DR DR Storage Storage Solar Solar

 10
Background on ELCC and
 RECAP
Effective Load Carrying Capability (ELCC) Effective Load Carrying Capability (ELCC) is a measure of the amount of equivalent perfect capacity that can be provided by an intermittent or energy-limited resource • Intermittent resources: wind, solar • Energy-limited resources: storage, demand response Industry has begin to shift toward ELCC as best practice, and the CPUC has been at the leading edge of this trend 12
Measuring ELCC There are multiple approaches to measuring the ELCC of a resource(s) • Portfolio ELCC: measures the combined ELCC of all intermittent and energy-limited resources on the system • First-In ELCC: measures the marginal ELCC of a resource as if it were the only intermittent or energy- limited resource on the system, thus ignoring interactive effects • Last-In ELCC: measures the marginal ELCC of a resource after all other intermittent or energy-limited resources have been added to the system, capturing all interactive effects with other resources Last Negative In Adjustment Last Last Positive DR In In Adjustment Last In First Solar Portfolio Portfolio Portfolio Portfolio DR In Solar First First DR First In In In Slr Slr DR 13
“First-In” ELCC First-in ELCC measures the ability of a resource to provide capacity, absent any other resource on the system This measures the ability of a resource to “clip the peak” and is often analogous to how many industry participants imagine capacity resources being utilized DR load perfect capacity 14
“Last-In” ELCC Last-in ELCC can be higher or Last-in ELCC measures the ability of a lower than first in ELCC resource to provide capacity, assuming all other resources are on the system • Higher last-in ELCC means there are positive synergies with load the other resources that yield a diversity benefit • Lower last-in means the resource is similar to other resources and competes to provide the storage same services, yielding a diversity penalty discharge DR solar hydro firm resources 15
Today (2019) vs. Future (2030) E3 analyzed the value of DR to the CAISO system today (2019) and the future (2030) to assess how coming changes to the electricity system might impact value Primary changes are on the resource side (shown below) with modest changes to loads (49 GW 2019 peak load vs 53 GW 2030 peak load) 2019 and 2030 CAISO Resource Portfolio 5,000+ MW retirement of thermal resources 24,000+ MW increase in solar 11,000+ MW increase in storage Small increase in DR Source: CPUC Integrated Resource Plan (IRP) Reference System Plan (RSP) 16
Performance of Existing PG&E and SCE event-based DR Programs Demand response (DR) resource adequacy qualifying capacity is currently calculated using the load impact protocols (LIP), which are performed by the utilities under the oversight of the CPUC • LIP uses regression and other techniques to estimate the availability of demand response during peak load hours E3 has analysis suggests that LIP overvalues the capacity contribution DR relative to ELCC by 30%+ for two reasons: 1) DR does not bid into the CAISO market, in aggregate, at levels equal to its NQC value 2) The times when DR is bid are either not at optimal times or not for long enough to earn full ELCC value NQC values: the RA value DR receives based on CPUC LIP process, grossed up for PRM and T&D losses -45% -48% -45% -53% Max bids: the maximum aggregate bids for all utility DR programs of interest in 2019 ELCC: the ELCC value based on the actual utility DR bids in 2019, accounting for the hours in which it was available Load impacts are grossed up for transmission and distribution losses, as also the 15% PRM, owing to demand response being a demand reduction measure = ∗ 1.15 ∗ & [1] Load impacts for the year 2019 are referenced from the CPUC’s RA Compliance documents [2] [1] CPUC 2019 RA Guide [2] CPUC 2019 IoU DR Program Totals Load impacts are defined on an LCA level from 1 pm to 6 pm, Apr to Oct, and from 4 pm to 9 pm in the rest of the year, both with and without line losses 17
First-in ELCC of PG&E and SCE Programs

 PG&E
 0% ELCC for BIP and CBP Humboldt is a
 result of the program size being too small

 These results just focus
 SCE on utility event-based DR,
 not DRAM programs

 Pmax is max bid placed in
 the given month

 18
Time Window Availability Needs for DR in 2019 & 2030 Month/hour (12x24) loss of load probability heat maps provide a quick overview of “high risk” hours Key findings from this project are showing that strong interactions between storage and DR may elongate the peak period by 2030 LOLP in 2019 LOLP in 2030 1 2 3 4 5 6 7 8 9 10 11 12 13 14 15 16 17 18 19 20 21 22 23 24 1 2 3 4 5 6 7 8 9 10 11 12 13 14 15 16 17 18 19 20 21 22 23 24 Jan Jan Feb Historical LOLP hours driven by gross peak load Feb Mar during summer afternoons, but an abundance of Mar Apr solar energy has now reduced the LOLP in these Apr LOLP hours will continue to shift later into the May hours May Jun evening as solar and storage increase Jun Jul Jul Aug 5pm 9pm Aug 4pm 12am Sep Sept Sep Sept Oct Oct Nov Current LOLP hours have been shifted later into the Nov Dec Dec LOLP hours may elongate back into the afternoon evening and later in summer due to solar as storage proliferates and market signals encourage it to wait to discharge during later hours 19
RECAP: Renewable Energy Capacity Planning Model RECAP evaluates adequacy through time-sequential simulations over many years Inputs Outputs Load LOLE • Hourly load for many weather years • Loss of load expectation Dispatchable Generation • days/yr of total expected lost load • Capacity ALOLP 20 • FOR • Annual loss of load probability • Maintenance • % probability of having a single loss of Renewables load in any given year • Capacity EUE • Hourly generation profiles for many • Expected unserved energy weather years • MWh/yr of energy that cannot be served Hydro ELCC • Hydro availability for many hydro years • Effective load carrying capability • Max/min constraints • Equivalent quantity of ‘perfect capacity’ Storage for a variable or energy-limited resource • Capacity TPRM • Duration • Target planning reserve margin • Roundtrip efficiency • PRM required to achieve a specified • FOR x1000 reliability threshold (i.e. LOLE, ALOLP, or Demand Response EUE) • Capacity/ Hourly Availability • Max # of calls • Duration of each call 20
DR Interaction with Storage Historically, DR is dispatched as a resource of “last resort” which is how RECAP dispatched DR A system with high penetrations of storage require much more coordination in the dispatch of DR and storage in order to achieve maximum reliability E3 RECAP Model Methodology 21
DR Interaction with Storage Historically, DR is dispatched as a resource of “last resort” which is how RECAP dispatched DR A system with high penetrations of storage require much more coordination in the dispatch of DR and storage in order to achieve maximum reliability E3 RECAP Model Methodology 22
Last Resort vs. Optimal Dispatch

DR as Resource of Last Resort DR Dispatch to Delay Storage Discharge

 When DR is dispatched as Preemptively dispatching DR
 the resource of last resort, to delay storage discharge
 there is loss of load eliminates loss of load event

 Key takeaway: DR should be dispatched to delay storage
 discharge on days with potential loss of load

 23
Call and Duration ELCC Results

 First-in ELCC Last-in ELCC
 ELCC (% of Max annual calls ELCC (% of Max annual calls
 nameplate) 1 2 4 5 10 15 20 nameplate) 1 2 4 5 10 15 20
2 1 46% 50% 51% 51% 51% 51% 51% 1 59% 73% 73% 73% 73% 73% 73%
0 2 63% 73% 78% 78% 78% 78% 78% 2 74% 90% 94% 94% 94% 94% 94%
1 Max call Max call
 duration 4 70% 81% 94% 95% 95% 95% 95% duration 4 77% 98% 100% 100% 100% 100% 100%
9 (hrs) (hrs)
 6 70% 81% 94% 95% 95% 95% 95% 6 77% 98% 100% 100% 100% 100% 100%

 8 70% 81% 94% 95% 95% 95% 95% 8 77% 98% 100% 100% 100% 100% 100%

 No interactions with storage – Significant degradation in last-in ELCC in 2030
 therefore no expected is driven by saturation of energy-limited
 significant differences resources, primarily storage

 ELCC (% of Max annual calls ELCC (% of Max annual calls
 nameplate) 1 2 4 5 10 15 20 nameplate) 1 2 4 5 10 15 20
2 1 41% 43% 43% 43% 43% 43% 43% 1 35% 37% 37% 37% 37% 37% 37%
0 2 60% 65% 65% 65% 65% 65% 65% 2 44% 49% 49% 49% 49% 49% 49%
3 Max call Max call
 duration 4 72% 91% 95% 95% 95% 95% 95% duration 4 52% 65% 69% 69% 69% 69% 69%
0 (hrs) (hrs)
 6 73% 92% 98% 98% 98% 98% 98% 6 56% 77% 77% 77% 77% 77% 77%

 8 73% 92% 98% 98% 98% 98% 98% 8 75% 91% 93% 93% 93% 93% 93%

 24
DR ELCC Performance at Increasing Penetrations (2019) Average Last-in ELCC Incremental Last-in ELCC Existing capacity = 2195 MW Existing capacity = 2195 MW Average ELCC = Total Effective Capacity / Total Installed Capacity Incremental ELCC = ∆ Effective Capacity / ∆ Installed Capacity ELCC generally decreases as DR capacity on the system increases: • Similarity in hours of operation and characteristics limits the incremental value that more of the exact same resource type can add to the system. • Degradation gets more severe as call constraints become more stringent. 25
DR ELCC Performance at Increasing Penetrations (2030) Average Last-in ELCC Incremental Last-in ELCC 2030 RSP capacity = 2418 MW 2030 RSP capacity = 2418 MW ELCC generally decreases as DR capacity on the system increases: • Similarity in hours of operation and characteristics limits the incremental value that more of the exact same resource type can add to the system. • For a given DR capacity on the system, ELCC in 2030 is lower than that in 2019 owing to saturation of energy-limited resources on the system in 2030, particularly storage. 26
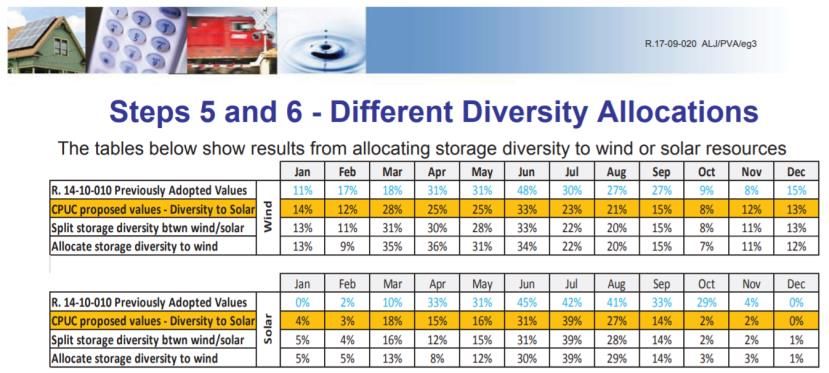
CPUC Role in RA & ELCC Implementation The CPUC has been a leader in North America through the incorporation of intermittent and energy-limited resources into RA frameworks • One of the first to adopt and implement ELCC framework to value wind and solar • Currently the only jurisdiction that recognizes and accounts for interactive effects of resources through allocation of a “diversity benefit” to wind and solar The CPUC has recognized that the concept of “interactive effects” applies not only to renewables but to storage and other resources, but has not yet established an approach for allocation that incorporates them all Establishing a more generalized, durable framework for ELCC (capable of accounting for renewables, storage, and DR) will require a reexamination of the methods used to allocate ELCC and the “diversity benefit” This section examines alternative options for allocating ELCC among resources that could improve upon existing methods currently in use 27
Allocating ELCC Allocating Portfolio ELCC is necessary with a centralized or bilateral capacity market framework where individual resources must be assigned a capacity contribution for compensation purposes • Directly impacts billions of dollars of market clearing transactions within California and other organized capacity markets Allocating Portfolio ELCC can impact planning and procurement in California to the extent that entities procure based on the economic signal they receive in the RA program • An allocation exercise is not necessary in vertically integrated jurisdictions or in systems with a centralized procurement process There are an infinite number of methods to allocate Portfolio ELCC to individual resources and no single correct or scientific method, similar to rate design Sample ELCC Allocation Method Options 1 2 3 4 5 Allocate Allocate Allocate adjustment to First- Vintaging approach where More proportionally to proportionally to In ELCC proportionally to each resource permanently First-In ELCC Last-In ELCC differences between First-in receives Last-In ELCC at the and Last-In ELCC time it was constructed 28
Framework to Incorporate DR ELCC Into CPUC RA Framework This section presents a framework as one option for attributing capacity value to DR within the current resource adequacy framework administered by the CPUC This framework relies on several key principles: 1) Reliability: The ELCC allocated to each project/program should sum to the portfolio ELCC for all resources 2) Fairness: ELCC calculations should be technology neutral, properly reward resources for the capacity characteristics they provide, and not unduly differentiate among similar resources 3) Efficiency: ELCC values should send accurate signals to encourage an economically efficient outcome to maximize societal resources 4) Customer Acceptability: ELCC calculations should be transparent, tractable understandable, and implementable 29
Overview of Framework

 Portfolio ELCC

1 Calculate portfolio ELCC

 First-In Wind Storage
 Solar DR
 Calculate “first-in” and “last-in” ELCC for
2 each resource category Last-In Wind Storage
 Solar DR

 Portfolio ELCC

 Wind
 Allocate portfolio ELCC to each resource
3 category Solar Storage DR

 Portfolio ELCC

 Allocate resource category ELCC to each
4 project/program using tractable heuristic

 30
1) Calculate Portfolio ELCC The first step should calculate the portfolio ELCC of all variable and energy- limited resources • Wind • Solar • Storage • Demand Response Portfolio ELCC 31
2) Calculation First-In and Last-In Resource Category ELCCs The second step calculates the “first-in” and “last-in” ELCC for each resource category as a necessary input for allocation of the portfolio ELCC DR First-In ELCC DR Last-In ELCC DR Last-In ELCC Repeat first-in and last-in calculations for Wind DR all resource categories Wind Portfolio Portfolio Solar Wind Solar DR Solar First-In Storage ELCC Storage DR Storage 32
3) Allocate Portfolio ELCC to Each
 Resource Category
 Calculate diversity impact as the difference between portfolio ELCC and sum of first-in ELCCs

 Portfolio
 Diversity

1 first-in

 Portfolio
 Impact

 ELCC
 first-in Wind
 first-in Solar
 first-in calculate this
 Storage
 DR
 Calculate diversity impact for each resource category
 calculate this last-in Repeat calculation of positive or negative
 DR allocator for each resource category

2 first-in Diversity
 Impact DR
 Wind
 diversity
 impact
 Solar
 diversity
 impact
 Storage
 diversity
 impact
 DR

 Allocate diversity impact in proportion to the difference between first-in and last-in ELCC for
 each resource category
 calculate this final resource
 DR Diversity Impact category
 Scaled impact allocated
 Scale individual ELCC
 Storage diversity impact resource category Scaled impact Portfolio

3 Solar diversity impact
 diversity impacts to
 match portfolio
 diversity impact
 Scaled Impact

 Scaled impact
 Diversity
 Impact
 first-in
 DR
 Scaled impact

 DR

 Wind diversity impact
 calculate this
 33
Benefits of this Approach There are several options to allocate Portfolio ELCC to each technology category, two examples of which are shown below First-In ELCC Allocation Option Last-In ELCC Allocation Option Last-In ELCC Wind First-In ELCC Solar Wind Wind Portfolio Portfolio Scale down Solar ELCC ELCC Wind Scale up to to match match Solar Storage Solar Portfolio Portfolio Storage Storage ELCC Storage ELCC DR DR DR DR Both of these options can lead to final ELCC allocations that fall outside the bounds of the first-in or last-in ELCC First-In ELCC Last-In ELCC • For example, in the case of a “perfect” resource (e.g. ultra-long duration storage, always available DR, baseload renewables, etc.), this should be Perfect Perfect counted at 100% ELCC and should not be unduly scaled up or down based on Resource = Resource = 100% the synergistic or antagonistic impacts of other resource interactions • Scaling the first-in or last-in ELCC in any way would result in an ELCC of either >100% or
4) Allocate Resource Category ELCC to Individual Resource/Programs Using Heuristics Hour 1 2 3 4 5 6 7 8 9 10 11 12 13 14 15 16 17 18 19 20 21 22 23 24 Each DR program submits the Jan Month Feb following information Mar Apr Peak period hours • Expected output during peak May (gross and net load peak) period hours Jun Jul • Maximum number of calls per year Aug Sep • Maximum duration of call Oct Nov Dec Step 1) Calculate average MW availability during peak period ELCC (% of Max annual calls hours (gross and net load) nameplate) 1 2 4 5 10 15 20 1 41% 43% 43% 43% 43% 43% 43% Step 2) Multiple MW availability First-In Max call 2 60% 65% 65% 65% 65% 65% 65% from step (1) by lookup table duration 4 72% 91% 95% 95% 95% 95% 95% de-rating factor to account for ELCC (hrs) 6 73% 92% 98% 98% 98% 98% 98% call and duration limitations 8 73% 92% 98% 98% 98% 98% 98% • DR category ELCC to individual ELCC (% of Max annual calls nameplate) program ELCC using first-in and 1 2 4 5 10 15 20 1 35% 37% 37% 37% 37% 37% 37% last-in ELCC would work similarly 2 44% 49% 49% 49% 49% 49% 49% to the allocation process of Last-In Max call duration 4 52% 65% 69% 69% 69% 69% 69% portfolio ELCC to resource category ELCC ELCC (hrs) 6 56% 77% 77% 77% 77% 77% 77% 8 75% 91% 93% 93% 93% 93% 93% 35
Questions?

 Questions

 36
Thank You

Thank You

Arne Olson (arne@ethree.com)
Zach Ming, (zachary.ming@ethree.com)
Vignesh Venugopal (vignesh.venugopal@ethree.com)
Updated Demand Response
 ELCC Study
 CAISO
 December 2020

 Zach Ming, Director
 Vignesh Venugopal, Consultant
Overview of DR ELCC Study Update The DR ELCC study has been updated to reflect two primary changes 1) SCE BIP Bid Values – The original DR bid data submitted to E3 from SCE reflected the actual BIP bid values but not the full capability of these resources – Due to discrete dispatch limitations and registration restrictions, SCE had been underbidding the full capability of its DR resources into the CAISO market – SCE has now modified its bidding procedures to reflect the full capability of these resources and has retroactively modified 2019 bid values to reflect its new bidding strategy 2) T&D Loss and PRM Gross Up – DR ELCC values are now compared to the DR NQC values net of T&D loss factors and PRM – Originally, both SCE and PG&E indicated to E3 that the demand response bid data was grossed up for T&D losses but after the May release of the study indicated it was not Avg Difference (MW) Average Increase in SCE Hourly DR Bid Data Month/Hour (PST) 1 2 3 4 5 6 7 8 9 10 11 12 13 14 15 16 17 18 19 20 21 22 23 24 1 127 126 125 125 130 137 142 147 148 151 158 148 146 144 140 137 127 125 125 124 124 141 143 139 2 122 121 121 121 125 132 137 140 140 140 143 144 140 136 134 132 129 128 127 125 125 134 135 131 3 113 113 113 116 122 128 132 131 132 141 138 133 129 126 125 123 123 122 121 120 124 126 124 118 4 207 289 456 187 205 193 210 220 230 219 260 202 192 188 186 179 177 187 179 180 185 199 204 186 5 137 137 134 137 144 150 153 157 152 153 157 156 149 148 145 140 133 142 141 145 147 140 138 131 6 108 107 105 108 115 119 123 125 120 123 125 124 119 119 115 111 103 112 110 114 115 109 107 106 7 92 92 89 91 98 103 109 110 101 105 107 106 103 101 99 95 88 96 95 98 98 93 91 90 8 99 99 95 97 104 109 117 119 112 115 116 115 117 117 115 111 105 103 101 105 106 101 97 96 9 86 88 85 87 93 98 102 105 99 102 103 102 99 98 94 90 84 91 89 94 95 90 86 86 10 101 102 98 101 105 108 111 117 115 119 121 117 112 112 109 106 98 107 104 109 110 104 99 98 11 88 89 89 90 92 97 102 108 104 110 111 153 105 103 101 101 101 101 97 87 84 91 97 93 12 72 68 67 66 69 75 77 80 79 77 95 78 79 79 77 76 74 71 76 76 75 80 79 77 39
Updated November 2020 Results Original May 2020 Results Updated November 2020 Results Updated NQC values remove PRM and T&D gross up in order to ensure apples-to-apples comparison with DR bids -19% -23% -19% -30% Updated SCE bid values have increased DR ELCC by approximately 100 MW Nov – May Difference in Results Key Finding DR ELCC is approximately 20 to 30% less than apples-to-apples NQC comparison 40
Factors Affecting Gap Between NQC* and ELCC The gap between NQC* and ELCC is driven by two primary factors • NQC* implies NQC net of T&D losses and PRM 1 Maximum aggregate bids are Updated November 2020 Results lower than NQC* in all hours 2 ELCC is lower than maximum aggregate bid because resources do not produce at this level in all loss of load hours • As more storage is added to the system, it flattens the peak which elongates the period of loss of load hours beyond 4- 9pm which further decreases the “Last-In ELCC” of DR • This issue is expected to grow in the future as evidenced by declining Last-In ELCC in 2030 see slide 18 for more detail 41
SCE-Specific Updated Results SCE BIP ELCC The update in the overall DR ELCC results are driven by updated bid data from the SCE BIP program SCE BIP ELCC has increased by approximately 100 MW across all cases First-in ELCC for BIP program in each LCA First-In ELCC for SCE BIP Programs by LCA has increased compare to values on slide 15 42
Comparing SCE BIP NQC to Nominations The primary reason SCE BIP ELCC values are lower than NQC values (adjusted for T&D and PRM factors) is due to nomination values that are lower than the NQC values September SCE BIP NQC (net of T&D and PRM) is 624 MW Maximum Nomination MW (2019 SCE BIP) Hour 1 2 3 4 5 6 7 8 9 10 11 12 13 14 15 16 17 18 19 20 21 22 23 24 Month 1 2 3 4 5 High LOLP hours 6 Maximum SCE BIP 7 470 505 502 500 493 8 494 517 514 514 506 nomination during high 9 462 496 491 492 484 10 LOLP hours is 517 MW 11 12 Average Nomination MW (2019 SCE BIP) Hour 1 2 3 4 5 6 7 8 9 10 11 12 13 14 15 16 17 18 19 20 21 22 23 24 Month 1 2 3 4 5 6 High LOLP hours 7 445 471 468 466 460 Average SCE BIP 8 476 493 490 491 483 nomination during high 9 448 473 468 469 461 10 LOLP hours is 471 MW 11 12 43
Assessment of 2020 DR Bids

 CAISO
 June 2021

 Zach Ming, Director
 Vignesh Venugopal, Consultant
CAISO System Modelled in 2020 and 2030 E3 analyzed the value of DR to the CAISO system in 2020 and 2030 based on the IRP portfolio for the 2021-2022 Transmission Planning Process[1] 2020 and 2030 CAISO Resource Portfolio 5,000+ MW retirement of thermal resources 26,000+ MW increase in solar 11,000+ MW increase in storage Small increase in DR [1] IRP Inputs to 2021-22 TPP 45
Time Window Availability Needs for DR in 2020 & 2030 Month/hour (12x24) loss of load probability heat maps provide a quick overview of “high risk” hours Key findings from this project are showing elongation of the peak period by 2030 LOLP in 2020 LOLP in 2030 Hour of day (Standard time) Hour of day (Standard time) 1 2 3 4 5 6 7 8 9 10 11 12 13 14 15 16 17 18 19 20 21 22 23 24 1 2 3 4 5 6 7 8 9 10 11 12 13 14 15 16 17 18 19 20 21 22 23 24 Jan Jan Historical LOLP hours driven by gross peak load Feb Feb Mar during summer afternoons, but an abundance of Mar LOLP hours will continue to shift and extend Apr solar energy has now reduced the LOLP in these Apr later into the evening as solar and storage May May hours increase Jun Jun Jul Jul 5pm 9pm 5pm 12am Aug Aug Sep Sept Sep Sept Oct Oct Nov Nov Dec Current LOLP hours have been shifted later into the Dec evening and later in summer due to solar 46
LIP Filing and NQC Calculation Timeline
NQC Calculated For Future Years. Based on- (1) DR Performance
 in Year Prior to PY and (2) DR Enrollment Projections

 The NQC[1] that
 ELCC has been
 compared to in 2020 2021 2022 …..
 this report

 2021 2022 2023 …..

 …..
 What happens if DR 2022 2023
 enrollment projection
 for 2020 is inaccurate?
 Load Impact Filed in April of Program Year (PY)

 2019 2020 2021 ….. [1] 2020 DR Program Totals

 47
Change in NQC Leading Up to Real-Time
SCE BIP In August For Example
 While bids are most in line
 with this NQC, updates to
 NQC do NOT feed into the
 RA process

 Monthly ILP and DR
 Apr 2019 Apr 2020 report- Actual
 Filing Updated Enrollment Enrollment and PY
 PY 2018 LIPP with PY 2018 LIPP 2019 LIPP Updates
 DR bids are placed in the
 DAM or RTM. Thus, based
 NQC calculated for Aug 2020 changes over on most recent NQC
 time, with updates to both expected load impact
 per participant (LIPP) and total number of
 participants
 DR availability is
 represented using DR bids.
 ELCC in MW does not
 change based on NQC it is
 being compared to

 Legend
 RECAP ELCC

 Year- Months- Month Of NQC Net of PRM and T&D

 Ahead Ahead Operation Max DR Bid

 48
Aggregate ELCC Results
While we remove PRM and T&D gross-up from the NQC to ensure a fair comparison with DR bids submitted, the NQC
 attributed to DR in the Resource Adequacy process is grossed up for both

 2020-With Additional SCE
 2019-PG&E and SCE 2020-PG&E and SCE
 Programs and SDG&E

 Legend
 RECAP ELCC • DR bids in the • Inclusion of SCE’s SEP
 NQC Net of PRM and T&D (Aug) summer increased by and LCR and SDG&E’s
 ~60 MW on avg CBP, BIP and AC
 NQC Net of PRM and T&D (Jul)
 • ELCCs increase by 4- programs
 NQC Net of PRM and T&D (Sep)
 90 MW • First-in ELCC increases
 Max DR Bid (Aug) • NQCs reduced by by ~90 MW, Last-in by
 Max DR Bid (Jul) ~50 MW ~45 MW
 Max DR Bid (Sep)

 49
Difference In NQC and Bids from 2019 to
 2020
IoU Program LCA NQC before T&D and PRM Max Bid
 Jul Aug Sep Jul Aug Sep
PG&E BIP All LCAs
 CBP Bay Area
 CBP CAISO System
 CBP Greater Fresno
 CBP Humboldt
 CBP Kern
 CBP North Coast
 CBP Sierra
 CBP Stockton Increase
 SAC Bay Area
 SAC CAISO System
 SAC Greater Fresno
 SAC Kern
 No Change
 SAC North Coast
 SAC Sierra
 SAC Stockton Decrease
SCE API Big Creek
 API CAISO System
 API LA Basin
 BIP Big Creek
 BIP CAISO System
 BIP LA Basin
 CBP Big Creek
 CBP CAISO System
 CBP LA Basin
 SDP Big Creek
 SDP CAISO System
 SDP LA Basin

 50
First-in ELCC Based on 2020 DR Bids
 Axis Axis
 change change

Legend
 RECAP ELCC
 NQC Net of PRM and T&D (Aug)
 NQC Net of PRM and T&D (Jul)
 NQC Net of PRM and T&D (Sep)
 Max DR Bid (Aug)
 Max DR Bid (Jul)
 Max DR Bid (Sep)

 ELCC as a % of NQC PG&E SCE SDG&E
 Net of PRM and T&D

 July 80% 84% 63%

 Aug 82% 79% 54%

 Sep 86% 83% 49%

 51
First-in ELCC Based on 2020 DR Bids
PG&E Programs
 ELCC as a % of Aug NQC

 NQCs for some program-LCAs were not disclosed due to small
 number of participants

 52
First-in ELCC Based on 2020 DR Bids
SCE Programs
 ELCC as a % of Aug NQC

 53
First-in ELCC Based on 2020 DR Bids
SDG&E Programs
 ELCC as a % of Aug NQC

 54
Appendix
NQCs as a Basis for Comparison with ELCCs NQCs are calculated using load impacts (LI) , i.e. load reductions expected during peak conditions, calculated in line with the Load Impact Protocols. Load impacts are grossed up for transmission and distribution losses, as also the 15% PRM, owing to demand response being a demand reduction measure. = ∗ 1.15 ∗ & [1] Load impacts for the year 2019 are referenced from the CPUC’s RA Compliance documents[2] Load impacts were defined on an LCA level from 1 pm to 6 pm, Apr to Oct, and from 4 pm to 9 pm in the rest of the year, both with and without line losses The timing has since been revised to 4 pm to 9 pm year-round[3] [1] CPUC 2019 RA Guide [2] CPUC 2019 IoU DR Program Totals [3] CPUC 2020 IOU LIP Workshop 56
Key Question: What Call and Duration Characteristics are Needed to Maximize DR ELCC? E3 tested how two primary constraints impact the ELCC of demand response resources • Max # of calls per year – How many times can a system operator dispatch a demand response resource? • Max duration of each call – How long does the demand response resource respond when called by the system operator? Key Assumptions: • DR portfolio is divided into 100 MW units, each of which can be dispatched independently of the other – In other words, 2-hour-100 MW units can be dispatched in sequence to avoid an unserved energy event 100 MW deep and 4 hours long • Each 100 MW unit is available 24/7, at full capacity of 100 MW, subject to call constraints defined above to establish a clear baseline for ELCC %’s • Pure Shed DR; No shifting of load; No snap-backs 57
Average ELCC as a function of DR Capacity
 on the System

 First-in ELCC Last-in ELCC

 ELCC Call constraints ELCC Call constraints
 (% of DR (% of DR
 1 hour/call 1 hour/call 4 hours/call 4 hours/call 4 hours/call 6 hours/call 8 hours/call 8 hours/call 1 hour/call 1 hour/call 4 hours/call 4 hours/call 4 hours/call 6 hours/call 8 hours/call 8 hours/call
 capacity) 1 call/year 4 calls/year 1 call/year 4 calls/year 20 calls/year 10 calls/year 4 calls/year 20 calls/year
 capacity) 1 call/year 4 calls/year 1 call/year 4 calls/year 20 calls/year 10 calls/year 4 calls/year 20 calls/year

2 2,195 46% 51% 70% 94% 95% 95% 94% 95% 2,195 59% 73% 77% 100% 100% 100% 100% 100%

0 3,000 40% 47% 61% 92% 94% 96% 93% 96% 3,000 52% 65% 67% 99% 100% 100% 99% 100%
 DR capacity (MW)

 DR capacity (MW)
1 4,000 36% 42% 52% 78% 80% 86% 80% 86% 4,000 44% 57% 63% 93% 98% 98% 93% 98%

9 5,000 32% 39% 46% 73% 75% 83% 74% 84% 5,000 39% 52% 59% 87% 94% 94% 88% 94%

 10,000 21% 30% 31% 51% 60% 65% 53% 70% 10,000 27% 39% 38% 61% 75% 75% 61% 80%

 20,000 14% 21% 20% 33% 46% 44% 35% 52% 20,000 19% 28% 25% 39% 53% 50% 40% 57%

 ELCC Call constraints ELCC Call constraints
 (% of DR (% of DR
 1 hour/call 1 hour/call 4 hours/call 4 hours/call 4 hours/call 6 hours/call 8 hours/call 8 hours/call 1 hour/call 1 hour/call 4 hours/call 4 hours/call 4 hours/call 6 hours/call 8 hours/call 8 hours/call
 capacity) 1 call/year 4 calls/year 1 call/year 4 calls/year 20 calls/year 10 calls/year 4 calls/year 20 calls/year
 capacity) 1 call/year 4 calls/year 1 call/year 4 calls/year 20 calls/year 10 calls/year 4 calls/year 20 calls/year

2 2,195 41% 43% 72% 95% 95% 98% 98% 98% 2,195 35% 37% 52% 69% 69% 77% 93% 93%

0 3,000 38% 40% 66% 92% 93% 98% 97% 98% 3,000 30% 33% 48% 65% 65% 72% 90% 90%
 DR capacity (MW)

 DR capacity (MW)

3 4,000 35% 37% 56% 83% 88% 91% 85% 91% 4,000 25% 28% 43% 61% 61% 65% 88% 88%

0 5,000 32% 35% 50% 74% 80% 86% 77% 88% 5,000 22% 25% 41% 57% 57% 60% 80% 82%

 10,000 23% 30% 33% 52% 62% 67% 55% 71% 10,000 14% 19% 30% 43% 43% 47% 54% 56%

 20,000 15% 22% 22% 35% 47% 46% 37% 53% 20,000 11% 15% 22% 29% 30% 31% 32% 32%

 58
Incremental ELCC as a function of DR
 Capacity on the System

 First-in ELCC Last-in ELCC

 ELCC Call constraints ELCC Call constraints
 (% of DR (% of DR
 1 hour/call 1 hour/call 4 hours/call 4 hours/call 4 hours/call 6 hours/call 8 hours/call 8 hours/call 1 hour/call 1 hour/call 4 hours/call 4 hours/call 4 hours/call 6 hours/call 8 hours/call 8 hours/call
 capacity) 1 call/year 4 calls/year 1 call/year 4 calls/year 20 calls/year 10 calls/year 4 calls/year 20 calls/year
 capacity) 1 call/year 4 calls/year 1 call/year 4 calls/year 20 calls/year 10 calls/year 4 calls/year 20 calls/year

2 2,195 46% 51% 70% 94% 95% 95% 94% 95% 2,195 59% 73% 77% 100% 100% 100% 100% 100%

0 3,000 25% 36% 37% 86% 93% 99% 90% 99% 3,000 33% 42% 37% 96% 100% 100% 96% 100%
 DR capacity (MW)

 DR capacity (MW)
1 4,000 22% 29% 26% 34% 39% 57% 40% 58% 4,000 22% 34% 53% 77% 92% 92% 77% 92%

9 5,000 15% 23% 22% 52% 56% 69% 51% 73% 5,000 16% 31% 40% 62% 77% 78% 67% 78%

 10,000 11% 22% 16% 30% 45% 47% 32% 57% 10,000 14% 26% 18% 35% 56% 56% 34% 66%

 20,000 7% 11% 10% 16% 31% 23% 17% 33% 20,000 11% 18% 12% 18% 30% 25% 18% 34%

 ELCC Call constraints ELCC Call constraints
 (% of DR (% of DR
 1 hour/call 1 hour/call 4 hours/call 4 hours/call 4 hours/call 6 hours/call 8 hours/call 8 hours/call 1 hour/call 1 hour/call 4 hours/call 4 hours/call 4 hours/call 6 hours/call 8 hours/call 8 hours/call
 capacity) 1 call/year 4 calls/year 1 call/year 4 calls/year 20 calls/year 10 calls/year 4 calls/year 20 calls/year
 capacity) 1 call/year 4 calls/year 1 call/year 4 calls/year 20 calls/year 10 calls/year 4 calls/year 20 calls/year

2 2,195 41% 43% 72% 95% 95% 98% 98% 98% 2,195 35% 37% 52% 69% 69% 77% 93% 93%

0 3,000 26% 28% 42% 81% 84% 96% 94% 96% 3,000 9% 16% 29% 50% 50% 51% 78% 78%
 DR capacity (MW)

 DR capacity (MW)

3 4,000 25% 28% 25% 53% 71% 72% 48% 72% 4,000 10% 12% 29% 48% 48% 47% 82% 82%

0 5,000 19% 25% 24% 39% 48% 65% 45% 76% 5,000 11% 13% 34% 42% 42% 38% 46% 55%

 10,000 15% 26% 17% 31% 45% 49% 33% 53% 10,000 6% 13% 20% 28% 28% 33% 29% 30%

 20,000 8% 13% 11% 17% 32% 25% 19% 36% 20,000 9% 11% 13% 15% 18% 16% 9% 8%

 59
2019 vs 2030 Loss of Load Events
Frequency of Event Occurrence Distribution of Event Duration

 Events become longer
 as energy-limited
 resources increase
 No significant change
 in frequency of events

 Distribution of Event Magnitude

 Events become larger
 as availability of energy
 becomes more variable

 60
Overview of Data The 2019 PG&E and SCE DR ELCC results focus on “event-based” DR programs, as opposed to passive measures like dynamic pricing applicable throughout a season/year • Does not consider SDG&E or Demand Response Auction Mechanism (DRAM) resources which are a significant portion of the data DR portfolio, due to data limitations Data sources for RECAP ELCC calculations 1. Hourly PG&E DR bid data for 2019 – BIP, CBP, and SAC – PSPS outage logs were provided by PG&E and used by E3 to identify and then fill gaps in DR bid data 2. Hourly SCE DR bid data for 2019 – API, BIP, CBP, and SDP 61
Data Benchmarking E3 used utility data directly from PG&E and SCE for two reasons • CAISO does not have data by utility program • Wanted to ensure results were not predicated on CAISO data E3 benchmarked utility data to CAISO data to ensure the veracity of the data • Data generally benchmarked well • A few inconsistencies were spotted in the RDRR data: – In ~1.3% of hours in the year, DR bids present in PG&E’s data are missing in CAISO’s data. Technical glitches in transmitting/recording systems may explain this. – DR bids in SCE data were slightly lower than bids recorded in CAISO data across significant portions of the year. Underlying reason is currently not known. 62
Benchmarking of 2019 Bid Data from PG&E and CAISO PDR data from the two sources are identical There are a few hours (114 out of 8760) where RDRR data is inconsistent: • Several instances across each of the 24 hours of the day • These are hours where data is missing in the CAISO dataset • Unclear if a bid was not placed, or if it was placed but not recorded due to technical glitches Example comparison for one of the subLAPs over the entire year and a couple of days in specific 63
Benchmarking of 2019 Bid Data from SCE and CAISO data PDR data from the two sources are identical Inconsistencies exist in RDRR data – unclear if the difference is systematic and attributable to a single factor, like treatment of line- losses Example comparisons for 2 subLAPs- across the entire year and across a couple of days in specific 64
Extrapolation of DR Bid Data In order to calculate the ELCC of a DR program or portfolio, RECAP must predict how these programs will perform over many different conditions and weather years Therefore, E3 must extend actual 2019 data over the entire historical temperature record as a data requirement for the E3 RECAP model backcasted CAISO bid data based on historical weather actual CAISO bid data ..... 1950 1951 1952 2014 2015 2016 2017 2018 2019 historical weather years complete time-series of DR bids is needed as an input into the E3 RECAP model In response to stakeholder feedback from the May 3 CAISO ESDER meeting, E3 modified the backcasting approach to include temperature for temperature-dependent air conditioner DR programs • More details on this process and methodology can be found in the appendix 65
Process of Extrapolating Actual DR Bid
 Data to Entire Weather Record

Get daily max, min and average temperature data (1950-2019) from NOAA for
every climate zone that DR program bids come from

Use weather-informed day-matching to match every day from Jan 1, 1950 - Dec
31, 2018 to the “most similar” day from Jan 1, 2019 – Dec 31, 2019

Use day-matching results to extrapolate hourly DR bids from just 2019 to 1950-
2019

Aggregate extrapolated DR bids by program-LCA to allow for comparison with
respective NQCs

Each aggregated shape dictates the hourly availability of the corresponding DR
program-LCA combination in RECAP

 66
Simple Day-Matching Algorithm for CBP, BIP and API DR Programs As in the previous phase of this project, E3 used a simple day-matching approach for CBP, BIP and API programs DR bid forecasts for these programs were not as strong a function of the temperature as Smart AC For an individual DR program and a particular day, ‘d’ in a simulated year, pick one day out of +/- 3 calendar days, ‘d+3’ to ‘d-3’ of the same type (workday/holiday) from the actual 2019 data at random 2019 Thu d-4 Ja Fri dn -3 Simulated Ja Year Sat d18 n- 2 Ja Mon d-1 Sun d19 n- 1 Ja Tue d Mon 20 nd Ja Wed d+1 Tue 21 n d+1 Ja Wed 22 n d+2 Thu 23 d+3 Thu d+4 67
Weather-informed Day-Matching Algorithm for AC cycling DR Programs Inclusion of weather for air conditioner DR is in direct feedback to stakeholder comments from the May 3, 2020 CAISO ESDER meeting For an individual DR program and a particular day in a simulated year, pick one day out of +/- 10 calendar days of the same type (workday/holiday) from actual 2019 data with the closest Tmax, Tmin and Tavg Applied to PG&E’s Smart AC program and SCE’s Summer Discount Plan program data to account for influence of temperature on DR availability Example weekday in simulated Candidate (2019) days for matching year Holiday/Weekend Most similar weekday 68
Comparison of day matched and real values The Mean Absolute Percentage Error (MAPE) is defined as: Abs(Day−matched value – Actual Value) x 100 Actual Value MAPE is calculated and shown below for July-September, 4 pm to 10 pm 69
Why Day Matching and not Regression? Regression based on temperature, month and day-type couldn’t explain movement in DR bids. Potential reasons could be: • Mismatch in temperature data used by E3 and IoUs. • Not accounting for other explanatory variables that IoUs use in their forecasts. Absence of reliable hourly temperature records going back to 1950 meant only regression for daily DR bids was doable. DR bids are higher despite temperature being lower 70
Assumptions on DR Program
Characteristics

 Utility DR Program Event Duration Max. Events per Max. Events per
 (hours/call) Month Year

 BIP 6 10

 PG&E CBP 6 5

 SAC 6 17

 API 6 25

 BIP 6 10

 CBP 6 5
 SCE
 SDP 6 30

 SEP 4 45

 LCR 4 20

 AC Saver 4 25

 SDG&E CBP 4 6

 BIP 4 10

 71
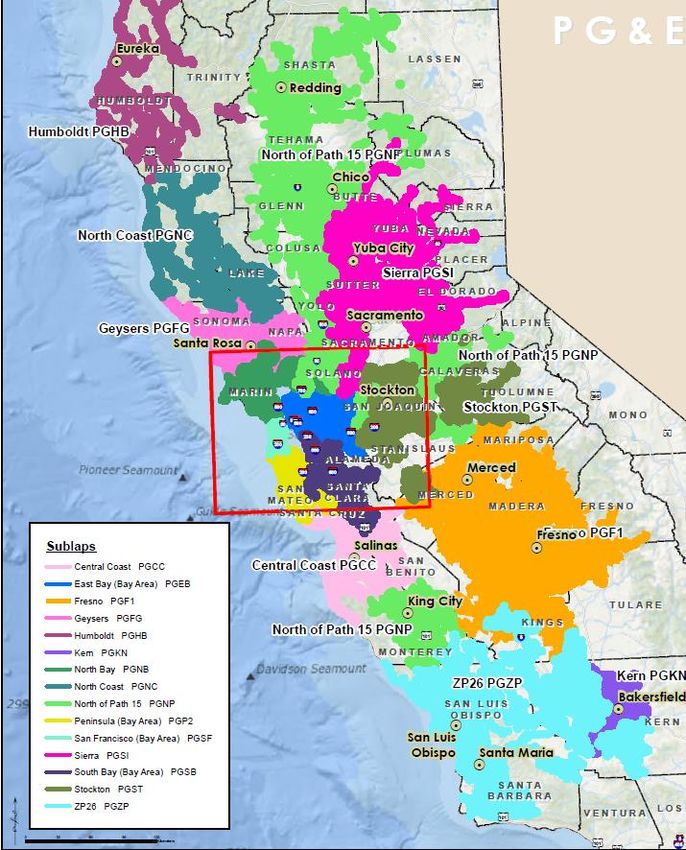
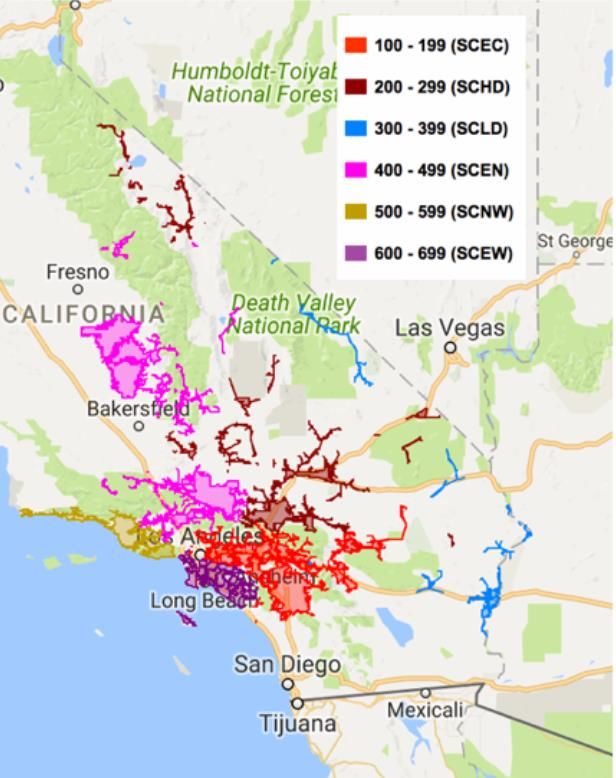
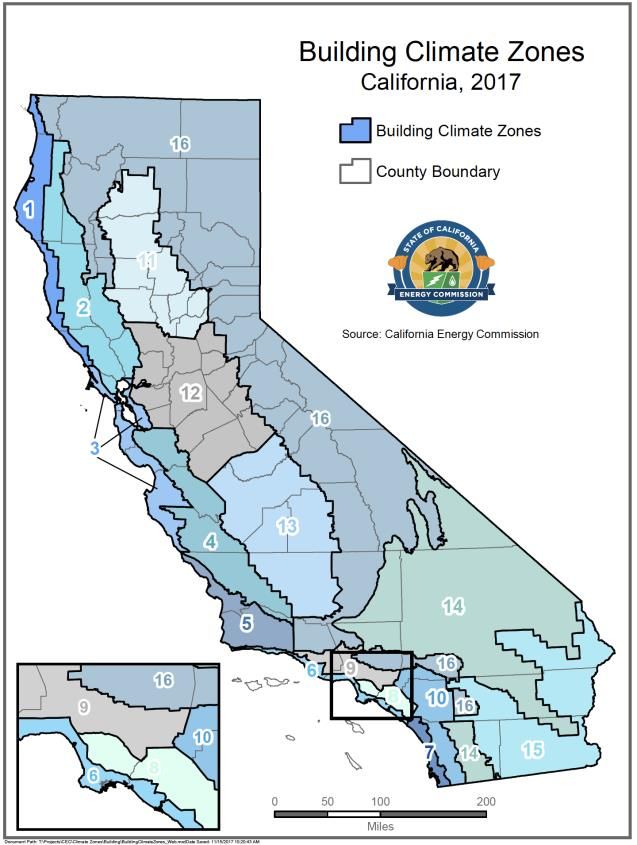
Climate zones and sub-LAPs for reference

 72
Sub-LAPs vs. Local Capacity Areas

 Sub-LAP Sub-LAP (long form) Local Capacity Area
 PGCC PG&E Central Coast Bay Area
 PGEB PG&E East Bay Bay Area
 PGF1 PG&E Fresno Greater Fresno
 PGFG PG&E Fulton-Geysers North Coast/North Bay
 PGHB PG&E Humboldt Humboldt
 PGKN PG&E Kern Kern
 PGNB PG&E North Bay North Coast/North Bay
 PGNC PG&E North Coast North Coast/North Bay
 PGNP PG&E North of Path 15 - non local CAISO System
 PGP2 PG&E Peninsula Bay Area
 PGSB PG&E South Bay Bay Area
 PGSF PG&E San Francisco Bay Area
 PGSI PG&E Sierra Sierra
 PGST PG&E Stockton Stockton

 PGZP PG&E ZP26 (between Path 15 and 26) -non local CAISO System
 SCEC SCE Central LA Basin
 SCEN SCE North (Big Creek) Big Creek/Ventura
 SCEW SCE West LA Basin
 SCHD SCE High Desert CAISO System
 SCLD SCE Low Desert CAISO System
 SCNW SCE North-West (Ventura) Big Creek/Ventura
 SDG1 SDG&E San Diego/Imperial Valley
 VEA VEA CAISO System

 73
You can also read