Detection and classification of unilateral cleft alveolus with and without cleft palate on panoramic radiographs using a deep learning system - Nature
←
→
Page content transcription
If your browser does not render page correctly, please read the page content below

www.nature.com/scientificreports
OPEN Detection and classification
of unilateral cleft alveolus
with and without cleft palate
on panoramic radiographs using
a deep learning system
Chiaki Kuwada1*, Yoshiko Ariji1, Yoshitaka Kise1, Takuma Funakoshi1, Motoki Fukuda1,
Tsutomu Kuwada2, Kenichi Gotoh2 & Eiichiro Ariji1
Although panoramic radiography has a role in the examination of patients with cleft alveolus
(CA), its appearances is sometimes difficult to interpret. The aims of this study were to develop a
computer-aided diagnosis system for diagnosing the CA status on panoramic radiographs using a deep
learning object detection technique with and without normal data in the learning process, to verify
its performance in comparison to human observers, and to clarify some characteristic appearances
probably related to the performance. The panoramic radiographs of 383 CA patients with cleft palate
(CA with CP) or without cleft palate (CA only) and 210 patients without CA (normal) were used to
create two models on the DetectNet. The models 1 and 2 were developed based on the data without
and with normal subjects, respectively, to detect the CAs and classify them into with or without
CP. The model 2 reduced the false positive rate (1/30) compared to the model 1 (12/30). The overall
accuracy of Model 2 was higher than Model 1 and human observers. The model created in this study
appeared to have the potential to detect and classify CAs on panoramic radiographs, and might be
useful to assist the human observers.
Cleft lip and palate (CLP) is one of the most common types of congenital maxillofacial lesions1,2. The frequency
of babies born with CLP is approximately 1 in 500 in J apan3. Although various treatment protocols have been
applied, soft tissue parts such as the lip and mucous membrane covering the hard plate are surgically treated
within a relatively short period from b irth4. Hard palatoplasty with bony transplant is frequently applied in
patients with cleft alveolus (CA) to stabilize the maxillary segments, provide bony support for the teeth adjacent
to the cleft, provide additional support to the lip and nose, and induce the canine e ruption5,6. This surgery is
usually performed at age 8–10 years, when the maxilla has grown sufficiently for the surgery. Therefore, patients
need regular follow-up consisting of physical and imaging examinations for a long period. In this regard, pano-
ramic radiography plays an important role in the repeated evaluation of cleft status because of its lower cost
and radiation exposure levels than other modalities, such as computed tomography (CT) and cone-beam CT
for dental u se7,8. Focusing on the bony structures, patients with CA are divided into two types: CA with and
without cleft palate (CP)9.
Cleft status including the classification can be easily identified by physical examination. However, for radi-
ologists who interpret many radiographs and make many reports of their findings as routine work in a hospital
radiology department, it is difficult to physically examine the patients. Therefore, radiologists have to estimate
the patients’ status only based on radiographs. In this regard, panoramic radiography plays an essential role.
However, it is sometimes difficult to interpret the images, especially for inexperienced radiologists, because
of the overlap of the cervical spine and the narrow panoramic image layer, resulting in misdiagnoses as other
radiolucent diseases and conditions, such as cysts, tumors, and fossa between the alveolar yokes of the central
and lateral incisors. Moreover, even for experienced radiologists, it may be difficult to distinguish patients with
CA with CP from those without CP. Therefore, if a computer-aided detection/diagnosis (CAD) system for the
1
Department of Oral and Maxillofacial Radiology, Aichi Gakuin University School of Dentistry, Nagoya,
Japan. 2Division of Radiological Technology, Dental Hospital, Aichi-Gakuin University, Nagoya, Japan. *email:
chiaki@dpc.agu.ac.jp
Scientific Reports | (2021) 11:16044 | https://doi.org/10.1038/s41598-021-95653-9 1
Vol.:(0123456789)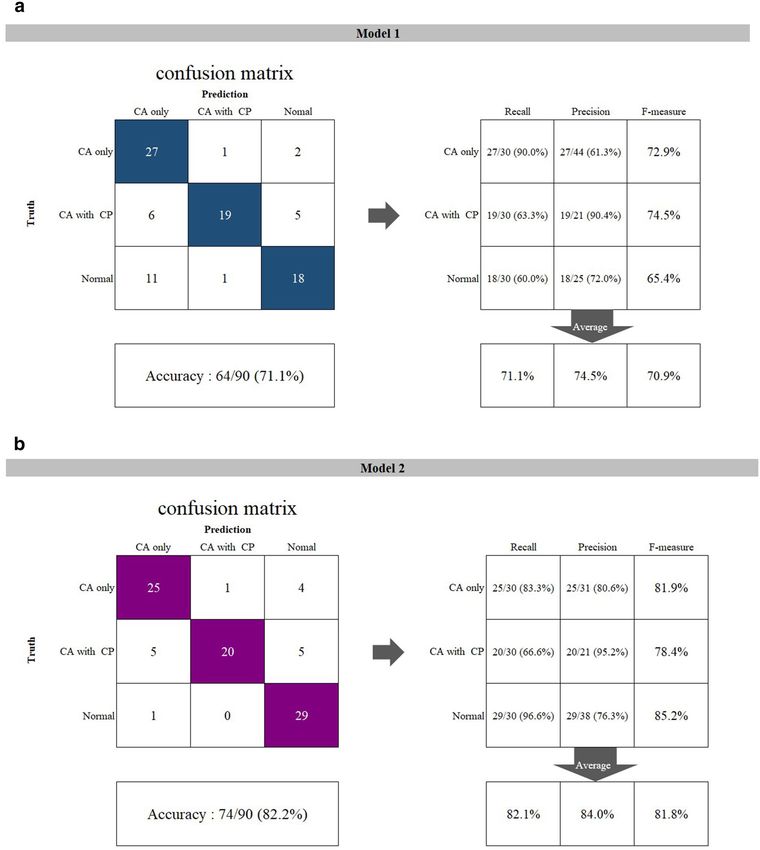
www.nature.com/scientificreports/
diagnosis of patients with CLP on panoramic radiographs can be established, it could greatly support such
diagnosis, especially for inexperienced radiologists.
Deep learning (DL) algorithms using convolutional neural networks (CNNs) can detect and classify the
features of certain objects, and they have been applied to CAD systems for diagnosis based on panoramic
radiographs10,11. However, there have been no previous reports on such systems for patients with CLP. Some
characteristic appearance features other than radiolucent areas directly indicating the CAs, on panoramic radio-
graphs, such as the difference in the inferior line level of the piriform aperture and some findings of the maxillary
lateral incisors of the affected side have been reported for patients with CA12–16, and they may be related to DL
performance. Although a new technique to clarify the areas on which DL models focus has been i ntroduced17,18,
the findings contributing to DL performance are generally as unclear as a ‘black box’. Therefore, the above
appearance features were analyzed in relation to the three groups (CA only, CA with CP and normal groups)
in the present study.
The aims of the present study were to develop a CAD system for diagnosis of CLP on panoramic radiographs
using a deep learning object detection technique with and without normal data in the learning process, to verify
the DL model’s performance, and to clarify some characteristic appearance features probably related to the
performance. Moreover, the usefulness of DL models was verified by comparing their performances with those
by human observers.
Material and method
Informed consent was obtained from all patients for being included in the study. This study was approved by
ethics committee of Aichi Gakuin University (No. 496) and was performed in accordance with the tenets of the
Declaration of Helsinki.
Patients. The panoramic radiographs of 383 patients (169 female and 214 male) with unilateral CA that were
acquired between August 2004 and July 2020 were selected from our hospital image database retrospectively.
All patients were verified as having unilateral CA by medical records and CT or cone-beam CT examinations.
The mean age of both male and female patients was 9.3 years. Of the 383 patients, 174 had solely CA and were
assigned as the CA only group, whereas 209 had CA with CP and were designated as the CA with CP group.
The CA only group was differentiated from the CA with CP group by referring to the patients’ medical records
and CT images. Cases in which the cleft was limited to the anterior area of the incisive foramen on the most
inferior axial CT slice, where the foramen was visible, were assigned to the CA only group. Cases in which the
cleft extended posteriorly beyond the incisive foramen were assigned to the CA with CP group. Patients who
had received surgical interventions for bony structures around the cleft before the first panoramic examination
were excluded. In most patients, panoramic examinations were performed several times before bony transplant
surgery. The panoramic images taken just before the transplant were selected for the present study. As controls,
210 panoramic radiographs matching the mean age and sex distributions of patients were selected from the same
database during the same period. These patients, who were assigned as the normal group in the present study,
were examined for other purposes, such as the evaluation of unerupted permanent teeth and pre-examination
for orthodontic treatment.
The panoramic radiographs were exposed using an AUTO III NTR unit (Asahi Roentgen Industry, Kyoto,
Japan), with a tube voltage of 75 kV, tube current of 12 mA and exposure time of 12 s or a Veraview Epocs unit
(J. Morita Mfg. Corp., Kyoto, Japan), with the tube voltage of 75 kV, tube current of 8 mA and exposure time
of 16.2 s.
DL architecture. The DL system was created on Ubuntu Linux operating system version 16.04.2. The work-
station had a GeForce 1080Ti GPU with 11GB of memory (NVIDIA, Santa Clara, CA). The deep learning pro-
cess was performed using a customized DetectNet built in the Digits version 5.0 (NVIDIA, Santa Clara, CA;
https://developer.ndivia.com/digits) training system. The Adam (adaptive moment estimation) solver was used
for the training process with 0.0001 as the base learning rate. DetectNet has five main parts: data ingestion and
augmentation, a fully convolutional network, loss function measurement, bounding box clustering, and mean
average precision calculation19.
Development of learning models. Two models (models 1 and 2) were created. The panoramic radio-
graphs were downloaded from the database in JPEG format, and all images were cropped to 900×900 pixels. In
each group (including the CA only, CA with CP, and normal groups), 30 images were randomly assigned to test
dataset, and the remaining images, which included the training (approximately 80% of the remaining data) and
validation datasets, were used to create the learning models (Table 1).
In model 1, only two groups—CA only and CA with CP—comprised the training and validation sets (i.e., the
normal group was not included). Rectangular regions of interest (ROIs) were set on the training and validation
images to encompass the area of the CA according to the following methods. The superior margin was set at the
level of the inferior line of the piriform aperture on the contralateral healthy side, and the inferior margin was
set at the alveolar ridge. The medial end was set at the alveolar ridge between the central incisors, and the distal
end was set at the most distal portion of the piriform aperture. The coordinates of the upper left (x1, y1) and
lower right (x2, y2) corners of the ROIs were labeled using ImageJ (National Institute of Health, Bethesda, MD,
USA) (Fig. 1a) and converted to text form (Fig. 1b). The CA only group and the CA with CP group were assigned
as class 1 and class 2, respectively. Model 2 included the normal group’s data in addition to those of the patient
groups. Only the labels were created for the classifications as class 0 (not the coordinates). In both models, 1000
epochs of the training process was performed. Inference was then applied to the test data, including all three
Scientific Reports | (2021) 11:16044 | https://doi.org/10.1038/s41598-021-95653-9 2
Vol:.(1234567890)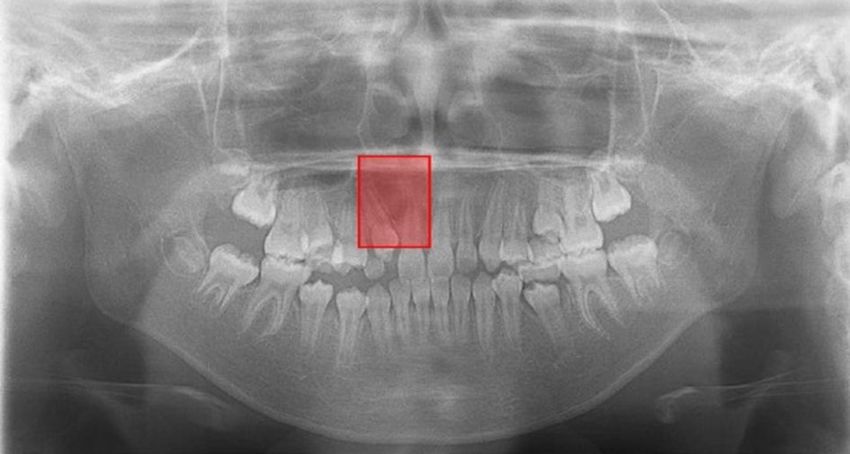
www.nature.com/scientificreports/

                                                Dataset
                                   Group        Training     Validating   Testing   Total
                                   CA only      115          29           30        174
                                   CA with CP   143          36           30        209
                                   Normal       144          36           30        210
                                   Total        402          101          90        593

                                  Table 1.  Summary of datasets (number of panormaic images). CA cleft alveolus, CP cleft palate.

                                  Figure 1.  (a) The label including the cleft alveolus is created by setting a rectangular region of interest (ROI).
                                  The superior distal corner was set at the point including the equivalent level to the contralateral normal line
                                  of the piriform aperture’s lower limit and the most distal portion of the piriform aperture. The inferior medial
                                  corner was set at the alveolar ridge between the central incisors. (b) The coordinates of upper left and lower
                                  right corners of the ROIs were converted to text form.

                                  groups, using the created learning models. When the model detected a CA, the detected area was shown as a
                                  bounding box. Red and blue boxes were shown for the CA only group and the CA with CP group, respectively.

                                  Comparison with diagnostic performance of human observers. To compare the DL model perfor-
                                  mances with those by human observers, two radiologists, who had more than four years experiences of interpre-
                                  tating panoramic radiographs, classified the same testing data, which were used to verify the DL performances,
                                  into one of three groups, namely, CA only, CA with CP, or Normal group.

                                  Analysis of image appearance features. To determine the characteristic image appearance features
                                  that could influence the DL models’ performance, the image datasets used for the training process (i.e., the train-
                                  ing and validation datasets) were analyzed regarding two structures: the inferior line of the piriform aperture
                                  and the lateral incisor on the affected side. The former was evaluated based on its visibility and relative level
                                  to the contralateral or unaffected side. The latter was evaluated according to whether the tooth was present
                                  or absent, and regarding findings of microdontia, un-eruption and medial inclination. These evaluations were
                                  performed by two radiologists (YA and EA) with more than 20-years experiences of interpreting panoramic
                                  appearances. The final determinations were reached by consensus after discussion when the evaluations differed
                                  between the radiologists.

                                  Statistical analysis. The differences in ratios between two groups were tested by chi-square test, with p <
                                  0.05 established as the threshold of significant difference.

                                  Results
                                  The results showed that no images had two or more bounding boxes on a panoramic image, indicating that only
                                  one box was detected per image when the model estimated a certain area as a cleft. All detected boxes sufficiently
                                  included the areas where a cleft was observed or would be in the normal group. Moreover, the boxes’ medial
                                  limit was not beyond the median line, and the distal limit was located medially to the canine. The superior and
                                  inferior limits were almost same as those of annotation area (namely, the inferior line of the piriform aperture
                                  and alveolar ridge). Therefore, we concluded that all test images could be predictively classified by both models
                                  into one of the three groups (CA only, CA with CP, or normal). Confusion matrix analyses were performed for
                                  both models (Fig. 2a,b), and the recall, precision, and F-measure values were calculated. The F-measure denotes
                                  the harmonic mean of recall and precision. Regardless of cleft status (CA only vs. CA with CP group), 53 (88.3%)
                                  and 51 (85.0%) of the 60 subjects who truly had a cleft could be detected by models 1 and 2, respectively. No
                                  difference was found between the models (p = 0.7883). Model 1 incorrectly assigned 12 (40%) of the 30 normal

Scientific Reports |   (2021) 11:16044 |                  https://doi.org/10.1038/s41598-021-95653-9                                                    3

                                                                                                                                                 Vol.:(0123456789)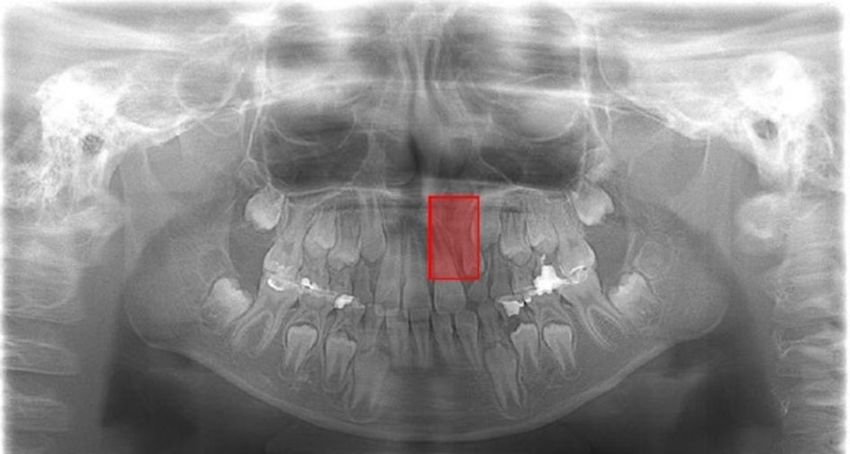
www.nature.com/scientificreports/

                                            Figure 2.  The confusion matrices of (a) model 1, (b) model 2, (c) human observer 1, and (d) human observer 2
                                            and their calculated performance.

          Scientific Reports |   (2021) 11:16044 |              https://doi.org/10.1038/s41598-021-95653-9                                              4

Vol:.(1234567890)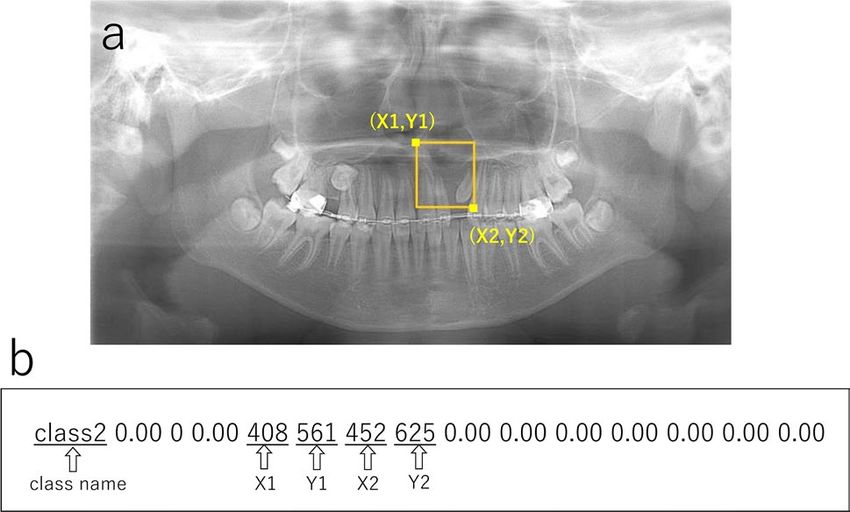
www.nature.com/scientificreports/

                                  Figure 2.  (continued)

                                  subjects as having a cleft, whereas only 1 normal subject was incorrectly assigned by model 2. No difference
                                  was found between models 1 and 2 in terms of the recall in the CA only group (p = 0.7041) or the CA with CP
                                  group (p = 0.7866), but the recall of the normal group was significantly higher in model 2 (p = 0.0017). Model
                                  2 showed higher values of all three indices. The overall accuracy was higher in model 2 (82.2%) than model
                                  1 (71.1%), but no significant difference (p = 0.0780) was found. The recall of the CA with CP group was poor
                                  (0.667) even in model 2.
                                      Regarding human observers, confusion matrix analyses were also performed (Fig. 2c,d). Two observers
                                  showed a similar tendency for the performances. The overall accuracy of each human observer was higher than
                                  Model 1, however, lower than Model 2. The recall of Normal group was high, whereas those of the CA only group
                                  and the CA with CP group were poor in each human observer.
                                      The findings of the inferior line of the piriform aperture were divided into three types (Table 2, Fig. 3a–c).
                                  First, in 184 images, the lines could be observed clearly on the both right and left sides at an equivalent level

Scientific Reports |   (2021) 11:16044 |               https://doi.org/10.1038/s41598-021-95653-9                                                 5

                                                                                                                                             Vol.:(0123456789)
www.nature.com/scientificreports/
Finding
Group Clear and equivalent levela Clear and inferior levelb Obscure or invisible Total
CA only 20 (13.9%) 108 (75.0%) 16 (11.1%) 144 (100%)
CA with CP 1 (0.6%) 41 (22.9%) 137 (76.5%) 179 (100%)
Normal 163 (90.6%) 0 (0.0%) 17 (9.4%) 180 (100%)
Table 2. Findings on the inferior line of the piriform aperture (number of images). a The inferior line of the
piriform aperture could be observed clearly on the both right and left sides at an equivalent level. b The inferior
line of the piriform aperture on the affected side was clearly visible but located at an inferior level relative to the
unaffected side, or the line on a side was located at an inferior level relative to the contralateral side in normal
subjects.
Figure 3. The findings of the inferior line of the piriform aperture were divided into three types. (a) is “clear
and equivalent level”, (b) is “clear and inferior level”, and (c) is “obscure or invisible”.
and were assigned as “clear and equivalent level”. Second, 149 lines on the affected side were clearly visible but
located at an inferior level relative to those on the unaffected side. This finding was defined as “clear and inferior
level”. Third, 170 images were assigned as “obscure or invisible”, as they showed an obscure or invisible line on the
affected side or on at least one side. The distributions of these three findings were significantly different among
the three groups (p < 0.001). In the CA only group, most of the lines showed the finding of “clear and inferior
Scientific Reports | (2021) 11:16044 | https://doi.org/10.1038/s41598-021-95653-9 6
Vol:.(1234567890)www.nature.com/scientificreports/
Appearance
Group Absence* Microdontia* Unerupted* Medial inclination*
CA only 51/144 (35.4%) 75/144 (52.1%) 68/144 (47.2%) 16/144 (11.1%)
CA with CP 77/179 (43.0%) 81/179 (45.3%) 77/179 (43.0%) 33/179 (18.4%)
Normal 19/180 (10.6%) 0/180 (0.0%) 5/180 (2.8%) 0/180 (0.0%)
Table 3. Findings of the lateral incisor on the affected side (number of images). *Difference between
distributions is significant among three groups (p < 0.001).
Figure 4. A correctly detected and classified case. In a patient belonging to the CA only group, the left side
CA was correctly detected and classified into the CA only group, showing a red bounding box. The inferior line
of the piriform aperture on the affected side is situated at an inferior level relative to that on the contralateral
normal side. The left lateral incisor shows findings of unerupted microdontia.
Figure 5. A correctly detected but erroneously classified case. On a panoramic image of a patient with solely
CA (CA only group), the cleft area was correctly detected but is misclassified into the CA with CP group. The
lateral incisor shows findings of microdontia with slight medial inclination, but the inferior piriform aperture
line is obscure on the affected side, and the radiolucency of the cleft area is relatively high.
level,” whereas the findings of “obscure or invisible” and “clear and equivalent level” were predominantly observed
in the CA with CP and normal groups, respectively.
The findings of the lateral incisor on the affected side are summarized in Table 3. The distributions of all four
findings were significantly different among the three groups (p < 0.001). The observation rates of all findings
were low in the normal group relative to those in the CA only and CA with CP groups.
Examples of model-predicted results are shown in Figs. 4, 5, 6 and 7. Figure 4 shows a result from the CA
only group with a correctly detected and correctly classified bounding box. The result in Fig. 5 was correctly
detected as having CA but falsely classified into the CA with CP group. Figure 6 shows a falsely detected area in
a normal group subject. In Fig. 7, the cleft could not be detected.
Discussion
The detection function of DL systems on panoramic radiographs has been studied for various lesions and
conditions20–27. Regarding vertical root fracture20 and dental implants21, detection models have been created
with annotations of only fractured teeth or implant sites. Normal teeth without fractures or replacement by
implants were not included in the training, validation, or test datasets, probably because many normal teeth were
included in each panoramic image. Several authors reported relatively high detection sensitivity (recall in the
Scientific Reports | (2021) 11:16044 | https://doi.org/10.1038/s41598-021-95653-9 7
Vol.:(0123456789)www.nature.com/scientificreports/
Figure 6. A falsely detected normal case. In a normal subject (without CA), a red bounding box is shown on
the right incisor region. The inferior piriform aperture lines on the both sides are obscure and superimposed by
the radiopaque lines caused by the hard palate. The right lateral incisor is missing (probably congenitally), and
the canine shows medial inclination, so the space between these teeth is relatively wide. The model probably
mistakenly recognizes the canine as the lateral incisor.
Figure 7. An undetected case with CA. The panoramic image of a subject with CA (CA only group) on the
right side shows no bounding box. The inferior piriform aperture lines are observed at almost equal levels, and
the right lateral incisor shows no characteristic findings.
present study) for maxillary and mandibular cyst-like l esions22–25. Ariji et al.22 and Watanabe et al.23 created and
tested their DetectNet models without annotation of normal subjects’ data. Hyunwoo et al.26 and Odeuk et al.27
built models using the You Only Look Once system without normal subjects’ data and tested them with datasets
including normal subjects without cyst-like lesions. In all of those studies, the training and validation processes
were performed without normal subjects. Therefore, we created a model without normal subjects in addition to
the model developed with normal subjects’ data, whereas both models’ test datasets included normal subjects.
Model 1’s results showed that 12 (40%) of the 30 normal subjects in the test set were falsely assigned as having
a cleft, whereas only one of those subjects was assigned to the CA only group by model 2 (which included the
normal subjects in the learning process). Although the cause of this discrepancy between cyst-like lesions and
CAs could not be completely elucidated, the characteristics of the lesions’ appearances might contribute to the
difference. Cyst-like lesions showed definite borders on radiographs, but cleft areas were frequently represented
as ill-defined radiolucency because of the superimposition of surrounding structures, such as unerupted per-
manent teeth.
The present results showed relatively high detection sensitivity (recall in the present study) compared with
the corresponding values of other studies on panoramic r adiographs22,23, regardless of the cleft status for which
the values were determined (CA only or CA with CP groups). However, even model 2 had a low recall value of
0.667 for the CA with CP group. This problem should be solved in future investigation and could be accomplished
by increasing the size of the training dataset.
Regarding human observers, the recall of normal group was high, however, overall accuracy was lower than
Model 2. This result suggested the deep learning model, which included the normal group for learning process,
had the potential to assist the human observers as a CAD system.
Although the most important feature for CA detection might be radiolucent area at the maxillary incisor
region, the frequently reported characteristic appearance other than radiolucent area, such as findings of the lat-
eral incisor on the affected side and of the inferior line of the piriform aperture, were analyzed to clarify potential
features related to the created models’ performance. Regarding the inferior line of the piriform aperture, Hansen
et al.12 reported that the line was positioned 2.9 mm lower on the cleft side than on the noncleft side, whereas no
difference was noted between the right and left sides in the normal group (mean difference: 2 mm difference defined as abnormal.
Scientific Reports | (2021) 11:16044 | https://doi.org/10.1038/s41598-021-95653-9 8
Vol:.(1234567890)www.nature.com/scientificreports/
Consequently, the appearance was divided into three types (clear and inferior level, obscure or invisible groups,
and clear and equivalent level), and the ratios were 75%, 76%, and 90% for the CA only, CA with CP, and normal
groups, respectively. This result suggests that the findings of the inferior line of the piriform aperture might be
related to both classification performance and detection performance. Regarding the lateral incisor, microdontia
were observed in 48% of patients with CA, but not in any patients in the normal group. Therefore, the presence of
microdontia might be related to the model’s detection performance of CA. Similarly, unerupted lateral incisors
were observed in 44% of patients with CA but only 2.7% of patients in the normal group, suggesting that this
factor is also related to the models’ performance.
The present study had several limitations. First, patients with bilateral CA were excluded because it was
difficult to clearly visualize the inferior line of the piriform aperture in such patients’ panoramic images. This
would result in failure of the determination of the superior limit of the ROIs for the learning process. Future
study should be conducted to address these patients. In this regard, it might be effective to test the model created
in the present study by using the panoramic radiographs of patients with bilateral CAs. Second, the numbers of
training and test data were so small that the results cannot be generalized although it was difficult to estimate
an appropriate sample size 28. Future research should be planned with larger datasets obtained from multiple
hospitals through the use of different panoramic machines. Third, other CNNs and functions, such as semantic
segmentation, should be used to improve the model’s performance.
Conclusions
The model developed in the present study appears to have the potential to detect CAs and classify them into CA
only and CA with CP groups on panoramic radiographs, which may be useful as assisting the performance of
human observers. Additionally, some performance-related differences between three experimental groups (CA
only, Ca with CP and normal groups) were clarified.
Received: 28 January 2021; Accepted: 28 July 2021
References
1. Sato, Y. et al. Population attributable fractions of modifiable risk factors for nonsyndromic orofacial clefts: A prospective cohort
study from the Japan Environment and Children’s Study. J. Epidemiol. https://doi.org/10.2188/jea.JE20190347 (2021) ((e-pub
ahead of print, accessed Dec 22, 2020)).
2. Ono, S., Ishimaru, M., Matsui, H., Fushimi, K. & Yasunaga, H. Effect of hospital volume on outcomes of surgery for cleft lip and
palate. J. Oral Maxillofac. Surg. 73, 2219–2224 (2015).
3. Omiya, T., Ito, M. & Yamazaki, Y. Disclosure of congenital cleft lip and palate to Japanese patients: Reported patient experiences
and relationship to self-esteem. BMC Res. Notes. 7, 924 (2014).
4. Raghavan, U., Vijayadev, V., Rao, D. & Ullas, G. Postoperative management of cleft lip and palate surgery. Fac. Plast. Surg. 34,
605–611 (2018).
5. Murthy, A. & Lehman, J. Secondary alveolar bone grafting: An outcome analysis. Can. J. Plast. Surg. 14, 172–174 (2006).
6. Kim, K., Kim, S. & Baek, S. Change in grafted secondary alveolar bone in patients with UCLP and UCLA. Angle Orthod. 78,
631–640 (2008).
7. Pinheiro, F., Drummond, R., Frota, C., Bartzela, T. & Santos, P. Comparison of early and conventional autogenous secondary
alveolar bone graft in children with cleft lip and palate: A systematic review. Orthod. Craniofac. Res. 23, 385–397 (2020).
8. Jacobs, R. et al. Pediatric cleft palate patients show a 3- to 5-fold increase in cumulative radiation exposure from dental radiology
compared with an age- and gender-matched population: A retrospective cohort study. Clin. Oral Investig. 22, 1783–1793 (2018).
9. Allori, A., Mulliken, J., Meara, J., Shusterman, S. & Marcus, J. Classification of cleft lip/palate: Then and now. Cleft Palate Craniofac.
J. 54, 175–188 (2017).
10. Nakamoto, T. et al. A computer-aided diagnosis system to screen for osteoporosis using dental panoramic radiographs. Dentomaxil-
lofac. Radiol. 37, 274–281 (2008).
11. Nakamoto, T., Taguchi, A., Verdonschot, R. & Kakimoto, N. Improvement of region of interest extraction and scanning method
of computer-aided diagnosis system for osteoporosis using panoramic radiographs. Oral Radiol. 35, 143–151 (2019).
12. Hansen, K. & Mehdinia, M. Isolated soft tissue cleft lip: The influence on the nasal cavity and supernumerary laterals. Cleft Palate
Craniofac. J. 39(3), 322–326 (2002).
13. Menezes, C. et al. Nonsyndromic cleft lip and/or palate: A multicenter study of the dental anomalies involved. J. Clin. Exp. Dent.
10, e746–e750 (2018).
14. Pegelow, M., Alqadi, N. & Karsten, A. The prevalence of various dental characteristics in the primary and mixed dentition in
patients born with non-syndromic unilateral cleft lip with or without cleft palate. Eur. J. Orthod. 34, 561–570 (2012).
15. Ribeiro, L., Neves, L., Costa, B. & Gomide, M. Dental anomalies of the permanent lateral incisors and prevalence of hypodontia
outside the cleft area in complete unilateral cleft lip and palate. Cleft Palate Craniofac. J. 40, 172–175 (2003).
16. Tan, E., Kuek, M., Wong, H., Ong, S. & Yow, M. Secondary dentition characteristics in children with nonsyndromic unilateral cleft
lip and palate: A retrospective study. Cleft Palate Craniofac. J. 55, 582–589 (2018).
17. Selvaraju, R. et al. Grad-CAM: Visual explanations from deep networks via gradient-based localization. Int. J. Comput. Vis. 128,
336–359 (2020).
18. Muramatsu, C. et al. Tooth detection and classification on panoramic radiographs for automatic dental chart filing: Improved
classification by multi-sized input data. Oral Radiol. 37(1), 13–19 (2021).
19. Tao, A., Barker, J., & Sarathy, S. Detect Net: Deep Neural Network for Object Detection in DIGITS. https://d evblo
gs.n
vidia.c om/p
aral
lelforall/detectnet-deep-neural-network-objectdetection-digits/. Accessed 22 Dec 2020 (2016).
20. Fukuda, M. et al. Evaluation of an artificial intelligence system for detecting vertical root fracture on panoramic radiography. Oral
Radiol. 36, 337–343 (2020).
21. Takahashi, T. et al. Identification of dental implants using deep learning-pilot study. Int. J. Implant Dent. 22(6), 53 (2020).
22. Ariji, Y. et al. Automatic detection and classification of radiolucent lesions in the mandible on panoramic radiographs using a deep
learning object detection technique. Oral Surg. Oral Med. Oral Pathol. Oral Radiol. 128, 424–430 (2019).
23. Watanabe, H. et al. Deep learning object detection of maxillary cyst-like lesions on panoramic radiographs: Preliminary study.
Oral Radiol. https://doi.org/10.1007/s11282-020-00485-4 (2020) ((e-pub ahead of print, accessed Dec 22, 2020)).
24. Poedjiastoeti, W. & Suebnukarn, S. Application of convolutional neural network in the diagnosis of jaw tumors. Healthc. Inform.
Res. 24, 236–241 (2018).
Scientific Reports | (2021) 11:16044 | https://doi.org/10.1038/s41598-021-95653-9 9
Vol.:(0123456789)www.nature.com/scientificreports/
25. Lee, J., Kim, D. & Jeong, S. Diagnosis of cystic lesions using panoramic and cone beam computed tomographic images based on
deep learning neural network. Oral Dis. 26, 152–158 (2020).
26. Yang, H. et al. Deep learning for automated detection of cyst and tumors of the jaw in panoramic radiographs. J. Clin. Med. 9, 1839
(2020).
27. Kwon, O. et al. Automatic diagnosis for cysts and tumors of both jaws on panoramic radiographs using a deep convolution neural
network. Dentomaxillofac. Radiol. 49, 20200185 (2020).
28. Balki, I. et al. Sample-size determination methodologies for machine learning in medical imaging research: A systematic review.
Can. Assoc. Rdiol. J. 70(4), 344–353 (2019).
Acknowledgements
We thank Richard Lipkin, PhD, from Edanz Group (https://en-author-s ervices.e danz.c om/a c) for editing a draft
of this manuscript.
Author contributions
C.K.: Contributed to conception, conducted the experiment involving the deep learning method, compiled the
results, analysed and interpreted data, and wrote the manuscript. E.A.: Supervised the whole experiment and
the manuscript with instructions and advices. Y.K. and T.F.: Contributed to image evaluation. Y. A. and M.F.:
Contributed to data analysis and interpretation, and provided their expertise. T.K.: Contributed to conception
and data collection. K.G.: Contributed to data collection.
Competing interests
The authors declare no competing interests.
Additional information
Correspondence and requests for materials should be addressed to C.K.
Reprints and permissions information is available at www.nature.com/reprints.
Publisher’s note Springer Nature remains neutral with regard to jurisdictional claims in published maps and
institutional affiliations.
Open Access This article is licensed under a Creative Commons Attribution 4.0 International
License, which permits use, sharing, adaptation, distribution and reproduction in any medium or
format, as long as you give appropriate credit to the original author(s) and the source, provide a link to the
Creative Commons licence, and indicate if changes were made. The images or other third party material in this
article are included in the article’s Creative Commons licence, unless indicated otherwise in a credit line to the
material. If material is not included in the article’s Creative Commons licence and your intended use is not
permitted by statutory regulation or exceeds the permitted use, you will need to obtain permission directly from
the copyright holder. To view a copy of this licence, visit http://creativecommons.org/licenses/by/4.0/.
© The Author(s) 2021
Scientific Reports | (2021) 11:16044 | https://doi.org/10.1038/s41598-021-95653-9 10
Vol:.(1234567890)You can also read