Different gene rearrangements of the genus Dardanus (Anomura: Diogenidae) and insights into the phylogeny of Paguroidea
←
→
Page content transcription
If your browser does not render page correctly, please read the page content below
www.nature.com/scientificreports
OPEN Different gene rearrangements
of the genus Dardanus (Anomura:
Diogenidae) and insights
into the phylogeny of Paguroidea
Ying Zhang1, Lei Meng2, Liming Wei1, Xinting Lu1, Bingjian Liu1, Liqin Liu1, Zhenming Lü1,
Yang Gao2 & Li Gong1*
Complete mitochondrial genomes (mitogenomes) can provide useful information for phylogenetic
relationships, gene rearrangement, and molecular evolution. In this study, the complete mitogenomes
of two hermit crabs, Dardanus arrosor and Dardanus aspersus, were sequenced for the first time and
compared with other published mitogenomes of Paguroidea. Each of the two mitogenomes contains
an entire set of 37 genes and a putative control region, but they display different gene arrangements.
The different arrangements of the two mitogenomes might be the result of transposition, reversal,
and tandem duplication/random loss events from the ancestral pancrustacean pattern. Genome
sequence similarity analysis reveals the gene rearrangement in 15 Paguroidea mitogenomes. After
synteny analysis between the 15 Paguroidea mitogenomes, an obvious rearranged region is found in
D. aspersus mitogenome. Across the 13 protein-coding genes (PCGs) tested, COI has the least and ND6
has the largest genetic distances among the 15 hermit crabs, indicating varied evolution rates of PCGs.
In addition, the dN/dS ratio analysis shows that all PCGs are evolving under purifying selection. The
phylogenetic analyses based on both gene order and sequence data present the monophyly of three
families (Paguridae, Coenobitidae, and Pylochelidae) and the paraphyly of the family Diogenidae.
Meanwhile, the phylogenetic tree based on the nucleotide sequences of 13 PCGs shows that two
Dardanus species formed a sister group with five Coenobitidae species. These findings help to better
understand the gene rearrangement and phylogeny of Paguroidea, as well as provide new insights
into the usefulness of mitochondrial gene order as a phylogenetic marker.
The metazoan mitochondrial genome (mitogenome) is typically a closed circular double-stranded DNA mol-
ecule. It is relatively small (15–20 kb) and contains 13 protein-coding genes (PCGs), 22 transfer RNA genes
(tRNAs), two ribosomal RNA genes (12S and 16S), and an AT-rich region (also called control region, CR)1.
Owing to some unique features like small genome size, conserved gene content, absence of introns, maternal
inheritance, low level of recombination, and fast rate of evolution2,3, the mitogenome has been extensively used
in population genetics, comparative genomics, and phylogenetic s tudies4–6. Besides, comparative analyses of
the complete mitogenomes of closely related taxa can deepen the understanding of gene rearrangements and
evolutionary relationships7,8.
Generally, the gene order in most vertebrate mitogenomes is considered conserved. However, extensive
mitochondrial gene rearrangements have been observed in invertebrate mitogenomes, such as in c ephalopods9,
bivalves10, insects11, and crabs12,13. The gene rearrangement within a lineage has been supposed to be phylogeneti-
cally informative; therefore, comparative analysis of mitochondrial gene order has been proved to be a valuable
phylogenetic tool. For example, Yuan et al.14 compared the mitochondrial gene arrangements of six heterodont
bivalves and concluded that Sanguinolaria (Psammobiidae) is not monophyletic. By gene order comparisons
of echinoderms, Smith et al.15 provided evidence that the sea cucumbers should group with sea urchins and
sea stars with brittle stars. Besides, Morrison et al.16 reconstructed a phylogeny for decapod taxa based on gene
rearrangements and DNA sequences. Their findings supported five independent origins of the crab-like form
1
National Engineering Laboratory of Marine Germplasm Resources Exploration and Utilization, National
Engineering Research Center for Facilitated Marine Aquaculture, Marine Science and Technology College, Zhejiang
Ocean University, Zhoushan 316022, China. 2School of Fishery, Zhejiang Ocean University, Zhoushan 316022,
China. *email: gongli1027@163.com
Scientific Reports | (2021) 11:21833 | https://doi.org/10.1038/s41598-021-01338-8 1
Vol.:(0123456789)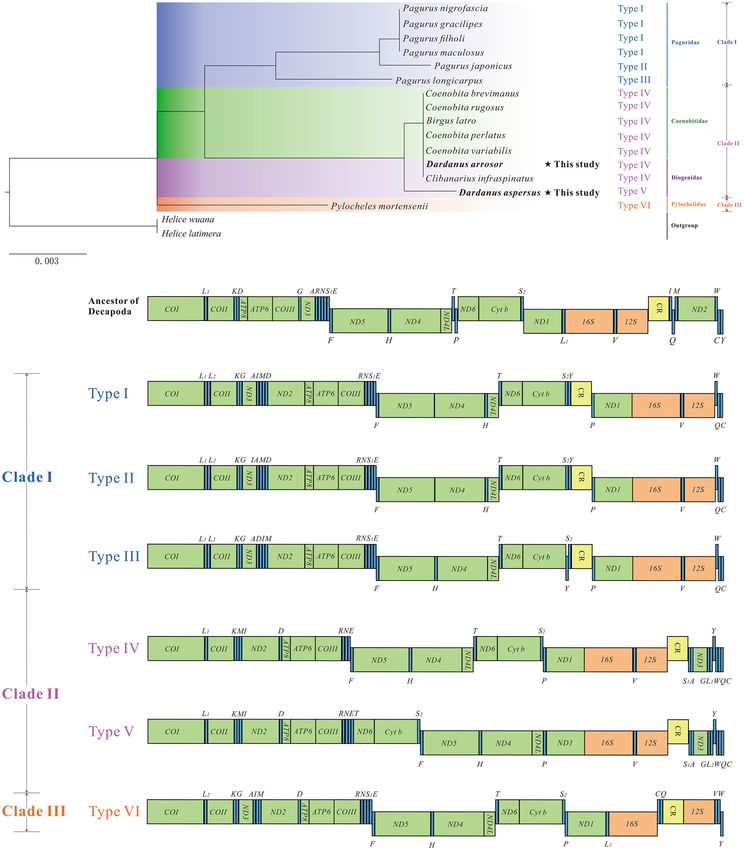
www.nature.com/scientificreports/
and confirmed the utility of mitochondrial gene rearrangements in phylogenetic reconstruction. So far, three
main types of gene rearrangement events have been observed in the mitogenomes of animals, including trans-
location, shuffling, and inversion17–20. Correspondingly, four mechanisms have been proposed to account for
mitogenomic rearrangements, including tandem duplication/random loss (TDRL) model21, tRNA mis-priming
model22, intramitochondrial recombination model23, and tandem duplication/non-random loss m odel24.
The infraorder Anomura consists of approximately 2450 extant species25 with a broad range of ecological
specializations and with various lineages having successfully adapted to freshwater, terrestrial, and diverse marine
environments6. The latest classification scheme divides Anomura into Aegloidea, Chirostyloidea, Galatheoidea,
Hippoidea, Lithodoidea, Lomisoidea, and Paguroidea. Hermit crabs (the superfamily Paguroidea Latreille, 1802)
consist of Coenobitidae, Diogenidae, Paguridae, Parapaguridae, Pylochelidae and Pylojacquesidae, with more
than 1100 species inhabiting diverse biotopes from intertidal to deep s eas26. They represent an intermediate
group of crustaceans from Macrura to Brachyura, which occupy an important position in crustacean e volution27.
However, their evolutionary relationships at many taxonomic levels are still waiting for researchers to r esolve28–30.
Diogenidae Ortmann, 1892 is the second largest family of the superfamily Paguroidea. According to WoRMS
(http://www.marinespecies.org/), the family Diogenidae has 22 genera and 482 species in total. Among them,
the genus Dardanus Paulson, 1875 is one of the most diverse genera within Diogenidae. Previous studies of this
genus mainly focused on morphology31,32, with almost no attention given to molecular phylogeny. To date, the
phylogenetic location of the genus Dardanus has not been well resolved.
Accordingly, in the present study, we newly sequenced and annotated the complete mitogenomes of two
hermit crabs, D. arrosor and D. aspersus. These are the first published mitogenomes of the genus Dardanus.
Combined with 13 available Paguroidea mitogenomes, we performed a comparative mitogenomics analysis, in
order to: (a) investigate the characteristics of Paguroidea mitogenomes; (b) estimate the phylogenetic information
of mitochondrial gene rearrangements; (c) reconstruct the phylogeny of Paguroidea that could lay a foundation
for further evolutionary studies.
Materials and methods
Sampling, DNA extraction, mitogenome sequencing, and assembly. Specimens of D. arrosor
and D. aspersus were collected from Zhoushan Province, China (29° 45′ 32″ N, 121° 45′ 30″ E). Specimens were
immediately preserved in 95% ethanol until DNA extraction. The SQ Tissue DNA Kit (OMEGA) was used to
extract the total genomic DNA from muscle tissue following the manufacturer’s instructions. The genomic DNA
was sent to Shanghai Origingene Biopharm Technology Co., Ltd. for library preparation and high-throughput
sequencing. The libraries were constructed by using the VAHTS Universal Plus DNA Library Prep Kit, with an
insert size of 150 bp. Paired-end sequencing with a read length of 150 bp was performed on an Illumina Hiseq
6000 platform. Adapters and low-quality bases were removed using cutadapt v1.1633 with the following param-
eters: -q 20 -m 20. Trimmed reads shorter than 50 bp were discarded. Quality control of raw and trimmed reads
was performed using FastQC v0.11.5 (http://www.bioinformatics.babraham.ac.uk/projects/fastqc/). The filtered
clean data were assembled and mapped to complete mitogenome sequence using NOVOPlasty v2.7.234.
Mitogenome annotation and sequence analysis. The newly assembled mitogenomes of D. arro-
sor and D. aspersus were annotated using the software of Sequin (version 15.10, http://www.ncbi.nlm.nih.gov/
Sequin/). The boundaries of protein-coding and ribosomal RNA genes were performed using NCBI-BLAST
(http://blast.ncbi.nlm.nih.gov). Transfer RNA genes were manually plotted, according to the secondary struc-
ture predicted by the MITOS Web S erver35 and tRNAscan-SE 1.2136. The control region was determined by the
locations of adjacent genes. Finally, circular mitogenome maps of D. arrosor and D. aspersus were drawn with the
BLAST Ring Image Generator (BRIG) v0.9537.
The base composition and relative synonymous codon usage (RSCU) were obtained using MEGA X 38. The
strand asymmetry was calculated using the following formulas: AT-skew = (A − T)/(A + T); GC-skew = (G − C)/
(G + C)39. Furthermore, we chose the complete mitogenome of Pagurus filholi as the reference genome for com-
parative genomic analysis. Genome sequence similarity among the 15 Paguroidea species was carried out using
the BRIG tool. Synteny analysis between the genomes was performed using Mauve v2.4.040. To estimate the
evolutionary-selection constraints on 13 PCGs in the superfamily Paguroidea, the nonsynonymous (dN) and
synonymous (dS) substitution rates were calculated using Mega X. The genetic distances of 13 PCGs were also
estimated using Mega X based on the Kimura 2-parameter (K2P) substitution model.
Mitochondrial gene order comparisons and phylogeny. CREx41 was used to compare the mitochon-
drial gene order and infer the gene rearrangement scenarios based on common intervals. CREx considers four
types of rearrangement events: reversals (R), transpositions (T), reverse transpositions (RT), and tandem-dupli-
cation-random-losses (TDRL). MLGO web server42 was used to infer a phylogeny from gene order data.
Phylogenetic analysis. Phylogeny of the Paguroidea was inferred based on 13 available complete mitog-
enomes expanded with the two newly determined ones (Table 1). The species Helicana wuana and H. latim-
era from Grapsoidea were used as outgroups. Fasta files with the nucleotide sequences for all 13 PCGs were
extracted from the GenBank files using PhyloSuite43. The MAFFT program44 integrated into PhyloSuite was exe-
cuted to align multiple sequences in normal-alignment mode, and ambiguously aligned regions were identified
and moved by Gblocks45. Subsequently, the sequences were concatenated into a single alignment and converted
into input files (Phylip and Nexus format) for phylogenetic analyses. Phylogenetic trees were built under maxi-
mum likelihood (ML) and Bayesian inference (BI) methods. The ML analysis was conducted using IQ-TREE46,
under an ML + rapid bootstrap (BS) algorithm with 1000 replicates. The BI analysis was conducted in MrBayes
Scientific Reports | (2021) 11:21833 | https://doi.org/10.1038/s41598-021-01338-8 2
Vol:.(1234567890)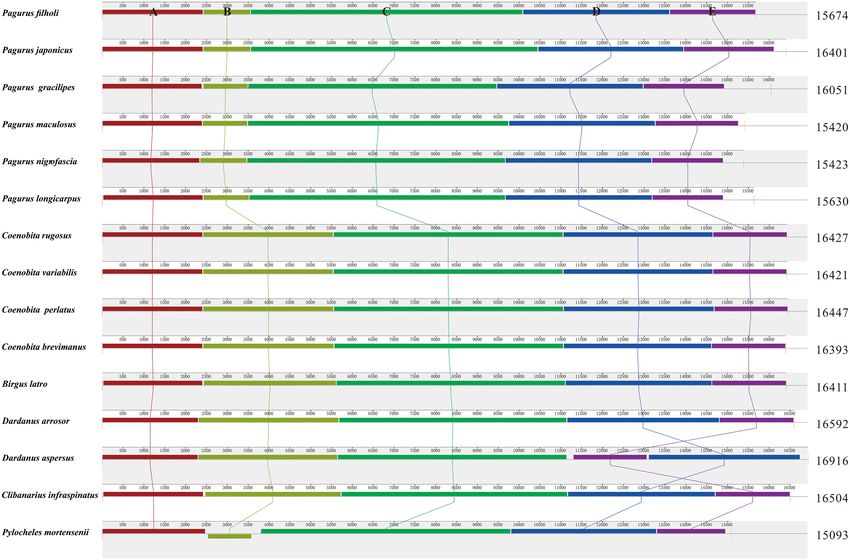
www.nature.com/scientificreports/
Species Family Superfamily Length (bp) Accession No References
Pagurus filholi Paguridae Paguroidea 15,674 LC222528 48
Pagurus japonicus Paguridae Paguroidea 16,401 LC222532 48
Pagurus gracilipes Paguridae Paguroidea 16,051 LC222534 48
Pagurus maculosus Paguridae Paguroidea 15,420 LC222524 48
Pagurus nigrofascia Paguridae Paguroidea 15,423 LC222531 48
Pagurus longicarpus Paguridae Paguroidea 15,630 NC_003058 49
Coenobita rugosus Coenobitidae Paguroidea 16,427 KY352235 6
Coenobita variabilis Coenobitidae Paguroidea 16,421 KY352236 6
Coenobita perlatus Coenobitidae Paguroidea 16,447 KY352234 6
Coenobita brevimanus Coenobitidae Paguroidea 16,393 NC_050386 50
Birgus latro Coenobitidae Paguroidea 16,411 NC_045091 51
Dardanus arrosor Diogenidae Paguroidea 16,592 MW147148 This study
Dardanus aspersus Diogenidae Paguroidea 16,916 MW715812 This study
Clibanarius infraspinatus Diogenidae Paguroidea 16,504 NC_025776 52
Pylocheles mortensenii Pylochelidae Paguroidea 15,093 KY352242 6
Helice wuana Varunidae Grapsoidea 16,359 NC_034995 Outgroup
Helice latimera Varunidae Grapsoidea 16,246 NC_033865 Outgroup
Table 1. Basic information of 15 Paguroidea species and two outgroups used in this paper.
3.2.647 with 3 × 10⁶ metropolis-coupled Markov Chain Monte Carlo (MCMCMC) generations, sampling every
1000 generations, and the first 25% of the generations were discarded as burn-in. To guarantee the stationarity
had been reached, the average standard deviation of split frequencies was set below 0.01.
Results
General features of D. arrosor and D. aspersus mitogenomes. The complete mitogenomes of D.
arrosor and D. aspersus are 16,592 bp and 16,916 bp in length, respectively (GenBank accessions MW147148 and
MW715812) (Figs. S1, S2, Tables 1, 2). Each mitogenome contains a typical set of 37 genes (13 PCGs, 22 tRNAs,
and two rRNAs) and a putative CR. Within these genes, eight PCGs (COI, COII, ND2, ATP8, ATP6, COIII, ND6,
and Cyt b) and 11 tRNAs (tRNA-LeuTAG, Lys, Met, Ile, Asp, Arg, Asn, Glu, Thr, SerTGA, and Tyr) are encoded by
the heavy (H-) strand, while five PCGs (ND5, ND4, ND4L, ND1, and ND3), 11 tRNAs (tRNA-Phe, His, Pro, Val,
SerTCT, Ala, Gly, LeuTAA, Trp, Gln, and Cys), and two rRNAs (16S and 12S rRNA) are encoded by the light (L-)
strand. But the gene order of the two mitogenomes is different.
There are 214 intergenic nucleotides (IGNs) dispersed in 22 locations for D. arrosor, 596 IGNs in 22 loca-
tions for D. aspersus. The longest IGN is 64 bp (between tRNA-His and ND4) and 176 bp (between ND4L and
tRNA-Pro) for D. arrosor and D. aspersus, respectively (Tables 2, 3). Meanwhile, 27 overlapping nucleotides are
located in seven pairs of neighboring genes for both mitogenomes. These overlapping nucleotides vary in length
from 1 to 7 bp, and the longest overlap is located between ATP8 and ATP6 as well as ND4 and ND4L (Tables 2,
3). The base composition of D. arrosor is A = 33.3%, T = 34.6%, C = 15.7%, G = 16.4% and that of D. aspersus is
A = 33.4%, T = 32.6%, C = 15.7%, G = 18.3%. The AT content is 67.9% in D. arrosor and 66.0% in D. aspersus, thus
exhibiting a strong AT bias (Tables S1, S2).
Except for ND5 (uses GTG as the start codon) and ND3 (uses TTG as the start codon) in D. aspersus mitog-
enome (Tables 2, 3), the remaining PCGs initiate with typical ATN codons. As for the stop codon, the majority
of PCGs stop with TAA or TAG except for ND5 (uses a single T as the stop codon) and ND6 (uses GAC as the
stop codon) in the two mitogenomes (Tables 2, 3). The GC-skew values of five PCGs (ND5, ND4, ND4L, ND1,
and ND3) are positive, indicating they are encoded by the L-strand, whereas the remaining eight exhibit negative
values, indicating they are encoded by the H-strand (Tables S1, S2).
Twenty-two tRNAs of D. arrosor and D. aspersus mitogenomes are scattered throughout the entire mitog-
enome (Tables 2, 3). The total length of 22 tRNAs is 1455 bp in D. arrosor and 1460 bp in D. aspersus (Tables S1,
S2). All of the tRNAs can be folded into typical cloverleaf secondary structures except for the tRNA-Ser (TCT)
in the two mitogenomes (Figs. S3, S4). The lack of DHU arm in tRNA-Ser (TCT) is thought to be a common
phenomenon in metazoan m itogenomes12,53. The 16S rRNA and 12S rRNA genes of D. arrosor and D. aspersus
are located between ND1 and tRNA-Val and between tRNA-Val and CR, respectively. The AT content of the two
rRNAs is 73.3% in D. arrosor, which is higher than that of D. aspersus (70.1%) (Tables S1, S2).
Codon usage bias in Paguroidea mitogenomes. Codon usage bias is a phenomenon in which specific
codons are used more frequently than other synonymous codons by certain organisms during the translation
of genes to proteins. In this study, the relative synonymous codon usage (RSCU) of 15 hermit crabs is roughly
identical. Except for Pagurus longicarpus and Pylocheles mortensenii, which miss codons, the other 13 species
have all 62 available codons. The lost codons usually belong to GC-rich codon-families (Fig. S5, Table S3). The
RSCU values for the codons NNU and NNA are usually greater than one, suggesting a strong AT bias in the third
Scientific Reports | (2021) 11:21833 | https://doi.org/10.1038/s41598-021-01338-8 3
Vol.:(0123456789)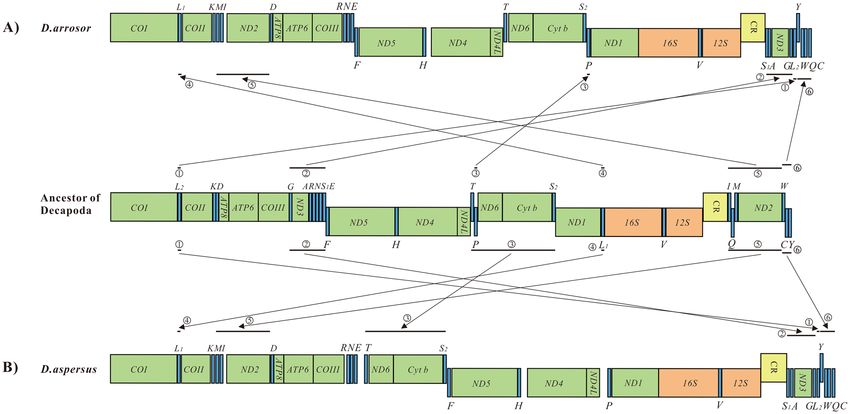
www.nature.com/scientificreports/
Position
Gene From To Length (bp) Amino acid Start/stop codon Anticodon Intergenic region Strand
COI 1 1539 1539 512 ATG/TAA −5 H
Leu (L1) 1535 1597 63 TAG 4 H
COII 1602 2294 693 230 ATG/TAG 6 H
Lys (K) 2301 2367 67 TTT 8 H
Met (M) 2376 2443 68 CAT 7 H
Ile (I) 2451 2514 64 GAT 52 H
ND2 2567 3568 1002 333 ATT/TAG 4 H
Asp (D) 3573 3637 65 GTC 0 H
ATP8 3638 3796 159 52 ATT/TAG −7 H
ATP6 3790 4464 675 224 ATG/TAA −1 H
COIII 4464 5255 792 263 ATG/TAA 11 H
Arg (R) 5267 5333 67 TCG −1 H
Asn (N) 5333 5397 65 GTT 3 H
Glu (E) 5401 5466 66 TTC 1 H
Phe (F) 5468 5532 65 GAA 8 L
ND5 5541 7260 1720 573 ATG/T 0 L
His (H) 7261 7325 65 GTG 64 L
ND4 7390 8820 1431 476 ATG/TAA −7 L
ND4L 8814 9116 303 100 ATG/TAA 2 L
Thr (T) 9119 9185 67 TGT 12 H
ND6 9198 9716 519 172 ATG/GAC −5 H
Cyt b 9712 10,848 1137 378 ATG/TAG −1 H
Ser (S2) 10,848 10,913 66 TGA 2 H
Pro (P) 10,916 10,982 67 TGG 3 L
ND1 10,986 11,915 930 309 ATT/TAG 0 L
16S 11,916 13,322 1407 0 L
Val (V) 13,323 13,391 69 TAC 1 L
12S 13,393 14,190 798 0 L
CR 14,191 15,686 1496 0 H
Ser (S1) 15,687 15,753 67 TCT 0 L
Ala (A) 15,754 15,815 62 TGC 5 L
ND3 15,821 16,168 348 115 ATT/TAG 3 L
Gly (G) 16,172 16,237 66 TTC 1 L
Leu (L2) 16,239 16,304 66 TAA 0 L
Tyr (Y) 16,305 16,373 69 GTA 8 H
Trp (W) 16,382 16,450 69 TCA 0 L
Gln (Q) 16,451 16,515 65 TTG 8 L
Cys (C) 16,524 16,590 67 GCA 1 L
Table 2. Features of the mitochondrial genome of D. arrosors.
codon position (Fig. S5, Table S3). This result supports the hypothesis that the codon usage bias in PCGs and the
AT bias of the third codon position are positively correlated54,55.
Comparative genomic analysis of Paguroidea species. Using the P. filholi mitogenome as the refer-
ence sequence, all available mitogenomes in the superfamily Paguroidea were compared using BRIG. The results
reveal the gene rearrangement in 15 Paguroidea mitogenomes (Fig. 1). The mitogenomes of the family Paguridae
are observed to be fairly conserved, with about 80% sequence identity in most regions (six innermost rings in
Fig. 1). However, the mitogenomes of the species under the families Coenobitidae, Diogenidae, and Pylochelidae
are quite different from the family Paguridae, as can be seen from the larger gap regions in the BRIG map (nine
outermost rings in Fig. 1).
By using the Mauve analysis, we identified five large genomic homologous regions (marked A–E in Fig. 2).
These homologous regions are commonly presented in all 15 Paguroidea mitogenomes. For the B region, it has
the maximum length diversification and is greatly contributed to the genome size variation between Paguroidea
mitogenomes (Fig. 2). In addition, we found that homologous regions D and E are rearranged in D. aspersus
mitogenome. The two homologous regions show an E–D order in D. aspersus mitogenome, while the other
hermit crabs display a D–E order (Fig. 2).
Scientific Reports | (2021) 11:21833 | https://doi.org/10.1038/s41598-021-01338-8 4
Vol:.(1234567890)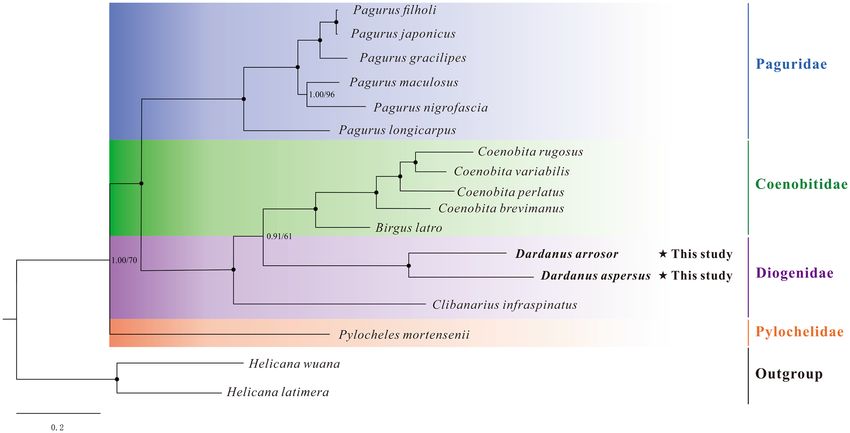
www.nature.com/scientificreports/
Position
Gene From To Length (bp) Amino acid Start/stop codon Anticodon Intergenic region Strand
COI 1 1539 1539 512 ATG/TAA −5 H
Leu (L1) 1535 1599 65 TAG 5 H
COII 1605 2297 693 230 ATG/TAG 8 H
Lys (K) 2306 2373 68 TTT 9 H
Met (M) 2383 2449 67 CAT 7 H
Ile (I) 2457 2523 67 GAT 51 H
ND2 2575 3576 1002 333 ATT/TAA 3 H
Asp (D) 3580 3645 66 GTC 0 H
ATP8 3646 3804 159 52 ATC/TAG −7 H
ATP6 3798 4472 675 224 ATG/TAA −1 H
COIII 4472 5263 792 263 ATG/TAG 17 H
Arg (R) 5281 5346 66 TCG 0 H
Asn (N) 5347 5408 62 GTT 6 H
Glu (E) 5415 5480 66 TTC 163 H
Thr (T) 5644 5711 68 9 H
ND6 5721 6239 519 ATG/GAC −5 H
Cyt b 6235 7371 1137 ATG/TAG −1 H
Ser (S2) 7371 7438 68 3 H
Phe (F) 7442 7504 63 GAA 3 L
ND5 7508 9233 1726 575 GTG/T 0 L
His (H) 9234 9299 66 GTG 87 L
ND4 9387 10,790 1345 467 ATG/TAA −7 L
ND4L 10,784 11,086 303 100 ATG/TAA 176 L
Pro (P) 11,263 11,329 67 TGG 2 L
ND1 11,332 12,261 930 309 ATC/TAA −1 L
16S 12,261 13,660 1400 0 L
Val (V) 13,661 13,729 69 TAC 0 L
12S 13,730 14,530 801 0 L
CR 14,531 15,991 1461 0 H
Ser (S1) 15,992 16,054 63 TCT 6 L
Ala (A) 16,061 16,125 65 TGC 8 L
ND3 16,134 16,478 345 114 TTG/TAG 6 L
Gly (G) 16,485 16,550 66 TTC 9 L
Leu (L2) 16,560 16,627 68 TAA 0 L
Tyr (Y) 16,628 16,697 70 GTA 8 H
Trp (W) 16,706 16,775 70 TCA 0 L
Gln (Q) 16,776 16,838 63 TTG 9 L
Cys (C) 16,848 16,914 67 GCA 1 L
Table 3. Features of the mitochondrial genome of D. asperses.
To estimate the evolutionary-selection constraints on 13 PCGs in the superfamily Paguroidea, we perform dN/
dS analysis for each PCG. The dN/dS ratios for all PCGs are less than 1, indicating that these genes are evolving
primarily under purifying selection. Among them, the lowest dN/dS value (0.113) for COI gene indicates the
strongest purifying selection, whereas the highest dN/dS value (0.707) for ATP8 gene shows a highly relaxed
purifying selection (Fig. 3). In general, the dN/dS values indicate that the evolution of Paguroidea mitogenomes
has been dominated by purifying selection. Besides, we conduct genetic distance analysis for 13 PCGs. COI gene
possesses the least genetic distance (average 0.237), and ND6 gene captures the largest value (average 0.494),
representing the most conserved and variable genes, respectively (Fig. 3).
Mitochondrial gene order and rearrangements. The gene arrangement in the mitogenomes of D.
arrosor and D. aspersus is shown in Fig. 4. The gene order of the two mitogenomes belonging to the same
genus is different. Compared with the gene order in ancestral crustaceans (the pancrutacean ground pattern)
mitogenomes56, the gene order in D. arrosor and D. aspersus mitogenomes underwent large-scale gene rear-
rangements. For D. arrosor, at least six gene clusters (or genes) significantly differ from the typical order, involv-
ing 12 tRNAs (L2, G, A, S1, P, L1, I, Q, M, W, C, and Y), and two PCGs (ND3 and ND2). Of these six gene rear-
rangements, a single L2 is inverted from the downstream of COI in the H-strand to downstream of the G in the
Scientific Reports | (2021) 11:21833 | https://doi.org/10.1038/s41598-021-01338-8 5
Vol.:(0123456789)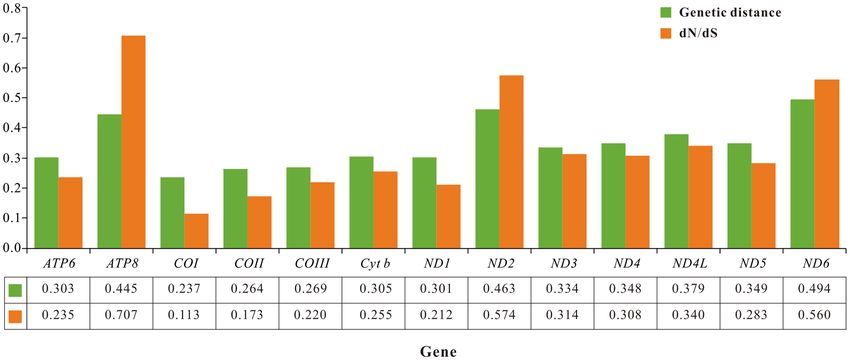
www.nature.com/scientificreports/

                                            Figure 1.  BLAST comparison of all Paguroidea mitogenomes against a reference (P. filholi) generated by Blast
                                            Ring Image Generator (BRIG). The intensity of the ring color denotes the degree of sequence conservation
                                            at that region. Gaps in rings correspond to regions with less than 50% identity to the reference sequence. The
                                            innermost ring to the outermost in this figure is presented as follows: P. filholi, P. japonicus, P. gracilipes, P.
                                            maculosus, P. nigrofascia, P. longicarpus, Coenobita rugosus, C. variabilis, C. perlatus, C. brevimanus, Birgus latro,
                                            D. arrosor, D. aspersus, Clibanarius infraspinatus, and P. mortensenii.

                                            L-strand (Fig. 4A①). The G- ND3- A- S1 cluster is inverted from the downstream of COIII in the H-strand to
                                            downstream of the CR in the L-strand (Fig. 4A②). A single P moves from the downstream of T to downstream
                                            of the S2 (Fig. 4A③). A single L1 is inverted from the downstream of ND1 in the L-strand to downstream of the
                                            COI in the H-strand (Fig. 4A④). The I- Q- M- ND2 cluster is divided into two sections, one (I, M, and ND2) is
                                            shifted to downstream of K. The other (Q) is shifted to the end of the linear mitogenome (Fig. 4A⑤). The W- C-
                                            Y cluster order is changed into Y- W- C order (Fig. 4A⑥). For D. aspersus, there are also at least six gene clusters
                                            (or genes) that differ significantly from the typical order, but the genes involved are different from D. arrosor.
                                            The rearrangement process involves 14 tRNAs (L2, G, A, S1, T, P, S2, L1, I, Q, M, W, C, and Y), and four PCGs
                                            (ND3, ND6, Cyt b, and ND2). Relative to the gene arrangement of D. arrosor mitogenome, the T- P- ND6- Cyt
                                            b- S2 cluster is divided into two sections, one (T, ND6, Cyt b, and S2) is shifted to downstream of E. The other (P)
                                            is shifted to downstream of ND4L (Fig. 4A③). Based on the CREx analysis, transposition, reversal, and TDRL
                                            may be involved in the large-scale gene rearrangements in D. arrosor and D. aspersus mitogenomes (Figs. S6, S7).
                                                The 15 hermit crabs exhibit six types of gene organization (Fig. 5). The mitogenomes of the family Paguridae
                                            possess three types of gene order (Type I, Type II, and Type III in Fig. 5). Relative to the remaining three types
                                            of gene order (Type IV, Type V, and Type VI in Fig. 5), these three types of gene order are more similar. The
                                            mitogenomes of the family Diogenidae possess two types of gene order (Type IV and Type V in Fig. 5). Only the
                                            gene arrangement of one gene cluster (T- ND6- Cyt b- S2) is found to be different between the two gene orders.
                                            For the remaining two families, Coenobitidae and Pylochelidae, each has only one type of gene order (Type IV
                                            and Type VI in Fig. 5). Among them, Coenobitidae shares one of the two gene orders of Diogenidae (Type IV).
                                            These results are consistent with the conclusion from the gene order-based phylogenetic tree (Fig. 5). In the gene
                                            order tree, all Paguridae species cluster into a clade, showing the closest relationship (Clade I). Species of the
                                            family Coenobitidae and Diogenidae are clustered together as a group (Clade II). As the only representative of
                                            the family Pylochelidae (Clade III), P. mortensenii forms a seperate branch. Our results support that comparisons
                                            of mitochondrial gene rearrangements, to some extent, are a useful tool for phylogenetic studies.

          Scientific Reports |   (2021) 11:21833 |               https://doi.org/10.1038/s41598-021-01338-8                                                      6

Vol:.(1234567890)
www.nature.com/scientificreports/
Figure 2. Multiple genome alignments of 15 hermit crabs. The mitogenome of P. filholi is shown at the top as
the reference genome. All genomes are started from the Pro gene. The ruler at the top of each genome shows
nucleotide positions. Within each of the alignments, local collinear blocks are represented by blocks of the same
color connected by lines.
Figure 3. Genetic distance (on average) and dN/dS substitution rates of 13 PCGs among 15 hermit crabs.
Phylogenetic analysis. In the present study, the phylogenetic relationships among Paguroidea were recon-
structed based on the nucleotide sequences of 13 PCGs using maximum likelihood (ML) and Bayesian (BI)
methods. The phylogenetic trees (ML tree and BI tree) show an identical topology; thus, only one topology (BI)
with both support values is displayed (Fig. 6). The results show that D. arrosor and D. aspersus are most closely
related, forming part of the family Diogenidae. Three Diogenidae species are separated into two clades, two
Scientific Reports | (2021) 11:21833 | https://doi.org/10.1038/s41598-021-01338-8 7
Vol.:(0123456789)www.nature.com/scientificreports/
Figure 4. (A) Gene rearrangements in D. arrosor mitogenome; (B) Gene rearrangements in D. aspersus
mitogenome.
Dardanus species cluster together as a clade, and then form a sister group with five Coenobitidae species. While
the remaining one (Clibanarius infraspinatus) forms a separate clade, resulting in the paraphyly of Diogenidae.
Besides, of the four families included in the phylogenetic tree, almost all families except Diogenidae form a
monophyletic clade. However, the paraphyly of the family Pylochelidae was originally proposed by Richter and
Scholtz57 and has been confirmed by many previous r esearches58,59. Since there is only one representative of the
family Pylochelidae in our study, the monophyly of this taxon should be treated with caution.
Discussion
In the present study, our phylogenetic reconstruction based on the nucleotide sequences of 13 PCGs recovered a
robust tree (Fig. 6). For a long time, the phylogenetic status of Diogenidae has been controversial. Most previous
researches based on morphological features considered it to be a paraphyletic clade. But F orest60,61 suggested that
the family Diogenidae is an ancient monophyletic group. In recent years, an increasing number of molecular
studies, including ours, have supported the paraphyly of this taxon. For example, Tsang et al.’s used two nuclear
protein genes to conduct phylogenetic inference and clearly pointed out that the family Diogenidae is a para-
phyletic clade62. In their study, the genus Coenobita (Coenobitidae) is embedded within the branch of the family
Diogenidae. Based on mitochondrial gene sequences, Landschoff and Gouws’s research recovered the paraphyly
of the family Diogenidae as w ell63. However, there are few studies on the phylogenetic relationships among the
genera of the family Diogenidae. Previous studies mainly focused on exploring the phylogenetic relationships
of the infraorder Anomura, involving only a few genera and species of the family Diogenidae. Accordingly,
increased taxon sampling is required to conclusively resolve the phylogenetic relationships within the family
Diogenidae and the superfamily Paguroidea.
Besides, we reconstructed the phylogeny of Paguroidea based on the gene order (Fig. 5). In the family-level
relationships within Paguroidea, the gene order information seems to be reliable for phylogenetic inference.
A good illustration is that the monophyly of three families (Paguridae, Coenobitidae, and Pylochelidae) and
the paraphyly of the family Diogenidae are reconfirmed in the gene order tree (Figs. 5, 6). Our conclusion is in
accordance with previous workers, who suggested that gene rearrangements, to some extent, contain phyloge-
netic information. For example, Shao et al.64 compared the mitochondrial gene arrangements of 12 anomurans
and found that Munidopsis lauensis and M. verrilli are most closely related to Shinkaia crosnieri. Based on the
comparative analysis of mitochondrial gene arrangement within Coleoidea, Akasaki et al.65 concluded that
order Octopoda might be the most ancestral among this subclass Coleoidea. However, the potential to resolve
the phylogenetic relationships within families based on gene order alone is clearly inferior to sequence-based
approaches. One example is that the monophyly of two genera (Dardanus and Coenobita) is not recovered in
the gene order tree (Fig. 5). In future studies, it may be possible to resolve some long-standing phylogenetic
controversies by integrating gene order and sequence data.
For most families of the order Decapoda, congeners belonging to the same family share the same gene
arrangement generally. Accordingly, it is acceptable to apply gene rearrangement as a molecular marker for phy-
logenetic inference6,15,16. However, there are some exceptions. For example, the family Camptandriidae Stimpson,
1858 possess two different gene arrangements (unpublished), and the freshwater crabs Potamidae Ortmann, 1896
possess at least nine main types of gene r earrangement66. In the present study, we even found that two closely
related species of the genus Dardanus capture different gene rearrangements. These examples challenge the
Scientific Reports | (2021) 11:21833 | https://doi.org/10.1038/s41598-021-01338-8 8
Vol:.(1234567890)www.nature.com/scientificreports/
Figure 5. Phylogeny of Paguroidea reconstructed using gene order data, and arrangement of mitochondrial
genes in the ancestral pancrustacean pattern and the superfamily Paguroidea. PCGs and CR are indicated
with boxes, and tRNAs are indicated with columns. COI has been designated the start point for the linear
representation of the gene arrangement.
utility of gene rearrangement as a molecular marker in phylogenetic studies. So it triggers a thought-provoking
question that why the mitogenome gene arrangement differs between very closely related species? One possible
hypothesis is that the mitogenome gene rearrangement is a continuous and dynamic process and may occur very
recently even after speciation events. In future studies, more relevant data are essential to verify this hypothesis.
Scientific Reports | (2021) 11:21833 | https://doi.org/10.1038/s41598-021-01338-8 9
Vol.:(0123456789)www.nature.com/scientificreports/
Figure 6. Phylogenetic tree of Paguroidea species inferred from the nucleotide sequences of 13 PCGs based on
Bayesian inference (BI) and maximum likelihood (ML) analysis. Node marked with a solid circle indicates 100
maximum likelihood bootstrap value and 100% supporting value.
Conclusion
In the present study, we reported the mitogenomes of D. arrosor and D. aspersus, supplementing the limited
mitogenome information of the family Diogenidae (Anomura: Paguroidea). By analyzing the mitogenomes of
D. arrosor and D. aspersus and comparing them with other published Paguroidea mitogenomes, we can draw the
following conclusions: (a) the gene content of the two mitogenomes belonging to the same genus is conserved,
whereas the gene arrangement is different; (b) CREx analysis reveals that transposition, reversal, and TDRL may
be involved in the large-scale gene rearrangements in D. arrosor and D. aspersus mitogenomes; (c) the dN/dS
analysis indicates that the evolution of Paguroidea mitogenomes has been dominated by purifying selection; (d)
the phylogenetic analyses based on both gene order and sequence data reveal the monophyly of three families
(Paguridae, Coenobitidae, and Pylochelidae) and the paraphyly of the family Diogenidae. In future studies,
large-scale taxonomic samplings are still needed to further investigate the taxonomical and phylogenetic stud-
ies of Paguroidea.
Received: 30 July 2021; Accepted: 11 October 2021
References
1. Boore, J. L. Animal mitochondrial genomes. Nucl. Acids Res. 27, 1767–1780 (1999).
2. Gyllensten, U., Wharton, D., Josefsson, A. & Wilson, A. C. Paternal inheritance of mitochondrial DNA in mice. Nature 352, 255–257
(1991).
3. Sato, M. & Sato, K. Maternal inheritance of mitochondrial DNA by diverse mechanisms to eliminate paternal mitochondrial DNA.
Biochim. Biophys. Acta (BBA) Mol. Cell Res. 1833, 1979–1984 (2013).
4. Sanchez, G. et al. Population genetics of the jumbo squid Dosidicus gigas (Cephalopoda: Ommastrephidae) in the northern Hum-
boldt Current system based on mitochondrial and microsatellite DNA markers. Fish. Res. 175, 1–9. https://doi.org/10.1016/j.fishr
es.2015.11.005 (2016).
5. Ma, Z. et al. Comparative mitogenomics of the genus Odontobutis (Perciformes: Gobioidei: Odontobutidae) revealed conserved
gene rearrangement and high sequence variations. Int. J. Mol. Sci. 16, 25031–25049. https://d oi.o
rg/1 0.3 390/i jms16 10250 31 (2015).
6. Tan, M. H. et al. ORDER within the chaos: Insights into phylogenetic relationships within the Anomura (Crustacea: Decapoda)
from mitochondrial sequences and gene order rearrangements. Mol. Phylogenet. Evol. 127, 320–331. https://doi.org/10.1016/j.
ympev.2018.05.015 (2018).
7. Ren, L. et al. Comparative analysis of mitochondrial genomes among the subfamily Sarcophaginae (Diptera: Sarcophagidae) and
phylogenetic implications. Int. J. Biol. Macromol. 161, 214–222 (2020).
8. Chen, L.-P. et al. Comparative analysis of mitogenomes among six species of grasshoppers (Orthoptera: Acridoidea: Catantopidae)
and their phylogenetic implications in wing-type evolution. Int. J. Biol. Macromol. 159, 1062–1072 (2020).
9. Jiang, L., Kang, L., Wu, C., Chen, M. & Lü, Z. A comprehensive description and evolutionary analysis of 9 Loliginidae mitochondrial
genomes. Hydrobiologia 808, 115–124 (2018).
10. Wu, X. et al. New features of Asian Crassostrea oyster mitochondrial genomes: A novel alloacceptor tRNA gene recruitment and
two novel ORFs. Gene 507, 112–118. https://doi.org/10.1016/j.gene.2012.07.032 (2012).
11. Liu, Q. N. et al. A transfer RNA gene rearrangement in the lepidopteran mitochondrial genome. Biochem. Biophys. Res. Commun.
489, 149–154. https://doi.org/10.1016/j.bbrc.2017.05.115 (2017).
Scientific Reports | (2021) 11:21833 | https://doi.org/10.1038/s41598-021-01338-8 10
Vol:.(1234567890)www.nature.com/scientificreports/
12. Zhang, Y. et al. Gene rearrangements in the mitochondrial genome of Chiromantes eulimene (Brachyura: Sesarmidae) and phylo-
genetic implications for Brachyura. Int. J. Biol. Macromol. 162, 704–714. https://doi.org/10.1016/j.ijbiomac.2020.06.196 (2020).
13. Gong, L. et al. Large-scale mitochondrial gene rearrangements in the hermit crab Pagurus nigrofascia and phylogenetic analysis
of the Anomura. Gene 695, 75–83. https://doi.org/10.1016/j.gene.2019.01.035 (2019).
14. Yuan, Y., Li, Q., Yu, H. & Kong, L. The complete mitochondrial genomes of six heterodont bivalves (Tellinoidea and Solenoidea):
Variable gene arrangements and phylogenetic implications. PLoS ONE 7, e32353 (2012).
15. Smith, M. J., Arndt, A., Gorski, S. & Fajber, E. The phylogeny of echinoderm classes based on mitochondrial gene arrangements.
J. Mol. Evol. 36, 545–554 (1993).
16. Morrison, C. et al. Mitochondrial gene rearrangements confirm the parallel evolution of the crab-like form. Proc. R. Soc. Lond.
Ser. B Biol. Sci. 269, 345–350 (2002).
17. Macey, J. R., Larson, A., Ananjeva, N. B., Fang, Z. & Papenfuss, T. J. Two novel gene orders and the role of light-strand replication
in rearrangement of the vertebrate mitochondrial genome. Mol. Biol. Evol. 14, 91–104 (1997).
18. Thyagarajan, B., Padua, R. A. & Campbell, C. Mammalian mitochondria possess homologous DNA recombination activity. J. Biol.
Chem. 271, 27536–27543 (1996).
19. Tsaousis, A. D., Martin, D., Ladoukakis, E., Posada, D. & Zouros, E. Widespread recombination in published animal mtDNA
sequences. Mol. Biol. Evol. 22, 925–933 (2005).
20. Zhuang, X. & Cheng, C. H. C. ND6 gene “lost” and found: Evolution of mitochondrial gene rearrangement in Antarctic notothen-
ioids. Mol. Biol. Evol. 27, 1391–1403 (2010).
21. Moritz, C. & Brown, W. M. Tandem duplications in animal mitochondrial DNAs: Variation in incidence and gene content among
lizards. Proc. Natl. Acad. Sci. U. S. A. 84, 7183–7187 (1987).
22. Cantatore, P., Gadaleta, M., Roberti, M., Saccone, C. & Wilson, A. Duplication and remoulding of tRNA genes during the evolu-
tionary rearrangement of mitochondrial genomes. Nature 329, 853–855 (1987).
23. Poulton, J. et al. Families of mtDNA re-arrangements can be detected in patients with mtDNA deletions: Duplications may be a
transient intermediate form. Hum. Mol. Genet. 2, 23–30 (1993).
24. Lavrov, D. V., Boore, J. L. & Brown, W. M. Complete mtDNA sequences of two millipedes suggest a new model for mitochondrial
gene rearrangements: Duplication and nonrandom loss. Mol. Biol. Evol. 19, 163–169 (2002).
25. De Grave, S. et al. A classification of living and fossil genera of decapod crustaceans. Raffles Bull. Zool. 21 Supplement, 1–109
(2009).
26. UDEKEM, D. A. C. D. Inventaire et distribution des crustacés décapodes de l’Atlantique nord-oriental, de la Méditerranée et des
eaux continentales adjacentes au nord de 25 N. Collection des Patrimoines Naturels 40, 1–383 (1999).
27. Sha, Z., Xiao, L. & Wang, Y. Study on the Taxonomy of the Family Diogenidae (Crustacea: Decapoda: Anomura: Paguridea) from
China Seas (Science Press, 2015).
28. McLaughlin, P. A. Illustrated keys to families and genera of the superfamily Paguroidea (Crustacea: Decapoda: Anomura), with
diagnoses of genera of Paguridae. Mem. Mus. Vic. 60, 111–144 (2003).
29. McLaughlin, P. A. & Lemaitre, R. Carcinization in the Anomura-fact or fiction? I. Evidence from adult morphology. Contrib. Zool.
67, 79–123 (1997).
30. McLaughlin, P. A., Lemaitre, R. & Sorhannus, U. Hermit crab phylogeny: A reappraisal and its “fall-out”. J. Crustac. Biol. 27, 97–115
(2007).
31. Reshmi, R. & Bijukumar, A. New report of the hermit crabs Dardanus lagopodes (Forskal, 1775), Paguristes miyakei Forest &
McLaughlin, 1998 and Oncopagurus monstrosus (Alcock, 1894) (Crustacea: Decapoda: Anomura) from the Indian coast. Rec.
Zool. Surv. India 113, 197–201 (2013).
32. Deval, M. C. & Froglia, C. New records of deep-sea decapod crustaceans in the Turkish Mediterranean Sea (North Levant Sea).
Zool. Middle East 62, 323–330 (2016).
33. Martin, M. Cutadapt removes adapter sequences from high-throughput sequencing reads. EMBnet. J. 17, 10–12 (2011).
34. Dierckxsens, N., Mardulyn, P. & Smits, G. NOVOPlasty: De novo assembly of organelle genomes from whole genome data. Nucl.
Acids Res. 45, e18. https://doi.org/10.1093/nar/gkw955 (2017).
35. Bernt, M. et al. MITOS: Improved de novo metazoan mitochondrial genome annotation. Mol. Phylogenet. Evol. 69, 313–319 (2013).
36. Lowe, T. M. & Chan, P. P. tRNAscan-SE on-line: Integrating search and context for analysis of transfer RNA genes. Nucl. Acids Res
44, W54–W57. https://doi.org/10.1093/nar/gkw413 (2016).
37. Alikhan, N.-F., Petty, N. K., Zakour, N. L. B. & Beatson, S. A. BLAST Ring Image Generator (BRIG): Simple prokaryote genome
comparisons. BMC Genom. 12, 1–10 (2011).
38. Kumar, S., Stecher, G., Li, M., Knyaz, C. & Tamura, K. MEGA X: Molecular evolutionary genetics analysis across computing
platforms. Mol. Biol. Evol. 35, 1547–1549 (2018).
39. Perna, N. T. & Kocher, T. D. Patterns of nucleotide composition at fourfold degenerate sites of animal mitochondrial genomes. J.
Mol. Evol. 41, 353–358 (1995).
40. Darling, A. C., Mau, B., Blattner, F. R. & Perna, N. T. Mauve: Multiple alignment of conserved genomic sequence with rearrange-
ments. Genome Res. 14, 1394–1403 (2004).
41. Bernt, M. et al. CREx: Inferring genomic rearrangements based on common intervals. Bioinformatics 23, 2957–2958 (2007).
42. Hu, F., Lin, Y. & Tang, J. MLGO: Phylogeny reconstruction and ancestral inference from gene-order data. BMC Bioinform. 15, 1–6
(2014).
43. Zhang, D. et al. PhyloSuite: An integrated and scalable desktop platform for streamlined molecular sequence data management
and evolutionary phylogenetics studies. Mol. Ecol. Resour. 20, 348–355. https://doi.org/10.1111/1755-0998.13096 (2020).
44. Katoh, K., Misawa, K., Kuma, K. I. & Miyata, T. MAFFT: A novel method for rapid multiple sequence alignment based on fast
Fourier transform. Nucl. Acids Res. 30, 3059–3066 (2002).
45. Talavera, G. & Castresana, J. Improvement of phylogenies after removing divergent and ambiguously aligned blocks from protein
sequence alignments. Syst. Biol. 56, 564–577 (2007).
46. Nguyen, L.-T., Schmidt, H. A., Von Haeseler, A. & Minh, B. Q. IQ-TREE: A fast and effective stochastic algorithm for estimating
maximum-likelihood phylogenies. Mol. Biol. Evol. 32, 268–274 (2015).
47. Ronquist, F. et al. MrBayes 3.2: Efficient Bayesian phylogenetic inference and model choice across a large model space. Syst. Biol.
61, 539–542. https://doi.org/10.1093/sysbio/sys029 (2012).
48. Sultana, Z. et al. Molecular phylogeny of ten intertidal hermit crabs of the genus Pagurus inferred from multiple mitochondrial
genes, with special emphasis on the evolutionary relationship of Pagurus lanuginosus and Pagurus maculosus. Genetica 146, 369–381
(2018).
49. Hickerson, M. & Cunningham, C. Dramatic mitochondrial gene rearrangements in the hermit crab Pagurus longicarpus (Crustacea,
Anomura). Mol. Biol. Evol. 17, 639–644 (2000).
50. Gong, L. et al. Novel gene rearrangement in the mitochondrial genome of Coenobita brevimanus (Anomura: Coenobitidae) and
phylogenetic implications for Anomura. Genomics 112, 1804–1812. https://doi.org/10.1016/j.ygeno.2019.10.012 (2020).
51. Veldsman, W. P., Wang, Y., Niu, J., Baeza, J. A. & Chu, K. H. Characterization of the complete mitochondrial genome of a coconut
crab, Birgus latro (Linnaeus, 1767) (Decapoda: Anomura: Coenobitidae), from Okinawa, Japan. J. Crustac. Biol. 40, 390–400 (2020).
Scientific Reports | (2021) 11:21833 | https://doi.org/10.1038/s41598-021-01338-8 11
Vol.:(0123456789)www.nature.com/scientificreports/
52. Gan, H. Y., Gan, H. M., Tan, M. H., Lee, Y. P. & Austin, C. M. The complete mitogenome of the hermit crab Clibanarius infraspi-
natus (Hilgendorf, 1869), (Crustacea; Decapoda; Diogenidae)—A new gene order for the Decapoda. Mitochondrial DNA Part A
27, 4099–4100 (2016).
53. Wang, Q. et al. Comparative mitochondrial genomic analysis of Macrophthalmus pacificus and insights into the phylogeny of the
Ocypodoidea & Grapsoidea. Genomics 112, 82–91 (2020).
54. Kim, M. I. et al. Complete nucleotide sequence and organization of the mitogenome of the red-spotted apollo butterfly, Parnassius
bremeri (Lepidoptera: Papilionidae) and comparison with other lepidopteran insects. Mol. Cells 28, 347–363 (2009).
55. Hao, J. et al. The complete mitochondrial genome of Ctenoptilum vasava (Lepidoptera: Hesperiidae: Pyrginae) and its phylogenetic
implication. Comp. Funct. Genom. 2012, 328049 (2012).
56. Boore, J. L., Lavrov, D. V. & Brown, W. M. Gene translocation links insects and crustaceans. Nature 392, 667–668 (1998).
57. Richter, S. & Scholz, G. Morphological evidence for a hermit crab ancestry of lithodids (Crustace, Decapoda, Anomala, Paguroidea).
Zool. Anz. 233, 187–187 (1994).
58. Lemaitre, R., Mclaughlin, P. A. & Sorhannus, U. Phylogenetic relationships within the Pylochelidae (Decapoda: Anomura:
Paguroidea): A cladistic analysis based on morphological characters. Zootaxa 2022, 1–14 (2009).
59. Lemaitre, R. & McLaughlin, P. A. Recent advances and conflicts in concepts of anomuran phylogeny (Crustacea: Malacostraca).
Arthropod Syst. Phylogeny. 67, 119–135 (2009).
60. Forest, J. Crustacea Decapoda Anomura: Révision du genre Trizopagurus Forest, 1952 (Diogenidae), avec rétablissement de deux
genres nouveaux. Mémoires du Muséum national d’Histoire naturelle. Série A, Zoologie. 163, 9–149 (1995).
61. Forest, J. Révision du genre Aniculus (Decapoda Diogenidae). Crustaceana 8, 1–91 (1984).
62. Tsang, L., Ma, K., Ahyong, S., Chan, T.-Y. & Chu, K. Phylogeny of Decapoda using two nuclear protein-coding genes: Origin and
evolution of the Reptantia. Mol. Phylogenet. Evol. 48, 359–368 (2008).
63. Landschoff, J. & Gouws, G. DNA barcoding as a tool to facilitate the taxonomy of hermit crabs (Decapoda: Anomura: Paguroidea).
J. Crustac. Biol. 38, 780–793 (2018).
64. Sun, S. E., Sha, Z. & Wang, Y. The complete mitochondrial genomes of two vent squat lobsters, Munidopsis lauensis and M. verrilli:
Novel gene arrangements and phylogenetic implications. Ecol. Evol. 9, 12390–12407 (2019).
65. Akasaki, T. et al. Extensive mitochondrial gene arrangements in coleoid Cephalopoda and their phylogenetic implications. Mol.
Phylogenet. Evol. 38, 648–658 (2006).
66. Zhang, Z. et al. Phylogenetic implications of mitogenome rearrangements in East Asian potamiscine freshwater crabs (Brachyura:
Potamidae). Mol. Phylogenet. Evol. 143, 106669 (2020).
Acknowledgements
This work was supported by the Natural Science Foundation of Zhejiang Province (LY21C190007), Basic Scien-
tific Research Operating Expenses of Zhejiang Provincial Universities (2021JZ003), Zhoushan Science and Tech-
nology Bureau (2021C21007) and Open Foundation from Marine Sciences in the First-Class Subjects of Zhejiang.
Author contributions
Y.Z. and L.M. conceived and designed the research. Y.Z., L.W., X.L., B.L., L.L., Z.L., and Y.G. conducted experi-
ments and analyzed data. Z.Y. and L.G. wrote the manuscript. All authors read and approved the final version
of the manuscript.
Competing interests
The authors declare no competing interests.
Additional information
Supplementary Information The online version contains supplementary material available at https://doi.org/
10.1038/s41598-021-01338-8.
Correspondence and requests for materials should be addressed to L.G.
Reprints and permissions information is available at www.nature.com/reprints.
Publisher’s note Springer Nature remains neutral with regard to jurisdictional claims in published maps and
institutional affiliations.
Open Access This article is licensed under a Creative Commons Attribution 4.0 International
License, which permits use, sharing, adaptation, distribution and reproduction in any medium or
format, as long as you give appropriate credit to the original author(s) and the source, provide a link to the
Creative Commons licence, and indicate if changes were made. The images or other third party material in this
article are included in the article’s Creative Commons licence, unless indicated otherwise in a credit line to the
material. If material is not included in the article’s Creative Commons licence and your intended use is not
permitted by statutory regulation or exceeds the permitted use, you will need to obtain permission directly from
the copyright holder. To view a copy of this licence, visit http://creativecommons.org/licenses/by/4.0/.
© The Author(s) 2021
Scientific Reports | (2021) 11:21833 | https://doi.org/10.1038/s41598-021-01338-8 12
Vol:.(1234567890)You can also read