DIGITALIZING CONSTRUCTION WORK- FLOW (DICTION)
←
→
Page content transcription
If your browser does not render page correctly, please read the page content below

Digitalizing Construction Work-
    flow (DiCtion)
    Final report

    Authors:
    Aalto University researchers: Olli Seppänen, Antti Peltokorpi, Yuan Zheng, Mustafa
    Khalid Masood, Antti Aikala, Joonas Lehtovaara
    VTT researchers: Markku Kiviniemi, Rita Lavikka, Pertti Lahdenperä

    26.2.2021
The project was funded by Business Finland and a consortium of 7 companies: Fira, Trimble, Bonava, Consolis, Parma, Ruukki, Sweco
Contents

1.     Introduction ............................................................................................................................. 5

     1.1.     Background of the research and development project ................................................... 5

     1.2.     Participants ....................................................................................................................... 5

     1.3.     Steering group .................................................................................................................. 6

     1.4.     Project aim and methods ................................................................................................. 6

2.     Situation picture in construction ............................................................................................ 9

     2.1.     Background ....................................................................................................................... 9

     2.2.     Workshops to define the concept .................................................................................. 10

     2.3.     Maintaining a shared situation picture .......................................................................... 11

     2.4.     Conceptual model of situational awareness .................................................................. 12

     2.5.     Discussion ....................................................................................................................... 14

3.     Digital construction ontologies ............................................................................................. 15

     3.1.     Background ..................................................................................................................... 15

     3.2.     Development of ontologies ............................................................................................ 16

     3.3.     Digital construction ontologies (Dicon) ........................................................................ 17

     3.4.     Use cases for situation picture ....................................................................................... 19
       3.4.1         Case 1: Subcontract monitoring ............................................................................ 20
       3.4.2         Case 2: Resource flow monitoring ......................................................................... 21

     3.5.     Discussion ....................................................................................................................... 23

4.     Situation picture of the past and present ............................................................................. 24

     4.1.     Combining data sources to increase power of machine vision .................................... 25

     4.2.     Task progress monitoring based on a real-time tracking system ................................ 27

     4.3.     Heat maps for workspace detection using indoor positioning ....................................28

     4.4.     Combined resource tracking of material and labor ...................................................... 29

     4.5.     Avenues for organizational learning aided by situational awareness ......................... 29

     4.6.     Conclusion ......................................................................................................................30

5.     Situation picture of the future – collaborative planning approaches ................................. 31

2 / 61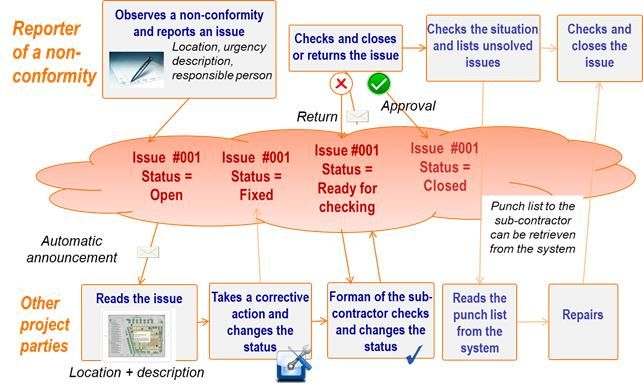
5.1.     Introduction .................................................................................................................... 31

     5.2.     Social network analysis to understand the requirements ............................................ 31

     5.3.     Common generic workflow model ................................................................................. 32

     5.4.     Decentralized takt planning – a new collaborative planning approach ...................... 33
       5.4.1         Motive for decentralized takt planning ................................................................. 33
       5.4.2         Description of decentralized takt production process .......................................... 34

6.     The link between supply chain management and situation picture ................................... 37

     6.1.     Introduction .................................................................................................................... 37

     6.2.     Digital workflows for supply chain management ......................................................... 37
       6.2.1         Optimisation of the schedule of designing and producing elements ...................38
       6.2.2         Optimisation of the look-ahead planning ..............................................................38
       6.2.3         Planning of the shipment of elements in transportation ......................................38
       6.2.4         Delivery capacity confirmation ..............................................................................38
       6.2.5         Planning of subsequent shipments ........................................................................38
       6.2.6         Standardised transportation management ...........................................................38
       6.2.7         Issue management ..................................................................................................38

     6.3.     Digital data flows in logistics ......................................................................................... 39

     6.4.     Requirements for inter-organizational deviation management process and system . 41
       6.4.1         Inter-organizational digital deviation management process and its benefits ..... 41
       6.4.2         Requirements for an inter-organizational digital deviation management system
       and process ............................................................................................................................. 42
       6.4.3         Practical trial for sharing inter-organizational digital deviation data ................. 43

7.     Business models and international validation ..................................................................... 45

     7.1.     Introduction .................................................................................................................... 45

     7.2.     The rationale for linked building data ........................................................................... 46

     7.3.     Business model change is imperative ............................................................................ 47

     7.4.     Linked building data services and solutions .................................................................48

     7.5.     Ecosystem and revenue models for providing linked data services ............................ 49

     7.6.     Discussion and conclusions ........................................................................................... 51

8.     Conclusions ............................................................................................................................ 53

     8.1.     Targeted outcomes ......................................................................................................... 53

     8.2.     Distributed situation picture of a construction project ................................................ 53

     8.3.     Linked Building Data technology .................................................................................. 53

3 / 61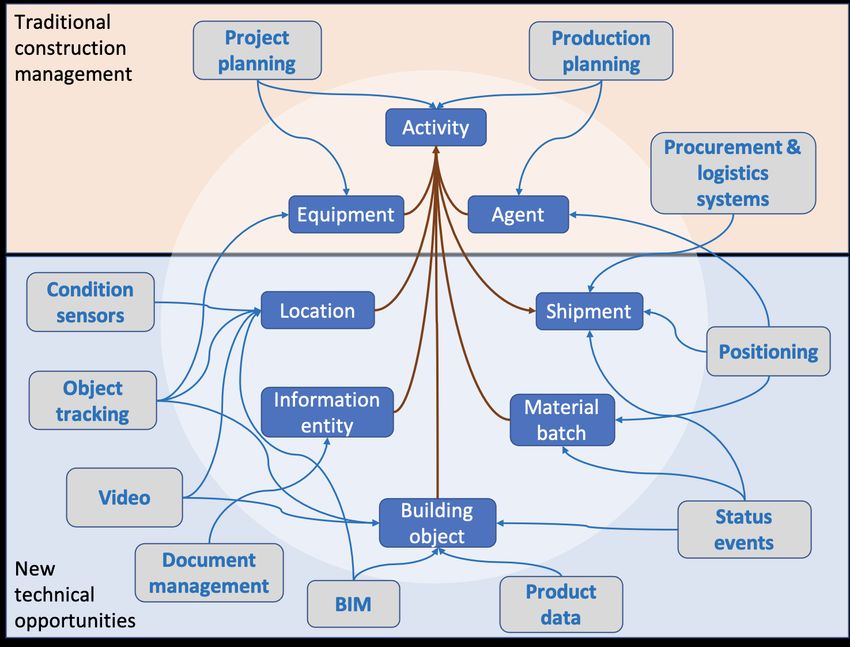
8.4.       Research outcomes ......................................................................................................... 54

   8.5.       Future research ............................................................................................................... 54

References ...................................................................................................................................... 56

4 / 61
1. Introduction
1.1. Background of the research and development project

Construction industry is suffering from low productivity, high risk of delays and cost overruns.
Globally, productivity growth in construction has averaged only 1 percent a year over the past
two decades, compared with the growth of 2.8 percent for the total world economy and 3.6
percent in manufacturing. At least 20% of the total construction volume is waste, 30% of con-
struction is rework, 40% of jobsite work is unproductive, 40% of projects are over budget, and
90% of projects are late (c.f. Forbes & Ahmed, 2011). Typically this is blamed on the seemingly
complex and chaotic nature of construction production. Complexity arises from the fact that
currently no one has an accurate picture of what has happened and what is happening now, and
there is a very unclear picture of what is going to happen in the future. The vision of the DiCtion
project was to solve these problems by digitalizing construction workflows; All construction
project stakeholders should have a shared understanding of past, current and future situation
picture.

The DiCtion project investigated various ways to achieve the shared situation picture. A key
challenge that we explored was that different project stakeholders have their own view of the
construction schedule because they are thinking in terms of their own work. In earlier attempts
to resolve this, rigid approaches have been implemented, for example by forcing everyone to
follow the same breakdown of work and locations. However, this rigid breakdown does not work
well for any one of the parties and results in difficulties in updating information or adapting to
changes. Our goal was to allow freedom of action for each stakeholder and to be able to combine
the freely generated information into one, shared, project situation picture to enable collabora-
tive planning. This required research and development related to developing underlying data
models, creating the rules necessary for integrating information on a construction project level,
enabling freedom and collaboration in planning future work, and finally finding out in real time
what has happened before.

1.2. Participants

Participants of the project all had interest in situation picture and had done some related work
in previous projects. Aalto University had developed location-based planning and controlling
approaches, integrated them with collaborative planning, and real-time tracking of resources
(iCONS project) and using images for reality capture (RECAP project). VTT had developed
proof-of-concept implementations of Linked Building Data on Drumbeat-platform (Drumbeat
project) and is currently utilizing technology in facility management of bridges (Smart Bridge

5 / 61
FM project) and for linking building IoT systems (VIRPA-C project). Trimble planned to de-
velop practical tools for managing and sharing the situation picuture of the construction pro-
ject.
End user companies involved in the project included Fira, a contractor planning to scale their
business by better analysis and management of information and new technology. Sweco is a
consultant company aiming to digitalize their operations. Ruukki aimed to increase productiv-
ity and decrease cycle times by more transparent operations, while Consolis Parma wanted
more collaboration and transparency in the supply chain. Bonava wanted to explore intelligent
construction products. The goal of all participating companies was to improve the domestic and
international business by implementing or using shared situation picture.
1.3. Steering group
The steering group of the project included the following experts:
Jukka Suomi, Trimble Solutions Oy (chairman)
Otto Alhava, Fira
Mauri Laasonen, Sweco
Timo Alanko, Ruukki
Veijo Artoma, Parma Consolis
Sampo Oksama, Bonava
Seppo Törmä, VisuaLynk
Markku Kiviniemi, VTT
Olli Seppänen, Aalto
Antti Peltokorpi, Aalto
1.4. Project aim and methods
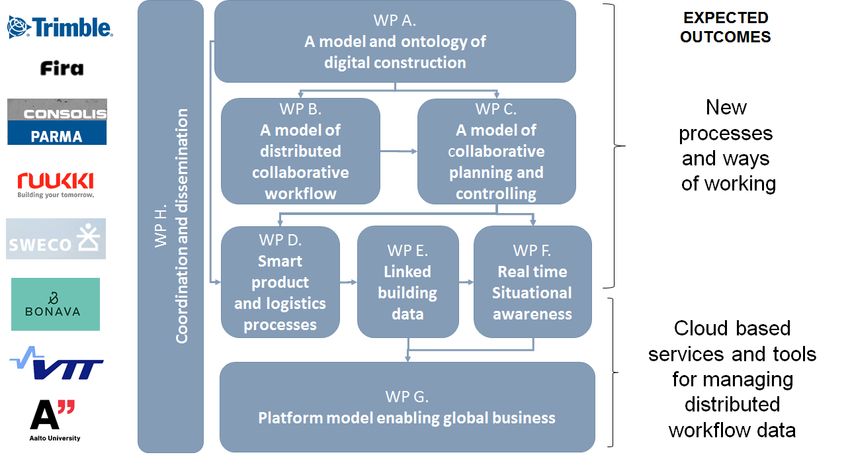
The project was divided to 8 work packages (Figure 1). In this report, we detail the key
results of each work package. Additionally, each work package has a separate, detailed
report. These reports can be found on the project website www.aalto.fi/en/diction.
6 / 61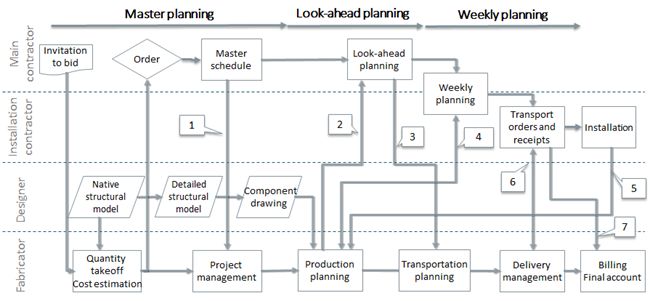
Figure 1: Work packages and participants

WP A: A model and ontology of digital construction

In this Work Package, the goal was to develop a conceptual model for situational awareness.
The WP was implemented as a set of facilitated workshops and the key deliverable was a con-
ceptual map of situational awareness.

WP B: A model of distributed collaborative workflow and WP C: A model of col-
laborative planning and controlling

The two work packages of the initial plan ended up being combined and the results are reported
in one report. The goal was to develop a generic data model for creating, sharing and managing
workflow data and to develop a model for collaborative planning and controlling using the dig-
ital situational awareness.

WP D: Smart product and logistics processes

In this work package the work focused on situational awareness in the supply chain.

WP E: Linked building data

The goal of the work package was to develop an ontology enabling situational awareness and
making possible the linking of multiple data streams.

WP F: Real time situational awareness

In this work package we aimed to evaluate the different data streams of situation picture and
reflect them back to individual plans and calculate KPIs based on situation picture.

7 / 61
WP G: Platform model enabling global business

In this work package, the goal was to evaluate possible business models related to linked data.

WP H Coordination and dissemination.

Several workshops were organized to get feedback on results. Workshops were organized in
Finland, the Netherlands and Stanford University (CIFE) and two workshops were organized
remotely during the COVID-19 pandemic.

8 / 61
2. Situation picture in construction
2.1. Background
An agent has situation awareness (SA) when it maintains an up-to-date understanding of the
relevant aspects of its environment to enable fast, accurate and correct decision making. (The
agent can be a person such as a worker, designer, manager or owner, or a team, corporation or
even a software system). SA has been studied actively in military operations, aviation control,
and naval control, mostly in single agent settings, and especially in mission critical, real-time
decision-making situations.
Lundberg (2015) presents a holistic framework of situation awareness, distinguishing the fol-
lowing aspects:
SA states: What objects are there in the situation and what are their states? How are
they interpreted against the expectation frames for the situation (e.g., plans, predic-
tions)? What are the implications of the interpretation (e.g., unfulfilled precondition,
failed activity, delay)? How will the implications affect the near future, within a rele-
vant event horizon? What corrective actions could be used to solve envisioned prob-
lems?
SA systems: The solutions to maintain and distribute SA among participating agents
and between system parts.
SA processes: Processes of achieving and maintaining SA, and relations to processes
of using SA (for instance, in decision-making or coordination). How the SA is updated
and what guides the updates?
Gathering of situation awareness needs to be directed by expectations of what should happen.
There are frames or schemas that in an organized and pre-planned activity such as construction
could be construction plans, and in an unplanned, improvised activity previously learned,
known situation patterns that are evoked by some perceived cues. The active frames should
affect the attention: what should be perceived in this kind of situation.
Achievement and maintenance of situation awareness has been divided into the following levels
(Endsley, 1995; Nofi, 2000):
Perception - Acquiring the available facts and observations through processes of
monitoring, cue detection, and simple recognition.
Comprehension - Understanding the facts in relation to the goals and plans, using
pattern recognition, interpretation and evaluation.
Projection - Envisioning how the situation is likely to develop in the near future pro-
vided it is not acted upon by any outside force.
Prediction - Envisioning the near future, taking the external and random influence
into account.
To underline, situation awareness does not result merely from collecting lots of facts and ob-
servations in an undiscriminating fashion. Instead, the collection process must be guided by
9 / 61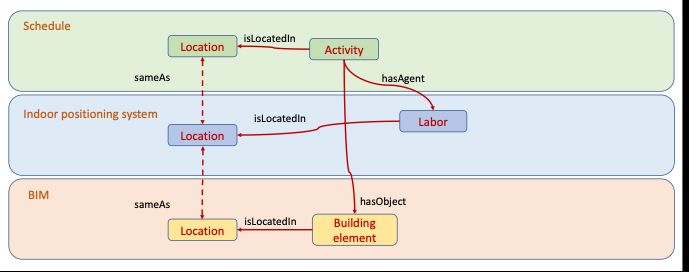
the committed or expected courses of action (for instance, plans or simulations), and moreover,
the collected facts and observations must be actively interpreted to put them in a relation with
committed or expected courses of action.

Situation awareness has been studied a lot in single agent settings but there are also numerous
settings where situation awareness must be maintained by several agents concurrently. When
each agent has its own situation awareness, there is an overlapping, common part and non-
overlapping, complementary parts of overall situational awareness. The common part is called
shared situation awareness and the complementary part distributed situation awareness.
Both shared and distributed SA can be important to coordinate potentially conflicting or com-
plementary activities of multiple parties.

An interesting practical realization of situation awareness system in a military setting is the
maintenance of a common operational picture (COP): "A single identical display of relevant
information shared by more than one command. A common operational picture facilitates col-
laborative planning and assists all echelons to achieve situational awareness" (Gortney, 2010,
p.42).

An important benefit of a shared SA or COP is that they enable individual agents to make deci-
sions relatively independently from each other – that is, without checking each time from oth-
ers if the decision would be fine for them – and still avoid conflicts and achieve a level of coor-
dination. This would certainly be useful in construction sites where different people constantly
need to make decisions, big and small. Obviously, the level of coordination achieved depends
on the accuracy and quality of shared SA.

2.2. Workshops to define the concept

To study the nature of situation awareness in construction management, empirical data was
collected through interviews in California and Finland, and by organizing four workshops with
construction professionals from DiCtion project consortium. They resulted in a refined view on
the situation awareness in construction, summarized in the following observations.

    1. Forming a SP – It is challenging to form a situation picture of construction since the
       actual workflow deviates from the planned workflows. The reasons are that the plans
       may conflict with the natural or practical workflows adopted by the workers especially
       in the presence of obstacles, and also that is difficult for the workers to follow the plans
       due to insufficient tool support.
    2. Learning – Workers have no channels to give feedback when plans are not feasible or
       practical. Since information only flows from top-down, the workers’ knowledge of de-
       tail-level problems on-site does not lead into learning that would improve the plans in
       the future and make them more feasible and practical. Concepts of SA nor COP do not
       address learning in a proper manner.
    3. Requirements – The requirement for the situation picture is that the scope, quality and
       accessibility of produced operational information is adequate for controlling the work-
       flow and improving production processes.

10 / 61
4. Process phases – The process of data collection and analysis for understanding produc-
tivity consists of three phases: (1) data acquisition through change tracking, sensing or
perceiving; (2) information storage, interpretation and refinement in human or com-
puter memory systems; and (3) data distribution in the form of user interfaces and so-
cial interaction.
5. Manual and automatic – Data acquisition, interpretation and distribution are divided
into manual and automated processes and they are interconnected, and it needs to be
taken into account when designing information management systems that aim to im-
prove the situation picture in construction.
6. Benefits – The situation picture would have also other benefits besides operational co-
ordination and efficiency. It would have the potential to improve workers’ safety, im-
prove designs based on feedback from on-site operations, reduce disputes, improve lo-
gistical plans and uncover hidden work.
It should be stressed that the situation picture needs to be maintained in references to the
planned workflow that needs to be practical and realistic enough that it can be followed. The
development of more useful and pragmatic plans requires the capability to gather realistic in-
formation from actual workflows to work as a basis of learning.
2.3. Maintaining a shared situation picture
The primary goal of Diction was to develop an information management solution to maintain a
shared situation picture, to support situation awareness in coordinating daily operations and
supporting operational planning in construction projects. From that perspective, the shared
situation picture is a technical solution that provides all project parties consistent real-time in-
formation about relevant status of project execution:
What is the status of activities: completed, ongoing, interrupted, delayed?
What is the status of entities such as models, documents, contracts, procurement pack-
ages, physical building elements, building systems, resources, or temporary con-
structs?
A situation picture should be shared and distributed in a sense that
each party would see the parts of the situation that are relevant to its activities, and
the views of all parties are consistent with each other to facilitate the synchronization
and coordination of simultaneous activities of multiple parties.
The technical maintenance of a situation picture requires, first, the capability to gather detailed
real-time data from different aspects of a construction process. As mentioned, this can be partly
automatic and partly manual process. However, people are reluctant to do repetitive cognitive
tasks – even simple ones such as writing progress updates – and the information they provide
can also be inaccurate or biased. Since practical availability of sensors and imaging solutions is
growing, the maintenance of situation pictures will gradually become more automatized. A pre-
requisite for that is the capability to integrate the data gathered from these automatic channels
into a unified picture. This requires a principled conceptual model that connects construction
activities to the entities from which sensor observations are made.
11 / 612.4. Conceptual model of situational awareness
In Diction the approach to integrate data to maintain the situation picture is based using or
defining suitable ontologies that cover the concepts and relations in the construction domain.
In Diction, the following requirements were identified for the coverage of the ontologies:
1. To represent the entities in the domains of construction management, building infor-
mation models, and supply-chain management.
2. To support the advanced construction management methods such as Location-based
Management Systems, the Last Planner, and Takt production.
3. To relate sensor systems and sensor data to observed construction entities, such as
workers, locations, material batches, and equipment.
4. To relate observed construction entities and their states to construction activities in a
way that the enablement, progress, and completion of activities can be inferred.
Sensor data can usually be gathered by observing the various ingredients of activities: building
elements, agents, locations, equipment, and material batches. The primary interest from the
perspective of situation picture is the execution and progress of activities that unfortunately is
difficult to observe directly. However, it can be inferred from what happens to the ingredients.
This suggests, therefore, that a sound and operationalizable approach is needed to link the ac-
tivities to their ingredients.
Due to the above-listed requirements, the approach selected in Diction is based on activity-
flow modeling (Garcia-Lopez, 2017) developed in the field of lean construction (Koskela, 1999,
2000). Consequently, the ontologies need to define the concepts and properties to represent
the following ingredients of activities:
objects that activities are focused on and whose states define the precedence con-
straints between activities (from BIM models and product data management),
workspaces, that is, the location resources of activities (partly from BIM models),
agents such as labor crews (from resource management),
materials consumed by activities (partly from BIM models),
equipment needed by activities (from resource management),
information entities such as BIM models, drawings or instructions (from document
management), and
external conditions such as temperature and humidity (from sensors).
In addition to sources of data mentioned above, the locations of many resources can be tracked
with sensor systems for positioning and identification, and the availability workspaces with oc-
cupancy sensors.
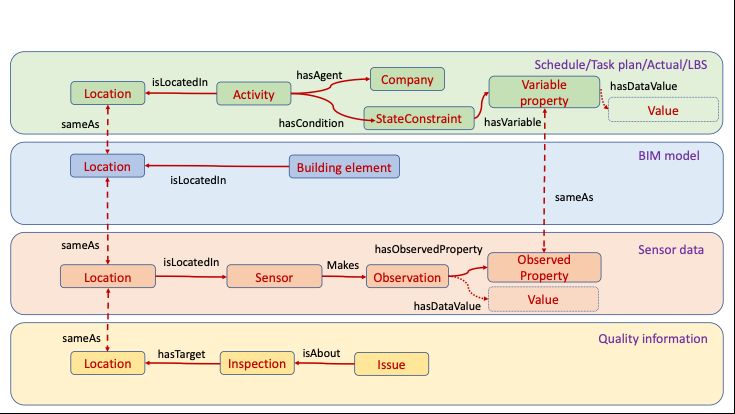
12 / 61The central concepts of a situation picture are shown as blue boxes in Figure 2. The information sources at the outer circle are shown as grey boxes. The upper part of the figure (with reddish background) indicates the area of traditional construction management. The lower part (with bluish background) shows the new opportunities, including object tracking, sensor systems, BIM, product data repositories, and so on. The overall goal is indicated by the brown arrows in the middle of the figure: to make the information flow from the different ingredients to the activity, in order to produce the understanding the progress of activities. These arrows need to be defined as proper relationships in the ontologies. Figure 2: Central concepts of situation picture The ontologies should also take into account the differences between the planned workflows and the actual workflows. The traditional way of recoding the actual times of planned activities is insufficient to support learning. The actual workflow often deviates from the planned work- flow not just temporally but structurally: there can be additional activities in the workflow (cleaning, searching for materials and equipment), a switching order of activities (due to an obstruction preventing the planned order), or even missing activities. The recording of this kind of differences requires that the planned and actual workflows can be completely represented in different worlds or contexts. 13 / 61
2.5. Discussion

To form and maintain an accurate and high-quality situation picture – that would support the
operational coordination of activities of different parties – is a long-term goal. Both the manual
and automatic progress data updating practices needs to be taken fully into use. Detailed facts
and observations are necessary for the creation of an accurate situation picture, even though
they alone are not sufficient; interpretation, comprehension and projects are needed as well.
There is still a need for significant advances in technology to properly interpret – often noisy or
fragmentary – sensor data, or to process video and images to enable accurate recognition of
building objects and their states.

In addition, the practices to produce BIM models with contents appropriate for situation pic-
ture (for instance, models that include spaces, zones, and systems) need to be adopted. The
plans need to be developed in a manner that workers and other agents who use the situation
picture are also connected to the activities that they are responsible for. This would allow the
automatic extraction of the relevant aspects of the situation to each agent.

The ontologies and especially tools based on them are still in an early stage of development.
Many ontologies are achieving a status as a standards – such as BFO, ifcOWL, SSN/SOSA,
OWL-Time – but there are also several ongoing efforts to produce ontologies that might con-
tribute to representation of situation pictures. However, a much more significant enabler would
be the emergence and broader adoption of software development practices that utilize ontolo-
gies and graph-based data management.

14 / 61
3. Digital construction ontologies
3.1. Background

Information is vital for on-site teams to be aware of the actual situations of construction work-
flows (CWs), and their related resources and constraints. The increasing advancements of in-
formation and communication technologies (ICTs) in the construction industry provides an op-
portunity to automatically collect the information. The current implementations include Inter-
net of Things (IoT) (e.g., Ibrahim et al., 2014; Dave et al., 2016; Soman et al., 2017), indoor
positioning systems (IPSs) (e.g., Zhao et al., 2019), computer vision/image processing (e.g., Zou
et al.,2005; Tuttas et al., 2016), building information models (BIMs) (e.g., Wang et al., 2014),
enterprise resource planning (ERP) (e.g., Hadidi et al., 2017), and supply chain management
(SCM) (e.g., Irizarry et al., 2012) systems.

Although these ICT implementations enable automatic information collection and provide
large amounts of digital information and data, they are point solutions that cannot alone result
in a comprehensive situational picture of the construction workflow. Therefore, a systematic
integration of all the information from these systems based on construction domain knowledge
should be explored to build a holistic situation picture of construction flow. The primary barrier
to achieving integration is information heterogeneity. Information from related workflow enti-
ties is often acquired via various information sources and from different stakeholders working
in their own construction disciplines using a variety of tools, systems, and software. To further
increase heterogeneity, construction projects are characterized by different detail levels and
commitment states of essentially the same information: there are multiple levels and versions
of plans, and in addition to plans, there is the actual execution, there are as-designed and as-
built models, and designs at several LOD levels, and so on. All this information needs to be
preserved for further learning, and therefore there is a need to have a representational mecha-
nism to manage this kind of multi-context data. In sum, due to heterogeneity, the information
received from one system may not be comprehensible to other systems, resulting in insufficient
interoperability between the systems to build a situation picture.

When facing such challenges, standard construction information models are required to
achieve information management and system interoperability. Known as an “explicit specifica-
tion of a conceptualization” (Gruber, 1995), an ontology can act as such an information model
by effectively integrating heterogenous information by providing common unambiguous termi-
nologies of concepts and relations based on domain knowledge with a computer-interpretable
format (Karan et al., 2015). Furthermore, as the foundation of implementing Semantic Web
and linked data technologies, ontologies could also enhance the sharing or reuse of information,
data, and domain knowledge (Anumba et al., 2008).

15 / 61
In the DiCtion research project, we developed a suite of ontologies called digital construction
ontologies (Dicon), where our goal was to offer a higher-level conceptualization and formaliza-
tion of CW with shared and reusable domain knowledge representation. The ontology is novel
in its provision of an unambiguous formalized information structure, which can serve as a ref-
erence to structure and integrate the data and information from multiple heterogeneous sys-
tems to build a situation picture of the construction workflow. The ontology suite will be valu-
able to both industrial users and academic researchers working in the lean construction, digital
construction, and linked data domains, as it demonstrates how heterogenous information can
be integrated and further utilized under the linked data framework to support construction
management.

3.2. Development of ontologies

In this research, we have established a hybrid ontology development approach by taking the
Uschold and Gruninger (1996), METHONTOLOGY (Fernández-López et al., 1997), and SKEM
(Noy and Mcguinness, 2001) approaches into account as well as using the systematic frame-
work for ontology building developed by Zhou et al. (2016) as references. The approach includes
four stages, 1) specification, 2) knowledge acquisition/conceptualization, 3) implementation,
and 4) evaluation (Figure 3). A series of monthly workshops were conducted with both ontology
developers and domain experts to support the ontology development. The workshop partici-
pants included the internal members from consortium and external guests and experts. The
participants represented different areas of construction (including designers, developers, con-
tractors, software suppliers, precast concrete suppliers and steel suppliers) and had extensive
experience and knowledge of the construction domain.

The aim of ontology specification is to explicitly specify the scope and purpose of targeted on-
tologies and to determine the intended users and requirements of the ontology. Based on the
specified ontology scope and purpose, the functional requirements of the ontology are typically
identified by using competency questions (CQs). CQs are a set of requirements, formulated as
questions in natural language, that the ontology should be able to answer (Grüninger and Fox,
1995).

The next step is knowledge acquisition, in which relevant domain knowledge of the construc-
tion process was initially reviewed. Then, the conceptualization was conducted based on the
knowledge obtained from the workshops and literature review. The major steps in this phase
included listing the relevant terms in the ontology, defining a class hierarchy, defining class
properties, and specifying the range and domain of the properties (Noy and Mcguinness, 2001).

16 / 61
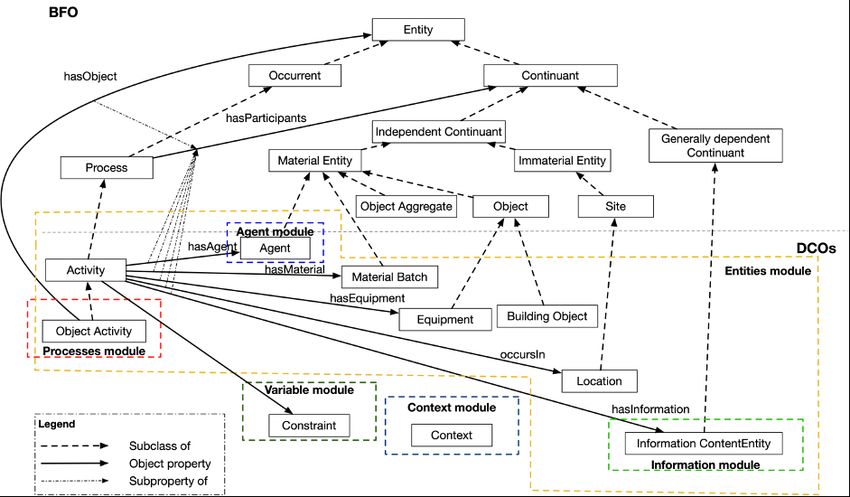
Figure 3. Ontology development approach

After conceptualization, the ontologies were implemented by defining them in OWL (Semantic
Web Ontology Language) to flesh out their details, to enable automatic ontology reasoning, and
to make them machine-readable for new, ontology-based applications and tools. The imple-
mentation and further refinement of Dicon ontologies was carried out in collaboration with the
BIM4EEB project (H2020, #820660), including the definition of additional renovation-spe-
cific ontology concepts and modules. During the implementation phase, we also imported and
mapped relevant external ontologies with the Dicon to improve its reliability and usage.

Ontology evaluation is the essential and final process in the development of ontologies. Based
on the purpose of Dicon, we selected the following five evaluation criteria: clarity, coverage,
consistency, extendibility, and usability. Accordingly, for this research we adopted a combina-
tion of automated consistency checking, expert workshops, criteria-based evaluation, the an-
swering of CQs, and task-based evaluation to evaluate the ontology.

3.3. Digital construction ontologies (Dicon)

Figure 4 illustrates the ontological model of Digital Construction Ontologies (Dicon). Activity
is the central concept, and different aspects of the construction process are associated with ac-
tivity. In the ontological model, an activity was thus modeled as a process that has various en-
tities as participants, also known as flows, including agents, material batches, equipment, loca-
tions, information content entities, and precedence activities. The object of an activity can be
any entities that are the main focus of an activity. The terminologies of the classes and relations
were set up by using prior models and ontologies reviewed in the knowledge acquisition phase.
Meanwhile, the components of the CW (in the lower part) are also aligned with the top-level
concepts from the Basic Formal Ontology (in the upper part).

Moreover, all the fundamental classes in the ontological model are combined as one entities
module. To describe more detailed models of the workflow entities, including the agent, infor-
mation, and process modules, these modules are further expanded based on the classes of

17 / 61
agent, information content entity, and activity. The agents module illustrates the various con-
cepts and relations to describe the capabilities, roles, and organization-related aspects of the
CW. The information module was developed to provide an unambiguous description of CW-
related information content entities. The processes module was used for representing the de-
tailed CW. Besides these four modules that provide basic representations of the relations of
activities and which entities are the ingredients of flows, the variables module was built to spec-
ify the state of an entity and also the condition of an activity. The context module was also in-
cluded to represent multi-context data, which is an essential feature of Dicon. The context mod-
ule is the conceptualization of different contexts, and the information of the entities in the var-
ious contexts is represented in certain named graphs.

Figure 4. The ontological model

All the ontology modules were implemented in OWL. The ontology suite has also been pub-
lished online, with the current version 0.3. Due to space constraints of this report, the detailed
description of these modules is omitted, but their detail documentation can be accessed using
the links in Table 1. And detailed description of the ontology development and evaluation are
in the manuscript by Zheng et al. (2021).

18 / 61
Table 1. Ontology modules of Digital Construction Ontologies (Dicon)
Modules URL Prefix
Entities https://w3id.org/digitalconstruction/Entities dice
Processes https://w3id.org/digitalconstruction/Processes dicp
Agents https://w3id.org/digitalconstruction/Agents dica
Information https://w3id.org/digitalconstruction/Information dici
Contexts https://w3id.org/digitalconstruction/Contexts dicc
Variables https://w3id.org/digitalconstruction/Variables dicv
The standardized or otherwise broadly adopted ontologies that overlap with the domain of Di-
con and that are used by Dicon as supplementary ontologies to give more detailed concepts and
properties for entities they contain are the following:
IfcOWL for the representation of BIM models; it provides the concepts for building
structures, spatial elements, geometries, and property sets.
SSN/SOSA and Saref for sensor information; targets of observations, observable
properties, observations, sensors, and platforms of sensors.
QUDT for units of measure, covering concepts of quantities, quantity kinds, units, di-
mension vectors, and datatypes for values.
OWL-Time for time-related concepts and relations: time interval, time instant, dura-
tion, interval relations (before, overlaps, during, ...), and time datatypes.
FOAF/Org for agents: person, team, organization, role, capability.
PROV-O for the provenance of information: the origin of information and the pro-
cesses, agents and tools involved in its creation.
BFO for fundamental categories, such as process, material object, quality, information
content entity, function, spatial region, and temporal region.
3.4. Use cases for situation picture
Two case studies were conducted in the research. These cases aimed to illustrate the capability
of the ontologies in integrating the information and using instance data to answer the CQs, thus,
to support the building of construction workflow situation pictures.
19 / 613.4.1 Case 1: Subcontract monitoring In this case, Dicon was used to facilitate the interchange of heterogeneous information related to subcontract activities, to support the general contractor in tracking and monitoring produc- tivity and quality related to a particular subcontracted scope. The original data sources were obtained from various systems, including: the construction schedule; the architectural BIM model; indoor sensor data on relative humidity and temperature; and quality inspection infor- mation. The process to generate the linked dataset is shown in Figure 5. The distributed data sources were first mapped to the Dicon ontologies (shown in Figure 6) and then converted into RDF to instantiate the ontology. The converted RDF graphs were then aligned based on the common location element and stored in a triple store in the Graph DB tool together with the ontology. After the RDF graphs were stored, SPARQL queries were conducted with the aim of answering the specified task-based CQs to evaluate the ontology. Table 2 illustrates the results of SPARQL queries. Figure 5. The process used to map the data sources to DICO Figure 6. Mapping the information source to Dicon for subcontract monitoring case 20 / 61
Table 2. Specified CQs and answers based on the subcontract monitoring case

 Competency questions                                 Answers

 1. Where is the location of activity K31 Kor-
                                                      Apartment 1, apartment 2, apartment 3
 jaukset?

 2. Who is responsible for this activity?             Subcontractor B

 3. What is the status of the activity?               Completed

                                                      Apartment                                1:
                                                      0IbHTptORoJ8h7CKZWLXuT

 4. What is the UUID [universally unique identi-      Apartment      2:   3wsTBvMwh8JPHMp-
 fier] of an activity location in the BIM model?      Ccd8d4l

                                                      Apartment                               3:
                                                      0xWPBsQ6ILH8RCKYwmc1Z3

                                                      Apartment 1: completed; apartment 2:
 5. What is the inspection result of the location?
                                                      completed; apartment 3: completed

 6. In a certain time period when activity
                                                      Temperature: 25
 KEINUL1_1_A was happening at the location,
 what were the sensor observation values at that
                                                      Relative humidity: 27.64%
 location during that time period?

 7. Based on the sensor observation values at that
 location, is the activity able to be executed nor-   True
 mally?

3.4.2     Case 2: Resource flow monitoring
The second use case involved resource flow monitoring. In general, tracking the indoor position
of labor can be used to monitor working behavior and to analyze the productivity of a construc-
tion process (e.g. Zhao et al., 2019). This use case required the integration of data, including
indoor positioning data; the architectural BIM model; and the project’s construction schedule
information.

The practical project involved a residential building project during the interior operation phase.
The integration process (as shown in Figure 7) was similar to the first case, where the data from
various data streams were first mapped with the new ontology (as shown in Figure 8) and then
converted to RDF format. Later, the RDF graphs were then aligned and stored in graph store.

21 / 61
For the second case, SPARQL queries were developed to retrieve information related to the resource (labor, in terms of practical data). The CQs and the results are shown in Table 3. Figure 7. The process used to map the data sources to Dicon for the resource flow monitoring case Figure 8. Mapping the information source to Dicon for the resource flow monitoring case 22 / 61
Table 3. CQs and answers based on the subcontract monitoring case

 Competency questions                                           Answers

 1.   Where should carpenter 1 go to work on 15 June?         Apartment 3

 2.   Which activity is assigned to the carpenter?            Door installation

 3.   What building element is assigned for the activity?     Door 26

 4.   Was any labor done in apartment 1 from 1 p.m. to
                                                              True
 2 p.m. on 6 June?

 5.   Who is in apartment 1 from 1 p.m. to 2 p.m. on 6
                                                              Carpenter 1, carpenter 2
 June?

 6.       What is carpenter 1’s trajectory on 5 June from 7
                                                              Entrance > staircase > apartment 1
 a.m. to 8 a.m.?

3.5. Discussion

The two cases have illustrated that the Dicon was able to integrate the data from multiple digital
systems. In the first case, the actual and as-planned information was stored in the different
contexts to build up the integrated picture of subcontract workflows. The precondition of the
activity was also represented by using the ontologies and could be used for comparison with the
status tracking data to identify if variabilities could occur. In the second case, the integrated
information from the IPS, the BIM model, and the schedule could support the workers and site
managers in retrieving necessary information to support their jobs. These cases also showed
that the integrated data could be used for further applications such as querying and information
retrieval to support stakeholders to be aware of the situation thus to aid them make responding
decisions.

23 / 61
4. Situation picture of the past and pre- sent Accurate, shared situation picture is essential to make operational decisions. During construc- tion phase, it has been very difficult to achieve this because the main data acquisition methods have been based on manual observations by project participants. These observations have sometimes been manually entered to IT systems (e.g. scheduling applications). The normal way has been to communicate status information socially, in either ad-hoc or recurring meetings where the status is also compared to plans and corrective action is planned. However, the man- ually obtained status information is partial, asynchronous and subject to biases by humans making observations. Although status information is communicated in meetings, there is no guarantee that every stakeholder in the project is making decisions based on the same situation picture. Recent technological developments could allow at least partially automated, real time situation picture to be generated and shared. (Soibelman et al, 2008; Zhong et al., 2015; Gol- parvar-Fard et al, 2012). While the previous work packages focused on integration of data from multiple sources, this work package looked at automating data acquisition and analysis with new technology. Situation picture can be understood as integration between theoretical plans and actual pro- gress on site. While the traditional process digitalizes information by human entry based on perceptions, new technology allows automated data acquisition by sensoring and computer vi- sion and comparisons to theoretical plans. Situation picture emerges by comparing plans with reality and alerting decision makers of any deviations. Situation picture has a critical role be- cause all the project stakeholders make decisions based on their knowledge of situation, which then impact the real situation in project environment. Figure 9 shows the theoretical plans (blue), actual situation (green), human-based situation picture (red) and automated situation picture (purple). 24 / 61
Figure 9. Creating situation picture socially vs. automatically (adapted from Kärkkäinen et al., 2019)

It is clear that sensoring and storing observations in computerized systems is key to achieving
a shared situation picture that can be used to make decisions impacting the future. The same
data can be used to analyze past successes or failures and to find root causes of problems for
continuous improvement. However, the large amount of data coming from modern sensing sys-
tems, such as indoor positioning (e.g. Zhao et al., 2019) and computer vision (e.g. Khalid
Masood et al., 2020) makes it difficult for decision makers and analysts to compose a situation
picture from all the data streams. Comparing the situation to the planned context is critical but
currently happens mostly manually in those projects where new data streams are collected. The
problems of reflecting situation picture back to plans, defining new KPI’s based on data streams
and making machine vision scalable by combining multiple data sources were explored in this
project. Highlights of results are presented below. More details can be found in the Work Pack-
age F report.

4.1. Combining data sources to increase power of machine vi-
     sion

The project did not include any actual machine vision development but we devised a concept
how multiple data streams could be combined together in order to solve the problem of drywall
work progress detection. The drywall case was selected because it is an important scope in in-
door construction in terms of share of project budget. Drywall has clearly visible states, suitable
for vision-based analysis. However, the states cannot be evaluated by simply comparing cap-
tured geometry with designed geometry because the design typically shows each wall as a com-

25 / 61
posite element without detailing all the work phases. In this case, the pure geometry-based de- tection is not sufficient. Therefore, our proposal combines both geometry and 2D visual com- parison. Drywall progress status can be classified in these consecutive classes: • not started • studs installed • backboard installed • in-wall electrical • drywall closed • wall plastered • wall painted Figure 2 shows example inputs and output of the proposed system. Video inputs, BIM models and schedules are the same for all use cases but the stage examples, as well as the system train- ing must be tailored for each case separately. The top of Figure 10 shows some labelled drywall stage images. Often computer vision algorithms need thousands of labelled example images before satisfactory accuracy can be achieved, but this proposed system will be designed to be able to classify current states with minimal amount of example images. In Figure 10, there is also an example of the output. The contents of the outputs depend on the availability of sup- porting data sources, like existence of indoor positioning data (e.g., Zhao et al., 2019) or plans. Figure 10. Main inputs and a result of the proposed progress detection system for the drywall case 26 / 61
The two necessary input data sources for this system are video recordings and the as-designed
BIM model. Video recordings can be collected inexpensively by the site team and there are also
commercial services available which provide indoor 360-videos. For our initial experiments we
used data from 360 cameras mounted on helmets during weekly safety walk recordings. In or-
der to match the video path and point cloud to designed indoor area, some context data is re-
quired to limit the search. A 4D BIM model could be used to filter out all elements which will
be installed after the element of interest because they do not exist in the video material. For
example, before drywall has been marked as complete, the comparison 3D model should not
include floor coverings, fixed furniture floor covering material, or any doors attached to dry-
walls in question.

Other context data the system may use are Rules, Tracking data and Schedules. For the limited
amount of the training examples, the visual analysis may benefit from the availability of some
rules, like stage sequence order. For example, in the RECAP project (Seppänen et al., 2020),
where bathroom and kitchen work progress were analyzed with computer vision, the use of
stage sequence order yielded better classification result than classification without any sequen-
tial information (Byvshev et al., 2020). With indoor positioning data of workers, materials or
tools, we can detect the active locations where work is most likely progressed. Tracking data
and the schedules can be combined with computer vision result and this information can enrich
the results as shown in Figures 10 and 11.

Figure 11: Fusion of computer vision and tracking data enabling productivity calculation by element

4.2. Task progress monitoring based on a real-time tracking
     system

In addition to computer vision, positioning technologies can be used as part of situation picture.
Indoor positioning can be implemented with several technologies. In our research, we have
used Bluetooth Low Energy beacons connected to Raspberry Pi gateways, but several commer-
cial solutions exist. Our goal in this project was to evaluate whether location information in
combination with schedule information would enable the automatic detection of task start and
finish dates and potentially allow the detection of wasted effort between start and finish dates.

We collected data from one case study (detailed in WP F report and Zhao et al., in review) and
by combining task precedence logic and information on which workers were working on which
tasks, it was possible to estimate the start and finish dates of tasks based on indoor positioning
information by looking at detected presence in work locations. Additionally, task-level presence
indices (PI’s) could be calculated by looking at the share of uninterrupted presence during the

27 / 61
actual duration of the task. The results demonstrated that the schedules had a lot of waste be-
cause for most tasks the PI was between 25 and 40%, with the average being 34.4%. Between
the start and finish dates, most of the work time the worker was not working in the location.
However, the planned durations were achieved. Another important KPI was Presence-to-plan
ratio, which shows how much presence was required compared to the original planned dura-
tion. This could be used to evaluate the share of buffers of planned duration. In the case project,
the average task required 33.8% of presence to complete it in the planned time, so 66.2% of
time was buffer. The results confirmed again that there is a huge opportunity to decrease dura-
tions of construction projects by removing interruptions of tasks and the proposed KPI’s can
result in real-time information which can help identifying productivity problems as they hap-
pen.
4.3. Heat maps for workspace detection using indoor posi-
tioning
In addition to looking at presence of workers at any given time and calculating KPI’s based on
uninterrupted presence, heat maps of presence could potentially be a useful method, especially
when takt production is used. Heat maps could enable the calculation of actual work density.
We experimented with heatmaps in this research project by conducting a case study with a Chi-
nese partner. The full results are described in WP F report and in a conference paper (Zhao et
al., 2020).
Due to issues with radio waves in complicated indoor spaces, any individual measurement can
be off by several meters but the measurements tend to concentrate on the actual work space.
Therefore, the heatmaps over a longer time period can give quite accurate view of patters of
work. Heatmaps could be potentially used for analyzing work density and congestion. Work
density is normally considered in the planning phase but indoor positioning technology enables
continuous calculation and checking the assumptions of the plan with reality. Figure 12 shows
hourly heatmaps of a mechanical worker in the case project which allow making conclusions
about work area and even elements being installed because the area with most heat is matching
with the actual direction of construction. Future research could include aligning the heatmaps
with BIM models and making educated guesses of elements the worker is working on.
28 / 61Figure 12: Heatmap of an electrical worker (Zhao et al. 2020)
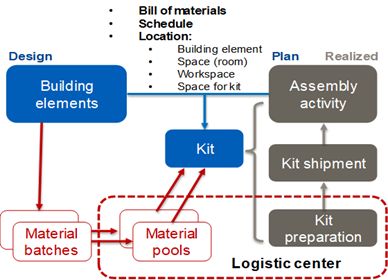
4.4. Combined resource tracking of material and labor
Most earlier studies have considered either material or labor and analyzed them in isolation. In
this project, we analyzed material and labor together. The case study is described in Work Pack-
age F detailed report. Our approach compared the uninterrupted presence of workers with the
presence of material packs designated for each apartment. By comparing the share of time
worker was detected with materials, without materials or with incorrect material pack, it is pos-
sible to evaluate the performance of logistics operations in the project. Although an advanced
logistics concept (kitting) was utilized, the material kits moved several times during the project
and workers were often working with materials assigned to another location or without any kit
at all. The combination of material and labor tracking could therefore be used to measure the
performance of the logistics system. It applies best to cases where larger containers of materials
are delivered, although in our earlier research we have also piloted tracking every container.
4.5. Avenues for organizational learning aided by situational
awareness
To systematically reap the benefits of acquired situational awareness, organizational learning
over single projects, and even organizations is crucial. The provided situational awareness (for
example, through real-time indoor monitoring systems) provides an unprecedented oppor-
tunity to accelerate the learning processes in construction organizations, which has not been
previously possible. For accelerating organizational learning, we propose a conceptual frame-
work that exploits the opportunities provided by situational awareness development. The
29 / 61You can also read