Discoverability Problem of Free-to-Play Mobile Games - Maija Koivisto
←
→
Page content transcription
If your browser does not render page correctly, please read the page content below

Maija Koivisto

Discoverability Problem of Free-to-Play Mobile
Games

Helsinki Metropolia University of Applied Sciences
Bachelor of Business Administration
International Business and Logistics
Bachelor’s Thesis

16 March 2015
Abstract

Author(s)                 Maija Koivisto
Title                     Discoverability Problem of Free-to-Play Mobile Games

Number of Pages           71 pages + 2 appendices
Date                      16 March 2015

Degree                    Bachelor of Business Administration

Degree Programme          International Business and Logistics

Specialisation option     International Business and Logistics

Instructor(s)             Daryl Chapman, Thesis Supervisor

Gaining visibility is crucial to a mobile game’s success. The competitive forces in mobile
games market are strong, which pose challenges for game discovery. Low barriers to
entry, minimal capital requirements and equal access to distribution platforms are some of
the reasons the market is now flooded with staggering amounts of invisible,
undifferentiated mobile games desperate for downloads.

The thesis will give a holistic view of the current discovery landscape of free-to-play
mobile games. The main purpose is to come up with possible solutions to the
discoverability problem faced by free-to-play mobile game developers by identifying the
most influential discovery channels used by the mobile gamers. Potential marketing
methods are discussed not only in comparison to the literature but to findings emerging
from the secondary data to determine the most viable use of marketing resources.

The research design implemented in this work is a multi-method approach using both
exploratory and descriptive research. Extensive literature review discussing mobile games,
free-to-play business model, competition, marketing and consumer behaviour is
conducted. Reliable industry surveys on application and mobile game discovery from four
consecutive years are used as sources of secondary data.

It became evident that app stores and word-of-mouth were the most influential sources
for game discovery. Interestingly, the two most influential discovery sources remained
virtually unchanged during the surveyed years. Advertising and promotions were not
reported as highly influential discovery channels. A highly valuable segment of mobile
gamers were identified as sharers and whales, which the developers should try to attract
by building social features and virality mechanics inside their games.

Marketing methods discussed include burst campaigns, featured position on app stores,
app-store-optimisation, viral marketing, utilising video services, cross promotion and ad-
networks. The mobile game developers should implement multi-channel marketing to
optimise the chances of acquiring quality users.

Keywords                     Mobile games, Free-to-play, Discovery, Competition,
                             Marketing, Buying Process, Consumer Behaviour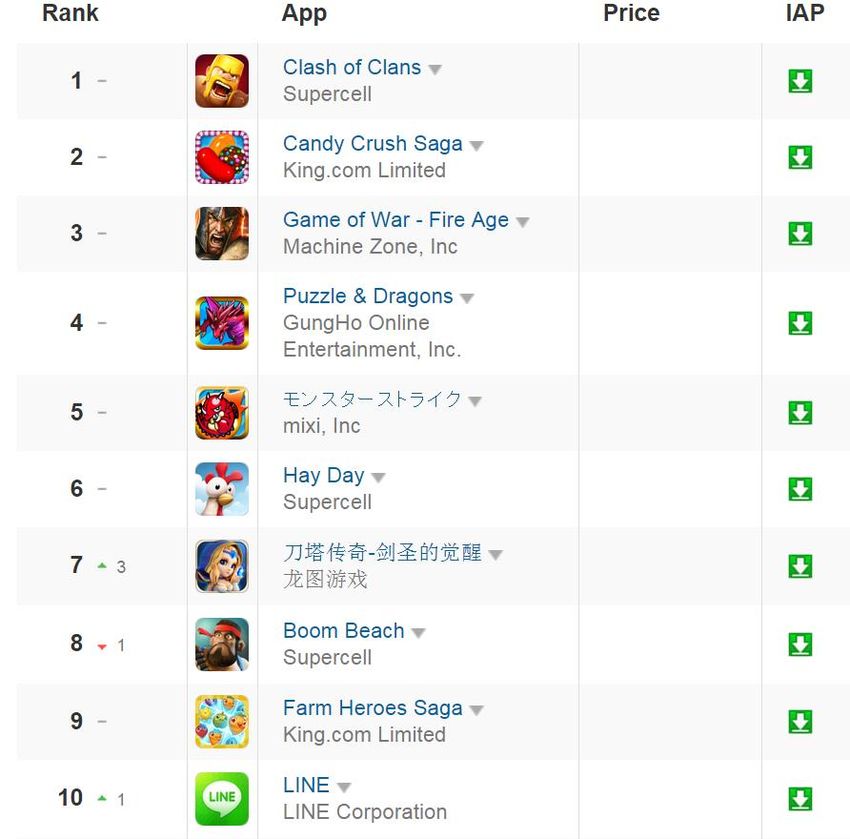
i
Contents
List of Figures and Tables ii
1 Introduction 1
2 Literature Review 2
2.1 Mobile Games 2
2.2 Mobile Games Industry 4
2.3 Free-to-Play 7
2.4 Competition 11
2.4.1 Bertrand Competition 12
2.4.2 Porter’s Five Forces 14
2.5 Marketing 19
2.5.1 Transaction Approach VS Relationship Approach 19
2.5.2 Customer Relationship Management 21
2.5.3 Customer Relationship Lifecycle 22
2.5.4 Player Lifecycle 23
2.5.5 The Buying Process 26
2.5.6 Impact of the Internet on the Buying Process 28
2.5.7 User Segmentation 32
3 Research Methods 38
3.1 Research Design 38
3.2 Online Secondary Data Sources 39
4 Research Findings 40
4.1 Survey by Nielsen 2011 40
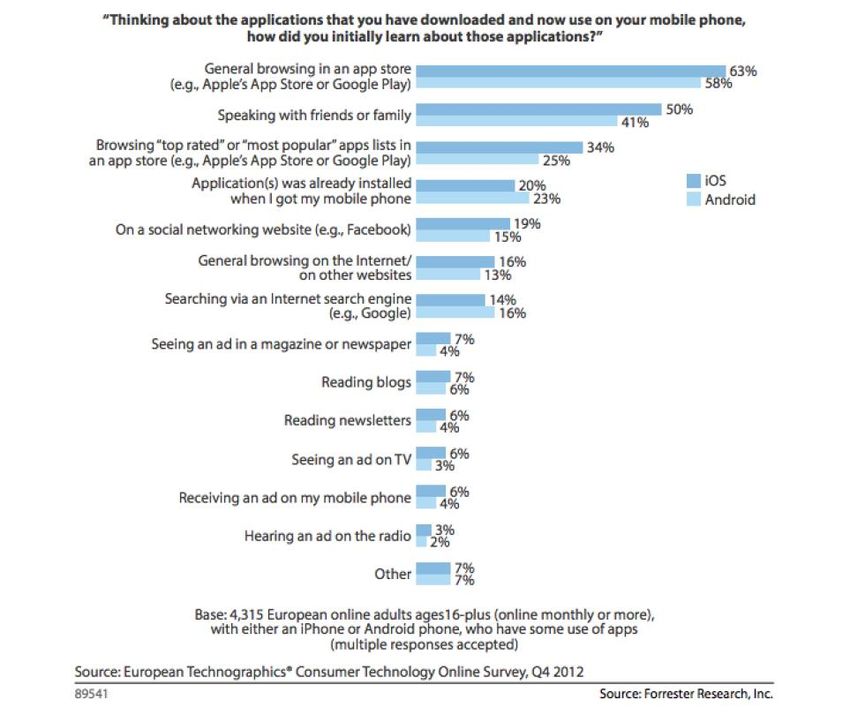
4.2 Survey by Forrester 2012 41
4.3 Survey by Applifier 2013 42
4.4 Survey by Applifier 2014 44
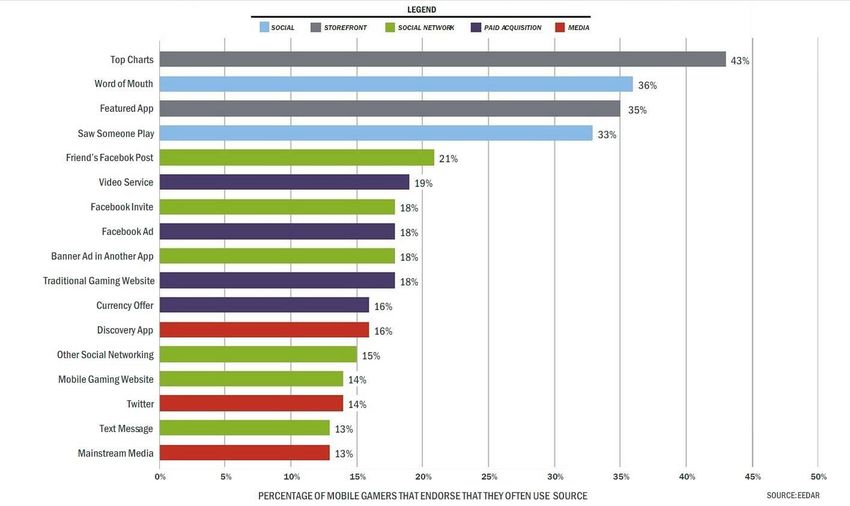
4.5 Survey by EEDAR 2014 45
5 Discussion on Research Findings 48
5.1 App Stores 48
5.1.1 Burst Campaigns 49
5.1.2 Featured position 50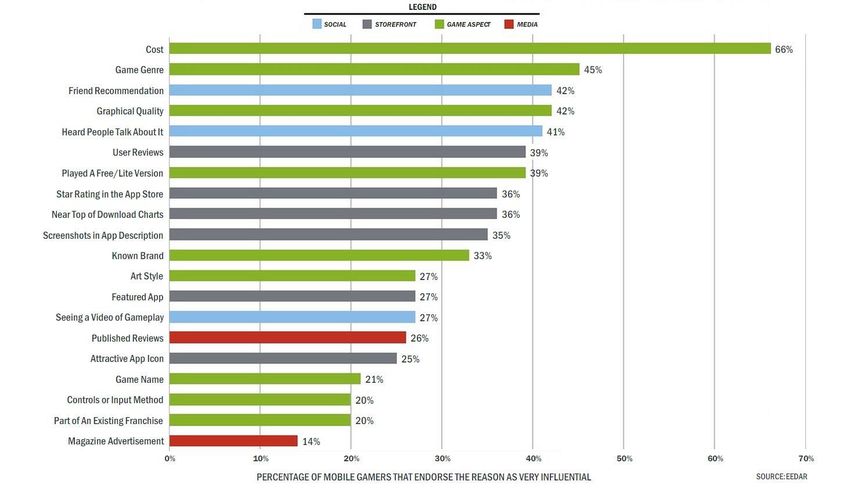
ii
5.1.3 App-Store-Optimisation 51
5.2 Word-of-Mouth and Viral Marketing 53
5.2.1 Sharers and Whales 55
5.2.2 Gameplay Videos 55
5.3 Advertising and Promotions 57
5.3.1 Cross-promotion 57
5.3.2 Ad Networks 58
6 Conclusion 60
6.1 Quality of the Research 61
6.2 Implications for Further Research 62
7 References 63
Appendices
Appendix 1. Sharer Figures, Applifier Survey 2013
Appendix 2. Whale Behaviour, Applifier Survey 2014
List of Figures and Tables
Figure 1. Comparison of Snake to Infinity Blade III. Adapted from Kwalee (2012) &
Sheridan (2013). 3
Figure 2. Global Games Market 2012-2017, Total & Mobile Games Revenues. Newzoo
(2014a). 4
Figure 3. Top grossing mobile games. Top overall in all countries. October 2014.
Distimo.com (2014). 10
Figure 4. Porter’s Five Forces model. Adapted from Johnson et al. (2014: 42). 14
Figure 5. The four classic marketing activities of customer relationship management.
Chaffey & Ellis-Chadwick (2012: 324). 21
Figure 6. A comparison of technology adoption and player lifecycle. Adapted from Clark
(2014: 63). 23
Figure 7. Buyer Decision Process. Kotler et al. (2008: 265). 26
Figure 8. Unprecedented Changes in Buying. Marketo (2013). 29
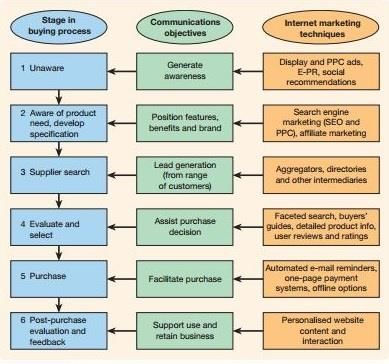
Figure 9. A summary of how the Internet can impact on the buying process for a new
purchaser. Chaffey & Ellis-Chadwick (2012: 84). 30
Figure 10. How do application downloaders discover new apps? Nielsen (2011). 40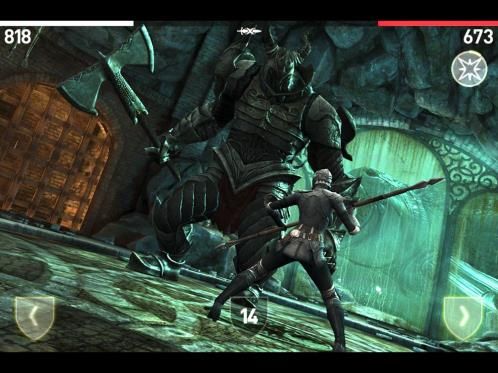
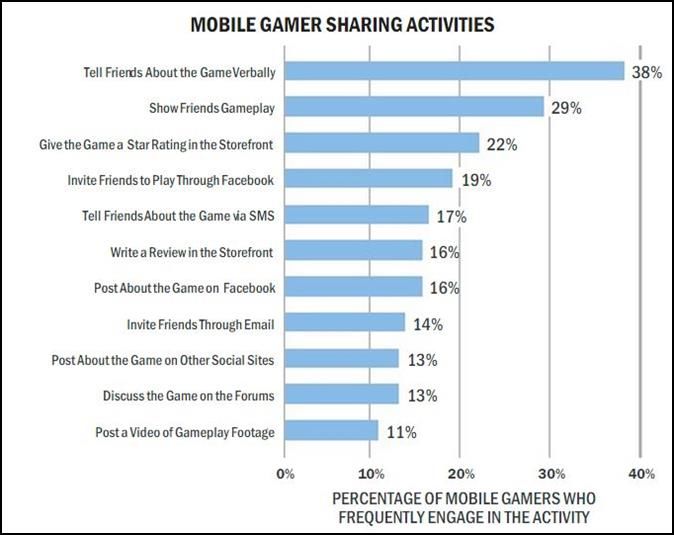
iii

Figure 11. "Thinking about the applications that you have downloaded and now use on
your mobile phone, how did you initially learn about those applications?" Forrester
(2012).                                                                              41
Figure 12. "For the last five games you have downloaded, what was highly influential
in your decision to get that game?" Applifier (2013).                                42
Figure 13. Four main categories of mobile game discovery. Applifier (2013).          43
Figure 14. Difference in influence with traditional WoM and online WoM discovery
channels by user segment. Applifier (2013).                                          43
Figure 15. Percentage of all surveyed who discover via source. Applifier (2014).     44
Figure 16. Percentage of mobile gamers that endorse that they often use source.
EEDAR (2014: 25).                                                                    45
Figure 17. Reasons mobile gamers download mobile games. EEDAR (2014: 27).            46
Figure 18. Mobile gamer sharing activities. EEDAR (2014: 29).                        47
Figure 19. Cross-promotion of the movie Fury in World of Tanks. (screenshot taken
from World of Tanks game during the promotion in November 2014)                      58

Table 1. Business models and the shift in customer relationship building emphasis.   20
Table 2. A range of targeting and segmentation approaches for a digital campaign. 32
1 (71)

1    Introduction

The mobile games industry has seen explosive growth during the past years as smart
phones and tablets have increasingly been adopted by the global population. The
industry has matured over the years and is now reaching the point of saturation. There
are millions of free-to-play mobile games fighting for the players’ attention on app
stores and thousands more are submitted each day. User acquisition costs have
climbed sky-high and only few developers have large enough marketing budgets to
engage in paid user acquisition. Large mobile game companies’ titles keep dominating
the top charts month after month and small developers’ games drown in the flood of
other zombie apps. Darwinism is at its full force in mobile game development – it is the
survival of the fittest.

The researcher was employed by a small Finnish game studio and was in charge of the
marketing activities such as planning user acquisition. It quickly became crystal clear
that small mobile game developers with extremely limited marketing budgets had a
hard time generating any downloads for their games. To add, most small game studios
do not have in-house marketing expertise and some of those studios just develop a
game and submit it onto app stores, hoping to generate downloads without any
additional marketing support.

This research will try to offer possible solutions to the discoverability problem faced by
game developers. Moreover, this work sheds light on player behaviour and tries to find
the most influential and frequently used discovery channels, and what influences the
player’s decision to download a game. Once the most influential channels of discovery
are identified, potential marketing methods are discussed to enhance the games’
chances of being discovered by the targeted audiences.

In addition to studying the discovery landscape, the thesis also aims to provide a
comprehensive view of the current state of the free-to-play mobile games market as a
whole.
2 (71)

2     Literature Review

2.1    Mobile Games

It is useful to start by examining definitions and what is meant when referring to a
mobile game. “Mobile games – more precisely, mobile network games – are narrowly
defined as games conducted in handheld devices with network functionality. The two
key elements of this definition are portability and networkability” (Jeong & Kim 2009:
290). Another definition from Techopedia.com (n.d.) defines mobile games as follows:
“Mobile games are games designed for mobile devices, such as smartphones, feature
phones, pocket PCs, personal digital assistants (PDA), tablet PCs and portable media
players. Mobile games range from basic (like Snake on older Nokia phones) to
sophisticated (3D and augmented reality games).” The broader definition of mobile
games by Jeong & Kim (2009) also include mobile devices without networking
possibilities such as calculators but the mobile games and devices referred to in this
work mainly fall under the more narrow mobile game definition.

The first ever mobile games were embedded in graphic Texas Instruments calculators
in the late 1980s (Entertainment Software Association 2012) but it was not until Nokia
preinstalled Snake onto its mobile phone model 6610 in 1997 that attracted a
worldwide audience: the first generation of mobile games was born. It is roughly
estimated that some 350 to 400 million phones have offered Snake as a standard
feature and it is still argued to be the most famous mobile game of all time (Wright
2008). After Snake’s worldwide success, many similar games followed suite but the
game programmers were severely restricted by the hardware of the time. Fortunately,
mobile phone technology saw rapid advancements in the following decade from
inventions like WAP (Wireless Application Protocol) which allowed access to the World
Wide Web and rudimentary multiplayer options, to introducing first colour screens and
the wider acceptance of Java programming language, all the while mobile phones were
becoming more powerful to support more intricate software (Entertainment Software
Association 2012; Langshaw 2011; Phone Arena 2011).

The revolution of mobile games sparked when Apple launched its first generation
iPhone in 2007 because it paved the way for what was going to happen next. Albeit its
3 (71)

mobile operating system called the iOS supported ever more complex software and its
touch screen user interface and accelerometer support allowed for more sophisticated
mobile games to be developed in terms of motion controls (Langshaw 2011), it was
not as technically superior to other handset devices of its time as argued (Clark 2014:
3). The underlying reason why iPhone became such a successful mobile gaming device
was Apple’s introduction of its App Store in July 10th 2008, which completely
revolutionised the mobile game ecosystem by providing an easy-to-access platform for
developers and customers alike to connect directly without the previous gatekeepers
such as publishers and carriers/operators (Clark 2014: 3-4; Entertainment Software
Association 2012; Wright 2009).

Addition to iPhones and iPads, there are of course other smartphones and tablets
suited for mobile gaming such as the Galaxy line from Samsung, Windows 7 phone
from Microsoft and Google’s Nexus to name a few (Langshaw 2011). Mobile phones
and tablets e.g. Samsung’s Galaxy line using Android, a mobile operating system
launched by the Open Handset Alliance, have a platform similar to Apple’s App Store
called Google Play which was also launched in 2008. Additionally, Amazon has
launched its own Android app store in 2011 and Microsoft its Windows Phone Store in
2010 but their available content is not as extensive compared to App Store and Google
Play (Entertainment Software Association 2012; Langshaw 2011; Statista 2015).

To highlight the evolution of mobile games and the processing power of mobile
devices, the comparison of mobile games Snake from 1997 and Infinity Blade III from
2013 (figure 1 below) clearly shows the advancements in mobile technology.

Figure 1. Comparison of Snake to Infinity Blade III. Adapted from Kwalee (2012) & Sheridan
(2013).
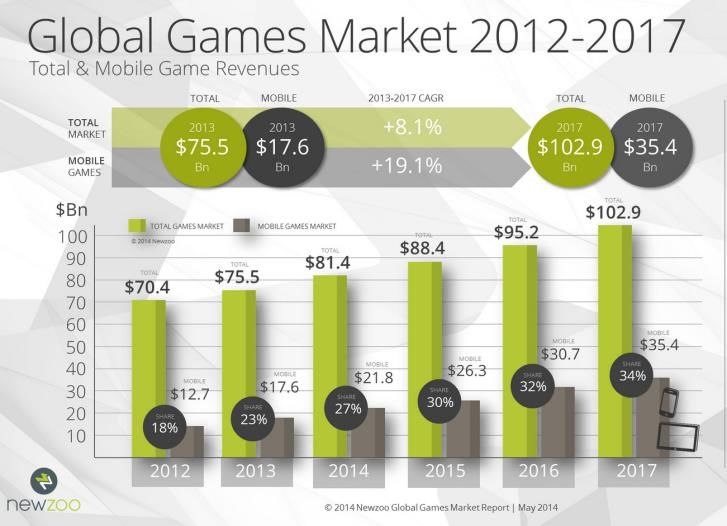
4 (71)

According to Tony Tamasi, Senior Vice President of Content & Technology for Nvidia,
(Chester 2013), the next-gen smartphones could be capable of outperforming
PlayStation 3 and Xbox 360 in terms of graphic processing. This leads to a whole other
discussion on graphics versus gameplay.

2.2   Mobile Games Industry

The rise of the mobile games sector within digital games industry is probably the most
intriguing change in the history of video games since the invention of first consoles,
which brought the games from nerds’ computer rooms to the centre of living room.
With mobile games, the industry has shifted from targeting primarily “hard-core”,
“tech-savvy” and mostly young male players to delivering diverse experiences and
playful activities serving different functions to increasingly more diverse audiences
(Chatfield 2010: 61-62; Kultima 2010). Kultima (2010: 105) argues this expansion of
target audiences to be a “normalisation of digital play” rather than a new phenomenon.
She states that the other entertainment media such as TV shows and movies have
been accepted and consumed by more heterogeneous groups than games, thus it is
“normal” for games to reach a wider acceptance and consumption point as well.

According to Newzoo (2014a), a games market research firm, the whole games
industry generated 75.5 billion dollars in revenues in 2013, out of which mobile games
sector generated $17.6 billion, accounting for 23 per cent share of the whole video
games industry as illustrated in figure 2 below.

Figure 2. Global Games Market 2012-2017, Total & Mobile Games Revenues. Newzoo (2014a).
5 (71)

Newzoo (2014a) estimates the mobile games sector will grow to an impressive $35.4
billion by 2017, hogging one third of the global video games market, pushing the
whole industry total to a staggering 102.9 billion dollars. As figure 2 depicts, the mobile
games sector will have an estimated Compound Annual Growth Rate (CAGR) from
2013 to 2017 of +19.1 per cent, whereas the whole games industry will have a CAGR
of +8.1 per cent.

The increased revenues are a direct consequence of the expanding player base, which
has reached a total of 6.1 billion gamers globally (Newzoo 2014a). However, to
measure growth and fully understand changes in the mobile games market, it is
argued (Newzoo 2013) the amount of paying players and the growth in time spent
playing games should also be included as key performance indicators. A good
argument for this is the fact that free-to-play has become a dominant business model
in mobile games and the amount of players does not correlate with paying players.

Nevertheless, the games industry has been one of the few industries unfazed by the
recession, has shown growth since 2007 (Bulik 2008) and is still not showing any signs
of curbing with mobile games leading the growth. With such growth prospects and
success stories like Rovio’s Angry Birds and Supercell’s Clash of Clans, it comes as no
surprise that there is a “gold rush” to the mobile games industry with new developers
popping up one after another.

The evolution of mobile games industry can be described in three (3) distinct waves
(Moller 2013): 1) Carriers acting as gatekeepers. Mobile game developers had to
persuade the carriers in order to get their games on feature phones. 2) Rise of an
open marketplace. Apple opened the App Store in 2008, eliminating the gatekeepers
and giving every developer an equal footing. 3) Saturation point. As the industry has
matured, and there are virtually no barriers to entry, the market is bombarded with a
vast variety of games and developers are increasingly worried about their games being
discovered. The developers have a good reason to be worried as Google pronounced in
July 2013 that it had reached the 1 million mark in apps available in its Google Play
app store (Rowinski 2013) and Apple’s App Store followed in its wake in December the
same year (Scott 2013).
6 (71)

A mobile games trend report (Newzoo 2013) mapped five (5) key trends that are
currently leading the change in the global games market:

   1. Multiple screens. Five years ago, gamers played mainly on two screens: the TV
       and the PC. Now the numbers of screens have doubled to floating screens
       (tablets & handheld consoles) and personal screens (smartphones). Already 21
       per cent (EU) and 22 per cent (US) of gamers play games on all four screens.
   2. Free games. Gamers are now used to getting game content for free before they
       decide to spend money. Free-to-play business model has proven to be
       successful. The next stop for free might be the TV screen.
   3. Games are services. With in-game spending business models, monetisation
       takes place within the game on consumer’s own terms, therefore publishers
       and developers need to engage the player as long as possible.
   4. Business model balancing act. As games are now services, the business model
       needs balancing between value for the consumer and profit for the
       developer/publisher.
   5. Global market place. The games market is now truly a global playground.
       Online connectivity allows companies to launch games anywhere on the planet.
       The emerging markets are important to game companies’ strategy in order to
       secure growth.

These five trends need to be considered and recognised by developers starting from
game design, and extended from marketing strategies to business strategies in order
to be successful in the mobile games industry.
7 (71)
2.3 Free-to-Play
Seufert (2014: 1) provides the following definition of the freemium business model:
“The freemium business model stipulates that a product’s basic functionality be given
away for free, in an environment of very low or no marginal distribution and production
costs that provides the potential for massive scale, with advanced functionality,
premium access, and other product-specific benefits available for a fee.”
Free-to-play (F2P) is based on a freemium business model where the game and its
functionality are given away for free and the revenues are generated with micro-
transactions (In-App-Purchases) and/or in-game advertisement within the game. Free-
to-play extends from mobile platforms to PC and consoles and is used in a variety of
game genres e.g. Massively Multiplayer Online games (MMO’s), social network games,
casual games and multiplayer shooter games (Alha et al. 2014).
Free-to-play business model in digital games was largely pioneered by Asian MMO
games the likes of Neopets (1999) and Maple Story (2003) which both had purchasable
virtual items. Nexon, a South Korean based developer of Maple Story, was among the
first companies to fully embrace the micro-transaction model (Clark 2014; Sheffield
2008).
Seufert (2014: 2) outlines three (3) realities of the freemium business model:
1. With a price of $0, the product is accessible to the largest number of people.
2. Some users will never convert to paying users.
3. A portion of users might end up spending more money with the product/service
than they would have if the product/service was a one-time purchase.
Seufert (2014) specifies that only 5 percent of the customers ever monetise (spend
money) on the freemium product/service, so a small base of customers need to
generate enough revenue to support a large base of non-paying users in order for the
company to be profitable. Actually, the number of paying customers in mobile games is
even more depressing as a study of millions of mobile gamers by Swrve, a mobile-
marketing-automation firm indicates: the figure has come down from 1.50 per cent in8 (71) January 2014, to a mere 1.35 per cent of players monetising in July (Takahashi 2014). Lovell (2013) also points out the same issue and states that the freemium business model has faced lots of criticism because the ratio between a huge audience of non- paying users and the small proportion of paying users is not seen as sustainable. Aggressive monetisation methods combined with shallow gameplay are regularly seen as a trait of free-to-play. The developers need to balance between designing a game which is a fun experience to the player while persuading the player to spend money during game play, even though the player could continue playing for free (Alexander 2013; Alha et al 2014). Zagal, Björk and Lewis (2013) have written a research paper discussing some of the deliberate game design mechanics of adding hindrances to the game play, which intentionally slow down the game progress for the player unless they pay money. These game design mechanics are referred to as “dark patterns”, and they cause negative experiences for players. These practises are at best questionable, as the goal of any responsible developer should be delivering fun, engaging experiences to the players rather than exploitative game mechanics for short-term profits (Alha et al. 2014). Moreover, a portion of players consider free-to-play disruptive. Lin and Sun (2011) studied players’ opinions and attitudes towards free-to-play and their findings suggest that players who were against free-to-play considered the model as unfair, the games less fun, decreasing the game play quality and disrupting the immersion in the game play. Paavilainen et al. 2013 (cited in Vankka 2014) discovered similarly negative results where players felt the games did not offer enough value in exchange for their money and thought that using real money to purchase virtual items in the game would imbalance the difficulty, thus impairing the whole gaming experience. The industry professionals interviewed for the research paper by Alha et al. (2014) agreed that there is negativity towards free-to-play amongst players; however it was seen coming from a small loud minority. In fact, it was clear to the game professionals that there is a vast audience of mobile players who enjoy playing free-to-play games and are willing to spend money on digital content within the games.
9 (71)

That being said, another issue has surfaced concerning children and free-to-play. The
European Commission has started investigating free-to-play games and especially the
in-app-purchases     made     by   children   (European     Commission      2014).   European
Commission is expecting Apple and Google to stop advertising games as free and make
it more evident the games contain in-app-purchases. Google has since complied and
no longer refers to free-to-play games as free, at least in European Google Play app
stores (Johnson 2014). Similar issues surfaced in the US, where parents were billed for
the purchases their children had unknowingly done while playing free-to-play games,
resulting in a law-suit from the Federal Trade Commission. Apple settled the law-suit
with paying $32.5 million to 37 000 different customers (Brandom 2014).

Game designers seem to widely agree on the fact that fee-to-play has made designing
games more challenging (Luton 2013a; Luton 2013b; Jordan 2014; Grönholm 2014).
Touko Tahkokallio, game designer from Supercell, tells his view (Grönholm 2014: 61):
“Although free-to-play has many good features, such as trying the game for free,
monetisation also restricts the game design. Personally, I see the game selection
becoming more homogeneous as the greatest threat. Not all game types fit free-to-
play as well. [translation mine]1” Additionally, Peter Molyneux, game designer famous
for Dungeon Keeper and the Fable series stated that “free-to-play is constraining our
ability to be creative” (Jordan 2014) and Luton (2013b) writes that “F2P simply makes
making games more difficult.”

Despite the criticism and challenges free-to-play has generated, it has become the
dominant business model in the mobile games market, and most of the top grossing
mobile games are free-to-play. The transition from premium to free-to-play was
complete by June 2011, when the free-to-play games’ revenues overtook premium
games’ share of revenues (Valadares 2011). As seen in figure 3 (see page 10), the top
ten grossing mobile games in Apple’s App Store in October 2014 were all free-to-play
games containing in-app-purchases. The same top grossing ranks in Google Play Store
also had only free-to-play games at top ten charts. When looking at top 100 charts for
the same month for both App Store and Google Play Store, there were only two paid

1
 “Vaikka free-to-playssa on paljon hyviä ominaisuuksia, kuten juuri pelikokeilun ilmaisuus, niin
monetisaatio myös rajoittaa suunnittelua. Itse näen suurimpana uhkana, että pelivalikoima
homogenisoituu. Kaikki pelityypit eivät toimi yhtä hyvin free-to-playssa.”
10 (71)

mobile games in App Store and only one paid mobile game in Google Play Store, the
rest on the top 100 charts were all free-to-play (Distimo.com 2014).

Figure 3. Top grossing mobile games. Top overall in all countries. October 2014. Distimo.com
(2014).

The leader boards from Distimo.com (2014) emphasize how successful the free-to-play
model in mobile games market has proven to be. The research by Alha et al. (2014),
where fourteen game professionals were interviewed on free-to-play, concludes that
although free-to-play generated some mixed feelings between the respondents, it was
still regarded mostly positive by developers. Tahkokallio also said in his interview
(Grönholm 2014: 61) that he sees free-to-play as a positive challenge, and he is sure
that new monetisation models will be invented. Luton (2013b) agrees and writes “What
we have now [free-to-play] isn't the endgame in making money from games; it's just
the best next step of a long march.” Nevertheless, Alha et al. (2014) raise a valid
question shared by Peter Molyneux (Jordan 2014) regarding the future of the whole
games industry, whether free is the only way to provide games in the future as the
new generations are now conditioned to expect games for free.
11 (71)

2.4   Competition

App Developers Conference survey (News.ubm.com 2013), with 250 developers
surveyed found out that piracy and discoverability were regarded as the two key issues
facing app developers; however discoverability was cited as the number one problem
within the app development market. As Nicholas Lovell argues (2013: 2), “the real
disruptive threat comes from competition, not piracy.” There are millions of mobile
game developers globally and more are entering the market incessantly.

According to a study by Evans Data, a market researcher for software development
industry, there are currently 8.7 million mobile software developers in the world
(Schick 2014). However, there is no exact information on the percentage of mobile
developers who focus solely on developing mobile games, although research by Vision
Mobile (2014) suggests that figure to be 2.3 million. Theoretically, each of these
mobile developers could start a one person game studio and enter the market, as Toni
Fingerroos did by founding his own studio Fingersoft, and single-handedly taking the
world by storm with his mobile game title Hill Climb Racing.

It is not just competition from every existing potential mobile developer out there one
needs to look out for but also game studios that were previously only developing AAA-
titles for console and/or PC. The steadily climbing production costs of AAA titles have
led to polarisation of the industry, leaving the giants and indie studios afloat but
squeezing out the middle-sized developers. The bankruptcies of studios like UK based
Real-Time Worlds have resulted in talent transferring from console and PC space into
mobile sector and creation of new independent mobile game studios (Clark 2014: 7;
Lovell 2013: 63-64). Furthermore, AAA studios like Finnish Remedy have also ventured
into mobile games sector with a launch of their first free-to-play mobile game Agents
of Storm (Honkala 2014).

Kim Soares (2014), the CEO of Kukouri Mobile Entertainment, points out the extreme
polarisation of mobile game sector in terms of revenue generation. He writes in his
article in Pelit-magazine that the top ten grossing mobile games on the charts generate
more revenue than the next 500 games on the chart put together, while the top three
make more than the other top ten games altogether. Research by Gartner, the world’s
12 (71)

leading information technology research and advisory company, predicts that “only
0.001 per cent of consumer mobile apps will be considered a financial success by their
developers through 2018” (Gartner 2014).

Moreover, the sheer number of mobile games submitted to Apple’s App Store each
month is overwhelming, data indicates 11 463 submissions of games into App Store in
October 2014 alone and the highest peak ever was reached in August 2014 with
13 137 mobile games submissions. Interestingly enough, the monthly mobile games
submissions did not reach ten thousand yet in year 2013 but since March 2014 the ten
thousand games submissions have been broken each month (Pocketgamer.biz 2014).
Unfortunately, most of these apps fail. A report by VentureBeat (Koetsier 2014) states
that out of the sheer number of submitted mobile apps, 70 per cent generate less than
5000 downloads and Bouchard (2012) writes that while almost one billion apps are
downloaded onto devices monthly, one in four of those apps will never be used.

2.4.1   Bertrand Competition

Joseph Bertrand (1822-1900) was a French mathematician whose economic
competition model based on price is known as Bertrand competition. His competition
model surfaced when he critiqued the competition model of another French economist
Antoine Cournot (1801-1877). Bertrand critiqued Cournot’s decision to use firm’s
production volume as a variable in competition, and made his own model using price
as the main variable (Anderson 2009; Lovell 2013).

In Bertrand model the companies compete on setting the price lower than competitors’
rather than limiting the production volume to raise prices and profits. Bertrand model
assumes the products are homogeneous and that consumers will buy from the firm
with lower prices. The model also assumes that the marginal costs for the firms are the
same (Anderson 2009; Lovell 2013).

Anderson (2009) and Lovell (2013) discuss the current competitive situation in mobile
game industry as a prime example of Bertrand competition where in a competitive
market price falls to the marginal cost. According to Bertrand competition, companies
13 (71)

will lower prices to gain more market share and keep on undercutting one another until
the price reaches just above the cost of production.

Mobile games are distributed digitally in online markets with endless shelf-space and
rather than a retail boxed-product, the quantity of digital goods can be increased
without additional costs to the developer, thus driving the marginal cost towards zero.
As bandwidth costs, software developers’ kits, distribution platforms and cloud storage
are becoming cheaper and even free, the cost of production is close to nothing, thus
driving the prices down.

The economic rule of Bertrand competition has led the mobile game industry to “race
to the bottom”, resulting in an era of free-to-play. When App Store was launched in
2008, initially some of the games were priced as high a as $9.99 but soon competition
started lowering the prices “all in the name of discovery” (Lovell: 46).

In the beginning, the algorithm for App Store’s top rank chart only considered the
number of downloads, which also influenced developers’ pricing strategies, so if the
developers wanted their game to be discovered in the app store, the price had to come
down in order to generate enough downloads to chart. Electronic Arts used this
cleverly to its advantage in 2010 just before Christmas by cutting the prices of seventy
(70) of its mobile games to $0.99, e.g. titles like Need for Speed Shift     that were
regularly priced at $12.99. Cutting the prices led to massive amounts of downloads
driving twelve (12) EA’s games to top 100 charts and in front of millions of eyeballs,
once the new iPhone and iPad owners opened their new devices and started looking
for games after Christmas (Appchatter 2010).
14 (71)
2.4.2 Porter’s Five Forces
“Porter’s Five Forces Framework helps identify the attractiveness of an industry in
terms of five competitive forces: (i) threat of entry, (ii) threat of substitutes, (iii) power
of buyers, (iv) power of suppliers and (v) extent of rivalry between competitors”
(Johnson et al. 2014: 41). Figure 4 below illustrates the model.
Figure 4. Porter’s Five Forces model. Adapted from Johnson et al. (2014: 42).
The following part will go over the five (5) competitive forces in a bit more detail.
Theory part for Porter’s Five Forces is from Johnson et al. (2014: 41-49). The
implications for free-to-play mobile games industry follow the identification of each
competitive force.
i. The threat of entry
How easy it is to enter the industry influences directly the amount of competition. Thus
the industries with high barriers to entry are seen as attractive in Porter’s model
because they keep competition at bay. Porter lists five (5) different barriers to entry:
Scale and experience.
Access to supply or distribution channels.
Expected retaliation
Legislation or government action
Differentiation15 (71) As mentioned earlier in part 2.2, the annual growth rate of mobile games sector is rapid and shows no signs of curbing. According to Porter 2008 (cited in Suter 2012) the rapid growth rate of an industry does not necessarily translate into an attractive industry. Quite the contrary, the growth of the sector and the success stories of some developers attract more hopeful entrants to the industry, which has very low barriers to entry. In free-to-play mobile games industry, the economies or diseconomies of scale do not have an effect, at least in terms of producing units when the product is bits of data transferred digitally and the amount of units can be infinite without extra costs to the developer (Fischer 2014). There is no high capital expenditure required, as hardware technology has become more affordable and some game development engines such as Unity are free now. Currently, production costs of a mobile game is significantly lower than those of AAA games, however as mobile devices evolve and become more efficient the players’ expectations will rise and the need for a higher capital expenditure will also, raising the barrier to entry in the future (Futurebooks 2011). The experience curve gives an advantage to incumbents, the existing players, over new entrants because they already have experience with free-to-play model and know- how on monetisation and retention. Nevertheless, it does not act as a high barrier to entry alone because new entrants can still enter the market due to other low barrier factors such as access to same distribution channels. New entrants have the equal opportunity to distribute via e.g. Apple’s App Store or Google’s Play store as any other incumbent (Fischer 2014; Futurebooks 2011; Suter 2012). Moreover, “it is difficult to retaliate in a form of price war when the products in free-to- play mobile game industry are already free” (Fischer 2014). However, the evolving mobile game mega studios could retaliate by increasing their marketing expenditure towards user acquisition, thus discouraging new entrants with lesser marketing budgets. Currently, there are also no legislation or government regulations to restrict entry to the market. Finally, differentiation in mobile games is challenging as competitors follow successful titles and then quickly come up with clones of the new and differentiated games (Fischer 2014).
16 (71)
ii. The threat of substitutes
“Substitutes are products or services that offer a similar benefit to an industry’s
products or services, but have different nature” (Johnson et al. 2014: 45). The aim is
to consider threats coming from outside the incumbent’s industry rather than focusing
on competition within the incumbent’s own industry.
Evident substitute products posing a threat to mobile games sector incumbents include
games developed for consoles and PCs, which offer a similar yet improved gaming
experience. In addition, mobile games are mostly designed for short playing sessions
to fill “dead space” e.g. while waiting for the bus or while waiting for the commercials
to end on TV, hence social media sites, news sites, e-readers, magazines and even
books pose a substitute threat. The mobile games also offer entertainment, thus the
time consumers allocate to other forms of entertainment such as TV shows, movies or
music substitute for the mobile games (Fischer 2014; Suter 2012).
iii. The power of buyers
Buyers are the incumbent’s immediate customers. The power of buyers is likely to be
high if either of the following conditions prevails:
Concentrated buyers
Low switching costs
In the mobile games industry, the end consumer is the immediate customer because
distributing platforms have bypassed the middlemen. Concentrated buyers refer to a
few customers whom account for the majority of the sales, which is exactly the
situation in mobile games; a few paying customers spending enough to support the
vast non-paying portion.
Low to zero switching costs prevails in mobile, as buyers have no monetary value
invested in the download of a free-to-play game and can easily switch between
products of one developer to another if the game fails to entertain them, by simply
downloading new game(s) for free from one of the app stores. Additionally, the buyer
power is heightened with the vast amount of mobile game apps available. However,
increasing brand-loyalty towards certain game developers and/or game franchises
lowers the bargaining power of buyers by increasing psychological switching costs
(Fischer 2014; Futurebooks 2011)17 (71) iv. The power of suppliers “Suppliers are those who supply the organisation with what it needs to produce the product or service” (Johnson et al. 2014: 46). The bargaining power of suppliers is probably high if the following conditions apply: Concentrated suppliers High switching costs Supplier competition threat Because mobile games industry operates in form of e-commerce providing digital goods, identifying supplier power is a bit more challenging. However, the most evident suppliers would be the hardware and engine suppliers but companies offering the distribution channel to the market such as Apple, Google, Amazon and Microsoft could be regarded suppliers as well. There are only a few engine suppliers for mobile developers like Unity, and lately CryENGINE and Unreal, so these concentrated suppliers have power over developers. The distribution channels are also concentrated suppliers leaving developers in a weak negotiating position for terms and revenue cuts. Currently Google and Apple take a 30 per cent share of the developers’ generated revenues (Fischer 2014). The high switching costs would occur if the developer would not want to interact with the suppliers and for instance build their own engine or distribution platform (Fischer 2014). Moreover, switching from other operating platform to another would mean porting the game to the new platform, which would also result in switching costs. Switching costs from Unity to another engine would be significant as Unity offers a free version of its engine. Supplier competition threat implies that the suppliers have the power to cut out the buyers acting as middlemen, which is called forward vertical integration (Johnson et al. 2014: 46). Unity and Google have started to develop games as well rather than just supply the game developers with development tools and a distribution channel. However, as Unity still needs developers as buyers and Google needs developers to supply its app store with more products and to generate profit for them, the forward vertical integration of these suppliers is not the biggest threat to profitability (Fischer 2014).
18 (71) v. Competitive rivalry “At the centre of five forces analysis is the rivalry between the existing players- ‘incumbents’ in an industry. The more competitive rivalry there is, the worse it is for incumbents. Competitive rivals are organisations with similar products and services aimed at the same customer group…” Johnson et al. (2014: 41). There are five (5) different factors to competitive rivalry: Competitor balance Industry growth rate High fixed costs High exit barriers Low differentiation As concluded earlier, free-to-play mobile games industry does not require high capital investment; therefore the high fixed costs factor does not affect competitive rivalry in the industry. The exit barriers in the industry are also relatively low due to same reason. The high growth rate of the industry is a positive factor when looking solely at competitive rivalry because the incumbents can grow with the market rather than try to capture market share from other incumbents in low growth or declining industries (Johnson et al. 2014: 42). According to Porter (cited in Suter 2012) when incumbents are roughly equal in size, the competition intensifies. The statement was true in free-to-play mobile industry not too long ago, however it has gradually changed as the most successful mobile game studios top the static top charts month after month. As the CEO of mobile game company SGN Chris DeWolfe points out (Campbell 2014) “it's [mobile games market] not a fragmented market anymore. It's about powerhouses. It has begun to create a chasm between the really large mobile players and the others.” Moreover, low differentiation in mobile games is evident, and Porter states homogeneous products/services lead to zero-sum competition, which in turn cuts the profitability (Suter 2012). The main purpose of Porter’s Five Forces is not to merely list the forces but to gain insight on whether the industry is a good one to compete or not (Johnson et al. 2014: 48). The competitive forces affecting the profitability in mobile industry are rather
19 (71)

strong, and especially the low barrier to entry should make possible entrepreneurs
think twice about entering the industry as Johnson et al. (2014) state that low entry
barriers are precisely the wrong reason to choose an industry because the market is
prone to be highly or perfectly competitive, as is the case in free-to-play mobile games.

2.5     Marketing

2.5.1    Transaction Approach VS Relationship Approach

Many scholars (Huotari & Hamari 2012; Stenros & Sotamaa 2009), industry
representatives (Campbell 2014; GamesIndustry.biz 2008; Sheffield 2008) and authors
(Clark 2014; Lovell 2013; Seufert 2014) discuss the shift to games as services, rather
than products. Stenros & Sotamaa (2009: 7) call it the rise of the service paradigm
where “the implication is that players crave a wider spectrum of services, not just
digitally distributed game content”. Additionally, Clark (2014: 6) thinks that the shift to
free-to-play and the rise of games as services go hand-in-hand: “With a freemium
game we are no longer selling the gameplay itself…We have to focus on selling things
that players want to help improve their playing experience.”

As there is a consensus across the literature that games are evolving into services, and
are digital in nature, the traditional marketing plans need to be reconsidered. “While
basic marketing principles – such as positioning and segmentation- will remain, digital
channels will extend and accelerate how marketers engage consumers” (Wertime &
Fenwick 2008: 29). Nevertheless, Clark (2014) and Hamari & Lehdonvirta (2010)
discuss the merging of classical marketing theory with game design and how designers
still need to be aware of the core marketing mix variables such as 4P’s (Price, Product,
Promotion, Place).

Grönroos (2007) outlines an alternative view in marketing: customer management in
service competition. For service competition, Grönroos (2007: 6) offers the following
definition “competitive situation where the core solution is the prerequisite for success,
but where the management of a number of services, together with the core solution,
forms a total service offering and determines whether or not the firm will be
successful.” In other words, the core product/service needs to be good enough in
20 (71)

order to attain business and even a competitive advantage but to reach sustainable
competitive advantage the core offering needs to be supplemented by the
development of customer relationships encompassing various services.

Grönroos (2007) argues that in traditional marketing theory acquiring new customers
and making sales are the main goals with not much consideration of repeat customers
or building relationships with them. He labels the traditional marketing theory as
transaction marketing. Grönroos continues to explain that in today’s highly competitive
and increasingly more global markets where acquiring new customers is costly, it is
equally important to focus on keeping current and repeat customers satisfied and
retained, thus a transaction oriented marketing approach is not viewed effective or
appropriate. Instead, Grönroos (2007) writes that the interactions and relationships
between parties (service provider and customer) are considered the core of marketing
and if these relationships are managed appropriately, the sales will follow.

In video games, the transaction marketing model works well with boxed games sold in
retail stores. With boxed games, the marketers merely need to persuade the customer
to pass the threshold to complete a one-time purchase and beyond that transaction,
the marketing efforts or game design are not designed to build further relationship
with the customer (see table 1). With free-to-play business model, where the entry to
the game is free, the marketing efforts along with game design aim to build
relationships with customers as well as aid the customer in transitioning between the
relationships stages of acquisition, retention and monetisation (Hamari & Järvinen
2011).

Table 1. Business models and the shift in customer relationship building emphasis. Adapted
from Hamari & Järvinen (2011: 14).

 Game type        Primary              Pricing             Design                Relationship
                  revenue                                  emphasis              emphasis
 Boxed games      Retail               Single price        Attractiveness,       Acquisition
                                                           lots   of   initial
                                                           content
 Free-to-play     Virtual       good   Microtransactions   Virality,             Acquisition,
 games            sales,    in-game                        incentivising         retention,
                  advertising                              game mechanics        monetisation
21 (71) 2.5.2 Customer Relationship Management Customer relationship management (CRM) is a holistic marketing-led approach to building and sustaining long-term business with customers, which was formed by a combination of direct marketing, relationship marketing, database marketing and one- to-one marketing approaches. Electronic customer relationship management (e-CRM) refers to using digital communication technologies rather than traditional communications (Chaffey & Ellis-Chadwick 2012: 312-314). The main concept of CRM is to deliver tailored and timely marketing communications to individual customers (or customers with similar needs) by collecting databases of past, current and potential customers and creating different segments of the target customers by value, their behavioural patterns and their current position in the customer relationship lifecycle. Additionally, customer relationship management paradigm includes four (4) marketing activities (see figure 5 for supporting activities): 1. Customer selection 2. Customer acquisition 3. Customer retention 4. Customer extension By studying the four marketing activities in figure 5, it is evident that choosing the right media channels in each stage is crucial in generating quality traffic. However, the challenge for each business is to identify the most cost effective channels. Figure 5. The four classic marketing activities of customer relationship management. Chaffey & Ellis-Chadwick (2012: 324).
22 (71)

2.5.3   Customer Relationship Lifecycle

Citing Grönroos (2007: 269-270) there are three (3) distinct phases in the customer
relationship lifecycle: 1) the initial phase, 2) the purchasing phase and 3) the
consumption (or usage) phase.

Grönroos (2007) suggests that identifying the present position of a customer in the
lifecycle has great implications on marketing objectives and the chosen marketing
activities as they will differ at each phase. In the initial stage, the customer is not yet
aware of the company or its services, therefore the marketing objective is to spark
interest through, for example, promotion to nudge the customer into the next stage,
the purchasing process.

The customer in the purchasing process then evaluates the company’s value
proposition in relation to other companies’, and if the customer should choose to
accept the promise, they make the first purchase in order to try the service, thus
moving on to the final stage of the process, the consumption. During the consumption
process, the promises made in the purchasing process should be fulfilled leading to a
positive perceived service quality and customer satisfaction. Naturally, the customer
might exit the lifecycle circle at any point without transitioning to the next phase, and
ultimately after the consumption phase the customer might either become a repeat
customer or if the perceived quality was negative, leave completely.

In free-to-play, however, it is arguable that there are two purchasing processes: the
process leading to the decision to download a free game, and the process to purchase
virtual items within the game itself. As some players can go through the whole
customer relationship lifecycle without ever making a purchase or the game can be
solely supported by ad revenue, the purchasing process referred to in this work
pertains to the former.
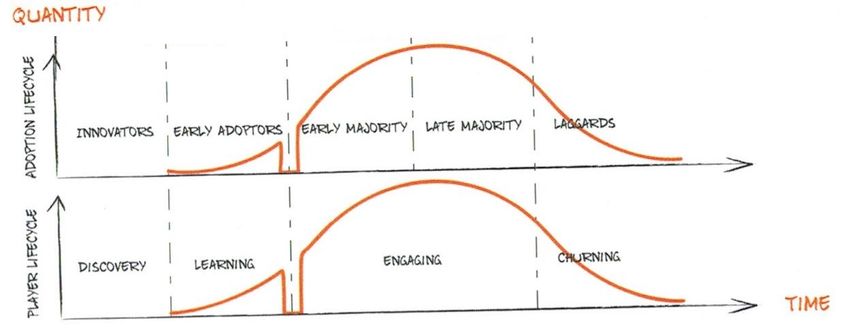
23 (71)

2.5.4   Player Lifecycle

Clark (2014: 63-70) portrays player lifecycle, which shows the player’s engagement
levels with a game service. Player lifecycle has four (4) phases as illustrated in figure 6
below, which are: 1) discovery 2) learning 3) engaging and 4) churning. The figure
also shows the player lifecycle in comparison to the technology adoption lifecycle and
the gap, or “chasm”, found between the innovators/early adopters and the early
majority, and in between the phases of discovery/learning and engaging.

Figure 6. A comparison of technology adoption and player lifecycle. Adapted from Clark (2014:
63).

Geoffrey Moore, writer of the transformational “Crossing the Chasm”, describes the
technology adoption lifecycle as “the evolution of any given community’s acceptance of
a disruptive innovation” (Schawbel 2013) and his book “describes the gap between the
adoption patterns and preferences of different user segments” (Mohr Davidov Ventures
2014). In Moore’s work, the early user segments are combined of technology
enthusiasts (innovators) and visionaries (early adopters) and the early majority is
combined of pragmatists (Chasm Institute 2014). Clark (2014) suggests that these
user segments in video games are hard-core gamers (innovators, early adopters) and
the casual gamers are the early majority, and these user segments differ in their
behaviour, needs and abilities to accept a game service.

1) Discovery. In player lifecycle, a player who is in the discovery phase first has to be
made aware of the game by using the appropriate channels ranging from word-of-
mouth to app store optimisation, creating an interest to play while setting
24 (71)

expectations. In this phase, it is of upmost importance to make the exposure as
enticing as possible, which will make the player feel the game is worth to invest their
time and possibly money into. Additionally, acquiring the game should be made
effortless. (Clark 2014; Luton 2013c: 143)

In the discovery phase, the traffic can come from multiple different sources like
advertising or viral traffic, however the majority of players who are exposed to the
game offering at this phase do not follow-up with a desired action which is download
the game and start engaging (Luton 2013c: 143). Thus, the number of downloads at
the discovery phase is not the ultimate measure of success because some players
could have up to 75 games on their devices, out of which only a few might be used
regularly and roughly half of the games installed are either ignored or uninstalled
immediately. The success rather depends on the number of people who, after
downloading, actually play the game. (Clark 2014; Millman 2014; Ohayon 2012)

2) Learning. As games are analogous to experience goods, goods that have to be
experienced first to be able to appreciate the value in them (Shapiro & Varian 1999:
5), the learning phase of the player lifecycle is an extremely delicate process where the
player has started to learn whether the game fulfils the expectations set earlier. This
phase is rather fragile, especially in free-to-play games, as everything that hinders the
enjoyment of the gameplay such as obtrusive placement of ads, pushing to monetise
too early or a steep learning curve of the game may result in a backlash of players
quitting the game and moving onto the next one (Clark 2014).

In addition, the learning phase is crucial in deepening the players’ engagement with
the game service and transition into active users (Clark 2014). The gap in between the
learning phase and engagement phase as illustrated in figure 6 (refer to page 23)
denotes a relatively large proportion of players who never cross the chasm into
engaged users but exit the game instead. To get over the chasm, and transition into
engagement, requires full adoption of the game service by the player. Furthermore,
Hamari and Järvinen (2011: 10) pinpoint the learning phase as sort of a bottleneck
during which supportive user retention activities towards further engagement should
be started.
25 (71)

3) Engaging. Once, and if, the player crosses the chasm and becomes an active user,
the level of engagement can be further measured by tracking the frequency of use,
which tracks the player’s average amount of game sessions in a day. In this phase, the
ratio between Daily Active Users (DAU) “the number of unique players playing on a
given day” as well as Monthly Active Users (MAU) “the number of unique players
playing in a given month” (Luton 2013c: 20) is also important to draw conclusions of
how regularly a proportion of players return to the game.

The engagement is the most valuable phase of the player lifecycle both in terms of
revenue generation and creating evangelists for the game, who will in turn help with
acquiring new players. Clark (2014), while working at Papaya Mobile, discovered that
repeat players who monetised well started spending money after engaging with the
game for approximately 8-12 days, which is quite long. The goal for the developer is to
provide the player with enough content, new features, activities and a delightful
gameplay experience in order to retain the customer for as long as possible to be able
to tap into this highly valuable audience. Moreover, Clark (2014) reminds that all the
segments, whether paying or non-paying players, should be supported as they are all
valuable, although not necessarily in terms of revenue. The non-paying users who are
engaged with the game are more accepting of in-game advertising, as they understand
it to be a necessary evil in order to play the game for free, and they could also opt-in
for incentivized advertising or sharing to gain in-game currency or other rewards.

4) Churning. Although free-to-play games are looked at by most developers as
continuous services, for which new updates and content are made by a live-team, at
some point it is inevitable that players will leave the game service for good, called
churning. It is important to manage churning phase appropriately because churning
players provide a lot of information if the company has implemented suitable analytics
software into the game. The metrics gathered can tell a great deal about the reasons
behind churning, whether it is a too steep learning curve at level two in the game or
frequency or placement of ads etc. Studying these metrics will help the developers
tweak the marketing efforts or game design according to gathered data, further
improving retention. The players, who enjoyed the game, hopefully continue to
recommend the game after churning and also create hype for the upcoming titles from
the same developer. (Clark 2014; Luton 2013c)
You can also read