DISTRICT ENERGY SYSTEMS in CHINA Options for optimisation and diversification - NET
←
→
Page content transcription
If your browser does not render page correctly, please read the page content below

IEA SERIES IN SUPPORT OF IEA–CHINA ENERGY CO-OPERATION

                                                         DISTRICT ENERGY
                                                         SYSTEMS in CHINA
                                                         Options for optimisation
                                                              and diversification
INTERNATIONAL ENERGY AGENCY
    The International Energy Agency (IEA), an autonomous agency, was established in November 1974.
   Its primary mandate was – and is – two-fold: to promote energy security amongst its member
  countries through collective response to physical disruptions in oil supply, and provide authoritative
 research and analysis on ways to ensure reliable, affordable and clean energy for its 29 member
countries and beyond. The IEA carries out a comprehensive programme of energy co-operation among
its member countries, each of which is obliged to hold oil stocks equivalent to 90 days of its net imports.
The Agency’s aims include the following objectives:
n Secure member countries’ access to reliable and ample supplies of all forms of energy; in particular,
through maintaining effective emergency response capabilities in case of oil supply disruptions.
 n Promote sustainable energy policies that spur economic growth and environmental protection
 in a global context – particularly in terms of reducing greenhouse-gas emissions that contribute
  to climate change.
    n Improve transparency of international markets through collection and analysis of
     energy data.
        n Support global collaboration on energy technology to secure future energy supplies
         and mitigate their environmental impact, including through improved energy
            efficiency and development and deployment of low-carbon technologies.
                n Find solutions to global energy challenges through engagement and
                   dialogue with non-member countries, industry, international
                       organisations and other stakeholders.
                                                                                                 IEA member countries:
                                                                                         Australia
                                                                                  Austria
                                                                            Belgium
                                                                       Canada
                                                                   Czech Republic
                                                                Denmark
                                                             Estonia
                                                          Finland
                                                       France
                                                     Germany
                                                    Greece                                Secure
                                                  Hungary
                                                                                                  Sustainable
                                                                                                            Together
                                                Ireland
                                              Italy
                                             Japan
                                            Korea
                                            Luxembourg
                                           Netherlands
                                           New Zealand
                                           Norway
                                           Poland
                                            Portugal
                                             Slovak Republic
          © OECD/IEA, 2017                    Spain
  International Energy Agency                  Sweden
          Website: www.iea.org                   Switzerland
                                                  Turkey
                                                    United Kingdom
          Please note that this publication           United States
            is subject to specific restrictions
            that limit its use and distribution.    The European Commission
                   The terms and conditions are       also participates in
            available online at www.iea.org/t&c/         the work of the IEA.
© OECD/IEA 2017                                                    District Energy Systems in China
                                                                  Options for Optimisation and Diversification

                                                                                                                 Page | 3

The Tsinghua University Building Energy Research Center (BERC) was created in 2005. BERC is
devoted to developing energy-efficient and environmentally responsible buildings in China, in
accordance with national and international energy and environmental targets, including buildings
research and innovation.
The principal research activities within BERC include:
    •    Assessment of the current buildings status in China and strategic outlooks on buildings
         energy consumption and efficiency.
    •    Occupant behaviour and buildings simulation research.
    •    Research and development of innovative high-efficiency buildings technology and
         systems.
    •    Energy efficiency application research on sub-sectors, including: space heating in
         Northern China; rural residential buildings and urban residential buildings; and public and
         commercial buildings.
BERC is involved in international exchange and co-operation projects, including its ongoing
collaboration with the International Energy Agency. BERC is also responsible for the Annual
Report on China Building Energy Efficiency, which has been published annually since 2007.
District Energy Systems in China                                                         © OECD/IEA 2017
           Options for Optimisation and Diversification

           Foreword
           International Energy Agency
           The People’s Republic of China (hereafter, “China”) has the largest district energy system in the
Page | 4   world, with more than 200 000 kilometres of networks providing heat to close to 9 billion square
           metres of building space, which is equivalent to more than one fourth of the total floor area of
           the United States. With China’s rapid urbanisation and increasing demand for thermal comfort,
           energy use in heating and cooling systems is set to rise even higher over the coming decades,
           placing heavy pressure on energy supply and the environment.
           Coal continues to be the predominant fuel for heat production, but a rapid switch to other fuels
           such as gas, geothermal or excess heat is under way. Unlocking the potential of cleaner district
           energy systems is key for China’s urban development strategy. Modern district energy can
           provide reliable heating and cooling services while improving energy efficiency and reducing
           greenhouse gas emissions, serving as a flexible and efficient medium to transform the energy
           sector.
           Within the context of China’s urbanisation and policy framework, this report highlights cost-
           effective options and business models that can decarbonise and optimise district energy systems.
           Through clean energy measures, China can continue to make a transition away from coal and
           improve air quality.
           The International Energy Agency (IEA) has more than 20 years of in-depth bilateral co-operation
           with China in a wide range of fields, including energy security, statistics, policy and analysis. China
           joined the IEA family as an Association country in 2015. A three-year work programme was
           agreed in February 2017, supported by the establishment of an IEA China Liaison office in Beijing.
           Most recently, in December 2017, I had the pleasure to meet with Mr. Zhang Gaoli, Vice Premier
           of the People's Republic of China, to discuss deepening IEA-China cooperation its cooperation
           during the country’s economic and energy transition.
           This publication benefited greatly from the strong relations that now exist between the IEA and
           China. With the support of the Tsinghua University Building Energy Research Center (BERC) and
           the National Development and Reform Commission (NDRC) of China, it builds on the IEA’s
           expertise in clean district energy technologies.
           China has entered a new era in which environmental considerations such as reducing air
           pollution and carbon dioxide emissions have gained great importance. More efficient and cleaner
           district energy can make a key contribution to mitigating climate change and air pollution, while
           offering numerous benefits to households and businesses alike in terms of cost and comfort.
           During the IEA Ministerial meeting in November 2017, with attendance from China, participants
           recognised the major importance of heating and cooling in developing an economical, secure and
           sustainable energy sector. It is my hope that this publication will support these efforts, both in
           China and globally.

           Dr. Fatih Birol
           Executive Director
           International Energy Agency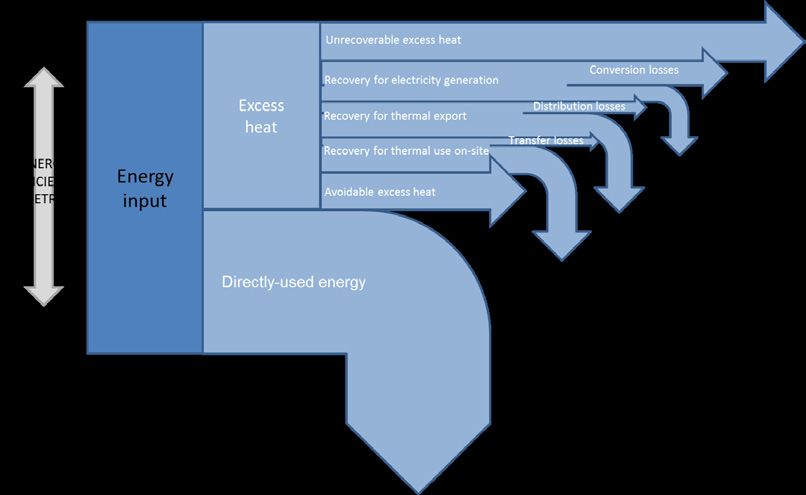
© OECD/IEA 2017                                                   District Energy Systems in China
                                                                 Options for Optimisation and Diversification

Foreword
Tsinghua University Building Energy Research Center
This IEA publication, District Energy Systems in China: Options for optimization and diversification
is perfectly timed to appear just as China began to move towards cleaner winter heating. The Page | 5
dispersed large and small coal boilers in suburban area for space heating are one of the major
sources of air pollution in the Northern part of China. Although the amount of coal burned by
boilers is lower than the total coal used by power plants in this area, the contribution to PM2.5
emissions is at least 7 times higher than for power plants. To combat air pollution, China has
implemented stringent measures to curb the use of coal from small and medium-sized boilers for
residential and industrial use, prompting the switch to natural gas or electricity as a cleaner
alternative. However, the high prices and limited supplies of natural gas and the high price of
electricity have put policy makers in a dilemma.
What would be the sustainable and affordable options for China to replace the poor efficiency
and heavy polluting coal boilers? This pioneering publication indicates options to improve air
quality and decarbonise district energy system within the context of potential energy sources and
local and regional synergies. Case studies included in this report also demonstrate how modern
district energy system can use diverse energy sources and technologies to improve energy
efficiency.
Tsinghua University and the International Energy Agency (IEA) have a long-standing relationship
on cooperative activities related to energy issues. In 2015, Tsinghua University and the IEA signed
a letter of intent to expand co-operation. This report on China’s district energy system is an
important concrete outcome of our ongoing co-operation.
Many cost-effective options are already available in the buildings sector that can reduce both
energy consumption and air pollution. As indicated by this report, a clear policy framework and
predictable market context are needed to support cost-effective diversification of heat sources,
including renewables. Meanwhile, locally-based and tailored solutions are required to avoid
unintended consequences of reform. I hope that this publication can be used as a tool to
evaluate policies and programs in China.

Pr. Jiang Yi
Vice dean
School of Architecture, Tsinghua University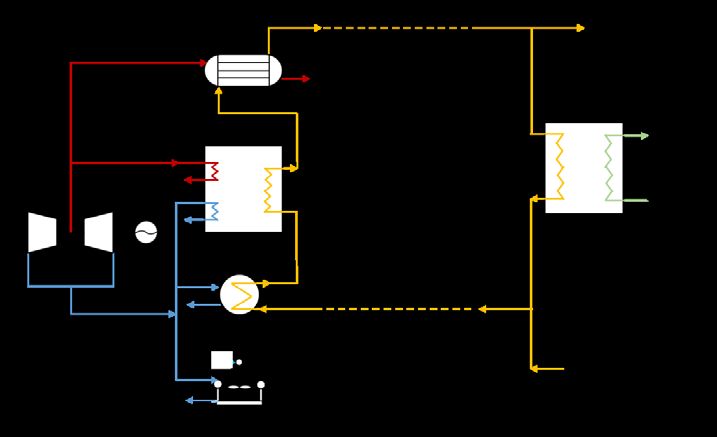
District Energy Systems in China                                                      © OECD/IEA 2017
        Options for Optimisation and Diversification

        Acknowledgements
         This publication was prepared as a collaborative project according to the Three-Year Work
         Programme between the International Energy Agency (IEA) and the National Energy
         Administration (NEA) of China, and according to the letter of intent between the IEA and
Page | 6 Tsinghua University.

        It was jointly prepared by the IEA Office of Global Energy Relations, the IEA Directorate of
        Sustainability, Technology and Outlooks and the IEA Directorate of Energy Markets and Security,
        along with the Tsinghua University Building Energy Research Center (BERC). The report was
        supported by the National Development and Reform Commission (NDRC) of the People’s
        Republic of China.
        The authors were David BÉNAZÉRAF, Ute COLLIER, Brian DEAN, John DULAC, Volker
        KRAAYVANGER, and Pharoah LE FEUVRE of the IEA, Professor XIA Jianjun and LI Yemao from
        Tsinghua BERC, and LIU Yang from the Harbin Institute of Technology. Laszlo VARRO, IEA Chief
        Economist, provided generous expert input. Kevin Tu, IEA China programme manager, provided
        overall guidance.
        The report benefited from valuable inputs, reviews and support from other experts within the
        IEA, especially Thibaut ABERGEL, Simon BENNETT, BI Yunqing, Amos BROMHEAD, Jean-Baptiste
        DUBREUIL, LYU Zhong, YANG Lei, Aya YOSHIDA, and ZHOU Ruiyu, as well as LI Xiang and WANG
        Shuli from the IEA China Liaison office. Lisa-Marie GRENIER and Andrew LALLY provided
        significant assistance.
        Andrew JOHNSTON edited this publication. The IEA Communication and Information Office,
        including Rebecca GAGHEN, Muriel CUSTODIO, Astrid DUMOND, Therese WALSH, Katie RUSSELL
        and Bertrand SADIN, was crucial in designing, translating and publishing this report.
        Two workshops were organised to obtain essential input to this study. The publication also
        benefited greatly from the support, expertise and reviews of Chinese and other international
        experts from energy companies and research and government institutions, especially ZHENG
        Lijun, QI Jingfeng (China District Heating Association), LIU Weitao (China Electricity Council), JUN
        Li (China Energy Conservation Association), ZHAO Yongqiang, DOU Kejun (China National
        Renewable Energy Centre), John YU, CHE Alfred Wei (Danfoss), LIANG Chuanzhi (Ministry of
        Housing and Urban-Rural Development), REN Shuben, WANG Shancheng, ZHAO Huaiyong, JIANG
        Jinhao, XIONG Huawen (National Development and Reform Commission), Jaap KOPPEJAN
        (Procede Biomass BV), Ao Luo, Professor JIANG Yi (Tsinghua University Building Energy Research
        Center), CHEN Zhuolun (UNEP Copenhagen Centre on Energy Efficiency), Ragnhei GUDMUND
        (Veolia), and members of the District Heating and Cooling Technology Collaboration Programme
        (DHC TCP).
© OECD/IEA 2017 District Energy Systems in China
Options for Optimisation and Diversification
Table of contents
Executive Summary ......................................................................................................................... 11
Introduction .................................................................................................................................... 13
District energy systems play a key role in China ............................................................................. 17 Page | 7
Rapid urbanisation fuels district energy growth ......................................................................... 18
Urbanisation favours centralised district energy systems ...................................................... 18
Integrated energy and urban/regional planning could boost district energy......................... 19
District energy systems are expected to expand ........................................................................ 21
Heat demand will continue to increase .................................................................................. 22
Demand for cooling is growing rapidly ................................................................................... 24
Policy framework is fostering further development ................................................................... 25
Opportunities for cleaner district energy systems in China ............................................................ 29
The role of energy efficiency ....................................................................................................... 30
The role of excess heat................................................................................................................ 33
Excess heat from co-generation: potential and options for heating ...................................... 34
Industrial excess heat potential and options for heating and cooling .................................... 35
Barriers and market frameworks for excess heat options ...................................................... 38
The role of renewables................................................................................................................ 40
Renewable energy options for heating and cooling ............................................................... 42
Scaling up solid biomass district heating in China................................................................... 44
The economics of renewable options ..................................................................................... 49
The role of natural gas ................................................................................................................ 52
Business models .............................................................................................................................. 55
Applying district energy business models in China ..................................................................... 55
Impact of sector coupling on business models ........................................................................... 61
Pricing options ............................................................................................................................. 61
Recommendations in the Chinese context ..................................................................................... 65
The IEA CHP and DHC Collaborative and the Technology Collaboration Programme .................... 67
Acronyms, abbreviations and units of measure.............................................................................. 68
References ....................................................................................................................................... 70
Glossary ........................................................................................................................................... 74District Energy Systems in China © OECD/IEA 2017
Options for Optimisation and Diversification
List of figures
Figure 1 • Central heating fuel mix in China (2016, by floor area) ................................................. 15
Figure 2 Space heating floor area coverage by district heat networks in northern urban China 17
Figure 3 • Urban population growth and district heat floor area growth, 2005–15 ...................... 18
Page | 8
Figure 4 • Interconnections and potential energy synergies within an integrated energy system 21
Figure 5 • NUH energy consumption (city networks) in 2015 and potential demand growth in
2020............................................................................................................................... 23
Figure 6 • Typical energy efficiency ratios of split-package air conditioning units in 2015............ 25
Figure 7 • Sources of “free” heat and cooling energy .................................................................... 33
Figure 8 • CHP heat capacity and urban DH demand ..................................................................... 35
Figure 9 • Global technical IEH recovery potential from selected applications in the iron and steel
sector ............................................................................................................................. 36
Figure 10 • Global technical IEH recovery potential from selected applications in the
cement sector................................................................................................................ 37
Figure 11 • Excess heat management and possible uses in the industrial energy chain................ 39
Figure 12 • Share of fuels in Swedish (left) and Lithuanian (right) district heating plants
(1998-2015) ................................................................................................................... 42
Figure 13 • Solid biomass consumption for heating in China (2006-16) and 2020 target .............. 46
Figure 14 • LCOH comparison for solid biomass, natural gas and coal .......................................... 47
Figure 15 • Biomass boiler investment costs by capacity ............................................................... 49
Figure 16 • Share of natural gas in heat production in China, 1990-2015...................................... 52
Figure 17 • Urban and county gas consumption for district heating (2015, 11 bcm) .................... 53
Figure 18 • Placing district energy markets within the broader energy system framework .......... 55
Figure 19 • Energy production competition business model ......................................................... 56
Figure 20 • Utility-led business model with third-party access energy for excess heat recovery .. 58
Figure 21 • ESCO-integrated business model ................................................................................. 59
Figure 22 • Heat pricing structure in China..................................................................................... 62
Figure 23 • The production cost structure for district energy systems .......................................... 63
Figure 24 • The district energy network cost structure .................................................................. 63
Figure 25 • The integrated district energy system cost structure .................................................. 63
List of maps
Map 1 • China’s climate zones for energy consumption and the Northern Urban Heating area .. 14
Map 2 • Biomass resources in China and key coal phase-out areas............................................... 45
Map 3 • Provincial share of central heating consumption in urban (county) areas, 2015 ............. 53
List of tables
Table 1 • Buildings sector floor area activity data in China and outlooks to 2030 (billion m2) ...... 19
Table 2 • Existing and potential future district heat floor area coverage in key NUH regions ....... 22
Table 3 • Main district energy policy documents, regulations and support frameworks .............. 26
Table 4 • End user heating fuel price comparison in China ............................................................ 47
Table 5 • Major policy interventions that support renewables in district energy in
selected countries ............................................................................................................ 51
Table 6 • Financial internal rate of return with various fuels as heat sources in Qingdao ............. 58
Table 7 • Cumulative investment and benefit over three phases of the Qianxi excess heat
project .............................................................................................................................. 60© OECD/IEA 2017 District Energy Systems in China
Options for Optimisation and Diversification
List of boxes
Box 1 • A district heating assessment tool for local planners......................................................... 21
Box 2 • Advanced district heating solutions for energy-efficient, low-carbon communities ......... 29
Box 3 • Case study: Sewage heat use in Shenyang, Liaoning province........................................... 31
Box 4 • Potential for nuclear heating in China ................................................................................ 38 Page | 9
Box 5 • Case study: Excess heat from a CHP plant in Datong, Shanxi province.............................. 40
Box 6 • Case study: Geothermal district heating in Paris and Munich ........................................... 42
Box 7 • An economic assessment of solid biomass and natural gas heating fuels in China ........... 46
Box 8 • Case study: A deep geothermal heat system in Fengxi, Shaanxi province......................... 50
Box 9 • Case study: A multi-energy system in Suzhou Industrial Park, Jiangsu province ............... 50
Box 10 • The liberalisation process of China’s power market ........................................................ 56
Box 11 • Case study: Customised heat utility ................................................................................. 57
Box 12 • Case study: Heat market integrated business model in Qingdao, Shandong province ... 58
Box 13 • Case study: An ESCO-integrated business model in Tangshan, Hebei province .............. 60© OECD/IEA 2017 District Energy Systems in China
Options for Optimisation and Diversification
Executive Summary
The People’s Republic of China (hereafter, “China”) has many reasons to pursue a more
sustainable energy future. Energy resource scarcity and security are likely to be major incentives
in coming decades to curtail energy demand growth. Air quality is another key influence on
China’s increasing commitment to restrict inefficient and polluting fossil fuel combustion, along Page | 11
with government policies to limit carbon dioxide (CO2) and other greenhouse gas (GHG)
emissions.
China’s district heat network is the world’s largest. In 2015, it consumed more energy than the
entire United Kingdom. Coal still accounts for about 90% of the energy consumed for district heat
production, and carbon emissions from district heat have increased by 30% since 2010. With
enhanced conversion of energy and use of waste heat, more efficient district heating networks,
including through cleaner, high-efficiency coal-fired co-generation, can better mitigate
environmental impacts as compared to the dispersed coal boilers used in suburb areas for space
heating, which are one of the major sources of the air pollution emissions. While progress is
being made, the total impact of energy use and emissions from district heating and even district
cooling – on the Chinese economy, on local air quality and health, and on the overall well-being
of China’s population – is nevertheless significant.
China has great opportunities of lowering the environmental footprint of its district energy
system. While the country has pursued assertive public policy decisions in recent years, it is
essential to elevate cleaner, energy-efficient district energy as a priority for action so that policy
development and implementation can be achieved quickly.
China has already made significant progress towards many of the recommendations offered in
this report. However, further action is needed to pursue key policies and technological
developments that will improve the energy intensity and emissions footprint of district heating
and cooling systems. There is a window of opportunity for action, given the large expected
growth of district energy networks in the coming two decades, and in some cases policy could
take significant time to implement. Key findings in the report are as follows:
• China had the world’s largest district energy system in 2015, covering 192 721 kilometres
(km) of hot water networks and 11 692 km of steam networks.
• District heat generation in China consumed more than 185 million tonnes of coal-
equivalent (Mtce) in 2015, higher than national energy consumption of United Kingdom.
• The district heat network in China currently covers around 8.5 billion square metres (m2)
of buildings floor area, having nearly tripled since 2005, and it continues to expand.
• Total buildings floor area covered by the district heating network in Northern China
tripled over the last decade, representing nearly all the floor area growth in the northern
urban heating (NUH) area since 2005.
• As urbanisation continues, floor area in China is projected to increase another 40% by
2050, reaching more than 80 billion m², from 57 billion m² today. Floor area covered by
district heating in the NUH region is growing much faster than the urban population, but
there are important disparities among provinces.
• The Chinese government attaches great importance to the development of cleaner and
more efficient district energy systems.
• Severe air pollution, particularly in the densely populated Beijing, Tianjin and Hebei
regions, is already prompting a switch from coal to gas in some cities.District Energy Systems in China © OECD/IEA 2017
Options for Optimisation and Diversification
• China has significant potential to improve the overall efficiency of its district heating
network by recovering excess heat.
• Energy efficiency measures – ranging from continued improvements in new building
construction and deep energy renovations of existing buildings to greater deployment of
heat metering and better hydronic balancing of heat distribution – can play a key role in
Page | 12 improving the intensity of heating and cooling demand in buildings.
• China can use its abundant renewable resources, especially geothermal power and
biomass, to diversify supply and reduce coal use in district heating (and cooling). In 2015,
renewables supplied 28% of district heat in the European Union but only 1% in China.
• Optimising and diversifying district energy requires locally based and tailored solutions,
and business models with fair prices and appropriate government regulatory
environment.
This report analyses the ways to decarbonise, optimise and diversify district energy systems in
the Chinese context. It is intended to provide policy makers and district energy stakeholders with
the information they need to carry out improvements in China’s district heating system. If
implemented correctly, the transition towards more efficient, sustainable district energy in China
could simultaneously support economic growth, reduce total energy consumption, cut emissions
and improve environmental conditions.© OECD/IEA 2017 District Energy Systems in China
Options for Optimisation and Diversification
Introduction
The potential for cleaner and expanded district energy systems in the People’s Republic of China
(hereafter, “China”) is huge. Clean, energy-efficient district energy can be a key way to mitigate
climate change and air pollution, while improving costs and comfort for households and
businesses alike. Page | 13
District energy is a proven solution for delivering heating (including hot water) and cooling
services. Traditionally referred to as district heating and cooling (DHC), modern district energy is
an inherently diverse system that connects multiple thermal energy users through a network of
insulated pipes to efficient or renewable energy sources, such as co-generation (often referred to
as combined heat and power, or CHP), industrial excess heat (IEH), municipal waste, biofuels,
geothermal heat, and solar and wind energy. Because they can use diverse energy sources,
including locally available resources, district energy systems are flexible, allowing for economies
of scale as well as reliable heating and cooling services, without depending on a single supply
source.
District energy already plays a critical role in many parts of China, especially for heating. The
combination of fast urbanisation and increasing standards of living in China has contributed to
sustained rapid growth of the built environment, and hence of heating and cooling needs. In the
northern cities of China, heat is largely supplied by district heating networks for residential use,
while cooling systems throughout the country are mostly decentralised, typically using mini-split
air conditioners. Some district cooling networks already exist, with one of the largest systems in
Guangzhou in the southern belt of China, covering nearly 5 million m2.
The total buildings floor area of China is currently around 57 billion m², including around
13 billion m² in the northern urban heating (NUH) area (Map 1) (BERC, 2017). Around 6.7 billion
m² in the NUH region are covered by the central district heating network, with another estimated
1.8 billion m² covered by smaller county and village networks (MOHURD, 2015). As urbanisation
continues, total floor area in China is projected to increase another 40% by 2050, reaching more
than 80 billion m² (IEA, 2017a). Heating and cooling of buildings (excluding sanitary hot water)
are expected to continue accounting for around 40% of buildings energy demand, representing
roughly 9 exajoules (EJ) in final energy demand in 2050 in the IEA Reference Technology Scenario
(RTS), or around 310 Mtce.
Final energy for space heating demand in China is expected to increase by about 15% by 2030 in
the RTS, then gradually decrease to 2015 levels by 2050, given China’s considerable progress on
implementing and enforcing building energy codes and improving the efficiency of existing
buildings and the district heat network. While this does not represent a significant increase in
energy demand, space heating still accounts for around 35% of total final energy consumption in
buildings today, or as much as 40% of final energy demand when traditional use of biomass is
excluded. Significant untapped potential remains to improve the energy efficiency of district
heating in China. The primary energy consumption of heating in NUH buildings alone (around
185 Mtce, roughly 5.4 EJ) is more than 4% of China’s total primary energy supply.
In contrast with space heating, space cooling energy demand in buildings could as much as triple
by 2050, as growing incomes and demand for thermal comfort increase, especially in southern
China and in the hot summer and cold winter (HSCW) zone. Space cooling demand in buildings
has already grown by around 9% per year since 2010, and the vast majority of mini-split air
conditioners sold today are far less efficient than best-performing models available in China (IEA,
2017b). District cooling is one feasible energy solution and could provide flexible cooling service
delivery to buildings. However, district cooling solutions would need to be planned and
structured appropriately within the context of the local energy system.District Energy Systems in China © OECD/IEA 2017
Options for Optimisation and Diversification
Map 1 • China’s climate zones for energy consumption and the Northern Urban Heating area
Page | 14
Source: adapted from GB (1993), Thermal design code for civil building (GB 50176-93), China.
Key message • China’s climate zones have considerable impact on building energy demand, particularly
for space heating and cooling. Modern, efficient district energy can help meet that demand, taking
advantage of numerous energy opportunities and synergies for cleaner energy supply.
The Chinese government attaches great importance to developing cleaner and more efficient
district energy systems as part of its fight against air pollution. In March 2014, Premier Li Keqiang
declared a “war on pollution” during a major speech. In June 2014, President Xi Jinping called for
an “energy revolution” to reform energy production, consumption and innovation, while moving
faster to modernise outdated energy regulations and further promote international co-operation.
In December 2016, he also highlighted the importance of district heating for the northern areas.
During his report to the 19th National Congress of the Communist Party of China in October
2017, President Xi also pledged to build a “beautiful China” with a clean environment. The
concept has been incorporated into the two-stage development plan for building a “great
modern socialist country”.
There are several challenges to improving China’s district energy system, including its current
dependence on fossil fuels. In 2016, 33% of total floor area was covered by coal-fired boilers for
commercial heat production, and co-generation (mostly coal) accounted for 51%. Gas-fired
boilers accounted for another 12%, with the remaining coming from various sources (BERC, 2017)
(Figure 1). Overheating and network losses (3-5% of the total) represent around 20% of total heat
production (BERC, 2017). In 2015, pollutant emissions from coal-fired district heating reached
1,074 tons for SO2, 652 tons for NOX, and 279 tons for PM 2.5, representing 5%, 3% and 4% of
total energy related pollutants emissions respectively (IEA, 2016a). These shares are calculated
nationwide on an annual basis, hence much higher in winter time in the NUH. Heat reforms since
the early 2000s have had mixed results for building performance (in heating demand per m2).
While China’s buildings renovation programme has been successful, with around 1 billion m2© OECD/IEA 2017 District Energy Systems in China
Options for Optimisation and Diversification
renovated in Northern China as of 2015 (Liang et al., 2015), the heat metering programme has
been less successful, with resistance to meter use in some areas.
Figure 1 • Central heating fuel mix in China (2016, by floor area)
Coal-fired CHP
Page | 15
33% Coal boilers
0.4%
12% 0.4% 0.2% Gas boilers
1% Gas-fired CHP
3%
1% Geothermal
4%
Electric boilers and pumps
Industrial excess heat
Biomass
2%
Oil boilers
48%
Unknown
Sources: Building Energy Research Centre of Tsinghua University, 2017.
Key message • With the phasing out of coal-fired boilers, China’s central heating fuel mix is changing
rapidly.
While progress is being made, there is still potential to improve the energy intensity of existing
and forthcoming Chinese district energy systems. Better insulation and temperature control of
buildings (including retrofitting existing buildings) can limit demand. Expanded use of heat
meters can improve energy intensities by increasing consumer awareness of heat consumption
and eventually enabling better demand response (e.g. through deployment of smart meters
and thermostats). On the supply side, the efficiency and carbon intensity of heat production
can still be improved, as can efficiency of delivery, for example through retrofitting heating
networks. Hydronic balancing (e.g. using differential pressure controls to optimise heat
distribution) can also deliver significant energy savings while ensuring more accurate
temperatures.
In the context of air pollution and climate change, more stringent policies and additional
targets have been put in place and highlight the need to decarbonise and clean China’s heat
sector. Local authorities in China are now also assessed based on their achievement of
environmental targets. Improving district heat systems is therefore a high priority for action.
This report analyses the ways to decarbonise, optimise and diversify district energy systems in
the Chinese context. From technology, policy and market perspectives, it analyses the options
for improving district heating networks in Northern China as well as the potential for district
energy networks elsewhere in China where applicable. Prepared in collaboration with Tsinghua
University BERC and with contributions from the IEA China Liaison office, the report suggests
ways of choosing tailored solutions suitable for Chinese cities, including examples of best
practices and technologies for system modernisation. It looks at the role, benefits and
challenges of improving energy efficiency and using more excess heat and renewables, as well
as prospects for certain densely populated rural areas.
The report is divided into four main sections:
• assessment of the current situation and policy framework
• opportunities and solutions for cleaner district energy systems
• business models and pricing options
• policy recommendations in the Chinese context.District Energy Systems in China © OECD/IEA 2017
Options for Optimisation and Diversification
A notable selection of energy technologies and policies are critical to reducing energy
consumption, emissions and other negative impacts of China’s current district energy system.
This report focuses on policies and priorities that can help achieve the transition towards more
efficient, sustainable district energy in China while also meeting China’s socio-economic
objectives, including continued economic growth and improved living conditions.
Page | 16© OECD/IEA 2017 District Energy Systems in China
Options for Optimisation and Diversification
District energy systems play a key role in China
China hosts the world’s largest and fastest-growing district energy system (EHP, 2017; EHP,
2015). It principally consists of numerous district heating networks in northern China, which
provide space heating in urban areas in winter.1 These cover about two-thirds of floor area in the
northern urban heating (NUH) areas (approximately 8.5 billion m2) and around one-quarter of Page | 17
total urban floor area in China (BERC, 2016; IEA-BERC, 2015). In 2005, the district network only
heated around 40% of total NUH buildings floor area. Since then, nearly 95% of NUH floor area
growth has been covered by district heating additions (Figure 2).
Figure 2 Space heating floor area coverage by district heat networks in northern urban China
14
12
Buildings floor area (billion m2)
10 Other NUH
8
Town and village district
6 heat
4 City and county district
heat
2
0
2001 2002 2003 2004 2005 2006 2007 2008 2009 2010 2011 2012 2013 2014 2015
Note: Other NUH represents heated floor area in NUH areas that are not connected to the district heating network. In total, NUH floor
area represents around one-quarter of buildings floor area in China and nearly 40% of urban floor area.
Sources: MOHURD (2015), Statistical Yearbook of Urban and Rural Construction (城乡建设统计年鉴), China; BERC (2017), China
Building Energy Use 2017, Tsinghua University, Beijing.
Key message • Total buildings floor area covered by the district heating network in northern China
tripled over the last decade, representing nearly all the floor area growth in NUH China since 2005.
In 2015, China’s district energy system covered 192 721 km of hot water networks and 11 692 km
of steam networks. This represents around 650 gigawatts of thermal heat capacity (GWth), of
which 14% was for steam production. Around 49% of district heat produced in cities used co-
generation, which produced around 2 012 terawatt-hours (TWh) of heat in 2015. In total, district
heat produced in China amounted to 4 092 TWh of heat in 2015 (MOHURD, 2015).
District cooling, while far less common than district heat, also covers a sizeable area of buildings
in southern China. Two large networks in Guangzhou city represent around 130 km of pipeline
and 6 million m2 of cooled floor area, making up one of the world’s largest district cooling
networks.2 Additional district cooling or combined district heating and cooling (DHC) networks
are being considered in other cities in China’s southern region and hot summer, cold winter
(HSCW) region.
1
District heat in China seldom covers sanitised hot water demand.
2
Statistics on China’s district cooling networks are not complete, although studies on certain networks, the two largest
networks in Guangzhou by Tsinghua BERC, help to give a better sense of the current network situation in China. As a
comparison, the Enwave district cooling system in Chicago, United States, covers around 4.2 million m2 across around 12 km
of trench length (IDEA, 2012). The recently opened district cooling network in Singapore covers around 1.25 million m2 in a
network with 5 km of piping (Othman, 2016).District Energy Systems in China © OECD/IEA 2017
Options for Optimisation and Diversification
Rapid urbanisation fuels district energy growth
District energy growth in China over the last two decades has been spurred by China’s rapid
urbanisation, especially in northern urban regions. Since 2000, China’s urban population has
grown by 310 million people, of whom 125 million migrated to urban areas in the NUH area,
Page | 18 including the large urban areas of Beijing, Tianjin, Hebei, Shanxi, Liaoning, Jilin, Heilongjiang,
Shandong, Henan, Shaanxi, Gansu, Qinghai, Ningxia and Xinjiang. More than 40% of China’s
urban population, or roughly 322 million people, live in the NUH area. Of the 295 cities that have
more than 200 000 inhabitants, 132 are in the colder NUH areas.
Rapid urbanisation has particularly boosted energy consumption for space heating in the colder
NUH areas. In these areas, heating periods can last from October or November until March or
April, as long as six months in some regions. For instance, Beijing’s heating season is typically
from 15 November to 15 March. The coldest temperatures during the winter heating season are
often below -10°C in the severe cold zone and below 0°C to 5°C in the cold zone. As a result,
indoor heating is required by law in the two coldest northern zones, in contrast with the warmer
southern and HSCW zones.
Urbanisation favours centralised district energy systems
Urbanisation and the parallel rise of China’s middle class have stimulated demand for higher
living standards. More and more people expect not only greater floor area per person but also
improved thermal comfort – higher room temperatures during winter and lower temperatures
during summer. Average floor area per person in the NUH region (including public and
commercial space) nearly doubled from 2000 to 2015, reaching around 41 m2. At the same time,
the average number of people per urban household decreased from around 3.1 to nearly 2.8
(BERC, 2017). As a result, district-heated floor area in the NUH region expanded at more than
twice the rate of urban population growth. In some NUH cities, floor area covered by district heat
grew even faster (Figure 3).
Figure 3 • Urban population growth and district heat floor area growth, 2005–15
700%
600%
500%
400%
300%
200%
100%
0%
Urban population growth DH floor area growth (m²)
(2005–15, %) (2005–15, %)
Source: National Bureau of Statistics, 2017.
Key message • Floor area covered by district heating in the northern region is growing much faster than
urban population, but disparities among provinces are marked.© OECD/IEA 2017 District Energy Systems in China
Options for Optimisation and Diversification
Rising purchasing power in cities has also fuelled demand for thermal comfort. Average indoor
temperatures during winter tend to be 18°C to 22.5°C in urban areas but below 18°C in rural
areas (Gong and Werner, 2014). Cooling demand, typically in urban buildings, has also increased,
growing at an estimated 9% per year since 2010 (IEA, 2017a). Typically, cooling is met with
individual, room-sized air conditioning units (e.g. mini-splits), although there are several district
cooling networks. Page | 19
By 2022, the upper middle class could account for 54% of urban households and the mass middle
class 22% (Barton et al., 2013). While the middle class was previously concentrated in coastal
megacities, prosperity is rising in smaller cities, particularly in the colder northern and western
regions. This will stimulate additional growth in demand for heating services in buildings, along
with greater cooling demand across all of China, particularly as expectations of thermal comfort
grow in urban areas.
Since the 1950s, the growth of district energy networks in China has been spurred by government
investments in district heat. However, district heat in NUH areas has also made technical and
economic sense, as China’s high urban densities – of population, buildings and energy demand –
enable more efficient heating using centralised heat production and distribution. District heating
has also proved to be a flexible energy source, allowing for better planning and control of heat
distribution in cities, while taking advantage of technology choices that may not be possible at
the individual building scale, such as co-generation and industrial excess heat (IEH) recovery.
While many older NUH buildings, particularly those built before 2000, had poorly performing
building envelopes, new buildings that are more efficient have been built at a high rate,
especially since the mid-2000s, improving the overall thermal performance of NUH buildings (IEA-
BERC, 2015). The intensity of heat demand in NUH buildings has also been decreased by heating
reforms introduced in the 2000s – including the building renovation programme under which
more than 710 million m2 were modernised in northern China between 2011 and 2014 – and the
expanding heat meter market. Nearly 32 million meters had been installed in northern China by
the end of 2015 (RIC, 2016). This progress offers important opportunities throughout China’s
expansive NUH network to further improve the efficiency of heat supply and to move towards
optimised and advanced district heating.
Integrated energy and urban/regional planning could boost district energy
Urbanisation will continue to increase demand for district energy over the coming decade as an
expanding, more prosperous population stimulates floor area growth. Buildings sector floor area
in China could reach more than 72 billion m2 over the next 15 years, with NUH floor area
increasing by as much as 55% between 2015 and 2030, to reach 20 billion m2 (Table 1) (IEA,
2017a; BERC, 2016).
2
Table 1 • Buildings sector floor area activity data in China and outlooks to 2030 (billion m )
2030
2015
BERC IEA
Total 57.3 72.0 74.1
Urban 33.5 54.1 55.4
NUH 13.2 20.0 --
Rural 23.8 17.9 18.7
Sources: BERC (2016), China Building Energy Use 2016, Tsinghua University, Beijing; IEA (2017a), Energy Technology Perspectives
2017: Catalysing Energy Technology Transformations, OECD/IEA, Paris.
Key message • Urbanisation will stimulate floor area growth and district energy demand to 2030.District Energy Systems in China © OECD/IEA 2017
Options for Optimisation and Diversification
While new urban buildings in China are significantly more energy-efficient, heating intensity
improvements in the NUH region (in terms of final energy demand per m2) are still unlikely to
keep up with the 3% average annual floor area growth expected to 2030. In the IEA Reference
Technology Scenario (RTS), district heat demand to 2030 increases by around 10%, to 48 Mtce
(1.4 EJ) in final energy demand, which would place greater onus on the NUH district heat network
Page | 20 to meet energy conservation and local air pollution targets (IEA, 2017a). To stabilise or even
reduce total final district heat demand in buildings (e.g. as described in the IEA 2°C Scenario [2DS;
IEA, 2017a]), further effort would be needed to move the NUH buildings stock towards high
efficiency levels within a more integrated district energy system. This would include enhancing
building envelope performance (e.g. deep energy renovations for older buildings and high-
performance new building construction), increasing heating installation efficiency through proper
systems balancing, and ensuring appropriate energy planning.
During a key meeting on urbanisation chaired by President XI Jinping in December 2013 following
the 3rd Plenum of the Chinese Communist Party, the Chinese government laid out the main
orientations for China’s urban development. This plan to rebalance urban growth included a new
urban planning and land management policy that favours the development of small- and
medium-sized cities (less than 1 million inhabitants) while limiting the growth of large (1 million
to 5 million) and very large cities (more than 5 million). The plan also seeks to limit urban sprawl
and increase densification of cities (Xinhua, 2013).
This new urban development strategy is likely to expand district energy systems in smaller urban
areas. Historically, centralised district heat networks have been promoted in large cities and
counties, while biomass and heat pumps have been favoured in smaller urban areas and rural
parts of the severe cold and cold zones. However, smaller district heating systems have started to
appear in less populated towns and villages (within the small- to medium-sized city categories).
Since 2006, floor area covered by district heat in NUH towns and villages grew by more than
350 million m2, which is as fast as growth in city and county networks during the same period,
despite the 15-fold difference in total network size.
District heating networks in China could be dramatically improved by moving towards better-
planned urban areas with improved densities and greater distributed (i.e. decentralised) energy
potential – including updating and improving existing NUH district heating networks. Recent
efforts, including the Warming Programme by Waste Heat issued in 2015 by the National
Development and Reform Commission (NDRC), are positive steps towards identifying appropriate
ways to improve district energy systems in China. This includes mapping of heat demand relative
to potential heat supply, such as the IEH study in Hebei province by Tsinghua University, which
could be used to develop tailored local or regional plans to improve district energy systems.
Beyond identifying potential energy sources for meeting heating and cooling demand, urban
and/or regional energy planning and development strategies should identify the policies and
market mechanisms needed to achieve that potential. This will require co-ordination among the
appropriate buildings actors, planning authorities and energy stakeholders (e.g. industrial heat
providers) to support the cost-effective and energy-efficient development of integrated energy
systems in urban areas (Box 1). Urban/regional planning and policy strategies would also need to
reinforce the optimisation and economic feasibility of flexible energy systems, which may be
complex and involve multiple actors. This includes addressing existing barriers or disincentives
(e.g. market conditions that do not favour sale of excess industrial heat).© OECD/IEA 2017 District Energy Systems in China
Options for Optimisation and Diversification
Figure 4 • Interconnections and potential energy synergies within an integrated energy system
Page | 21
Source: IEA (2014), Linking Heat and Electricity Systems: Co-generation and District Heating and Cooling Solutions for a Clean Energy
Future, OECD/IEA, Paris.
Key message • Synergies across electricity and thermal energy systems offer numerous opportunities for
deeper integration but require appropriate planning and policy frameworks.
Box 1 • A district heating assessment tool for local planners
The Danish Energy Agency (DEA) recently launched a district heating assessment tool (DHAT) that
local planners can use to estimate the economic feasibility of district heating solutions, employing
technical data and applying adjustable price projections (DEA, 2017). The DHAT will be applied in
the “Sino-Danish Pilot Project on district heating and energy efficiency improvements in China”,
which has been signed by the DEA, the National Energy Conservation Center (NECC), the
Development and Reform Commission of Shaanxi province and the government of Tongchuan in
Shaanxi province, near Xi’an. The pilot project seeks to demonstrate potentials to increase energy
efficiency in district heat and assess potential reductions in pollution from these measures. One
critical focus of the pilot project will be to address the use of excess heat from industrial production
and the challenges related to implementing IEH.
District energy systems are expected to expand
China’s rapid urban development and continued prioritisation of district heating, particularly over
individual use of coal boilers in urban areas, mean that district energy networks will grow larger
in the coming decade. While there is no official target for floor area covered by district heating,
estimates by Tsinghua University BERC suggest that it could reach as much as 20 billion m2 by
2030. District cooling networks, while less common at a city scale, may also grow considerably in
denser building developments such as business parks and university campuses.
Analysis of NUH provincial district heating data for city networks suggests that China is on track
to reach these BERC estimates by 2030. By 2020, urban populations within the NUH region could
increase by 35 million or more (relative to urbanisation targets). If network density (in terms of
m2 per urban dweller) were to remain the same, then district heat networks in the NUH region
are likely to increase to nearly 7.3 billion m2 (or roughly a 10% increase) by 2020 (Table 2). If
network density were to increase simultaneously, peaking for instance around 30 m2 per urbanDistrict Energy Systems in China © OECD/IEA 2017
Options for Optimisation and Diversification
inhabitant as in Beijing and Tianjin provinces, then the district heat network could increase to
almost 13 billion m2 by 2020, or nearly twice the floor area coverage in 2015.
Those potential growth scenarios, while not definite forecasts, are consistent with historical
trends, in which the NUH city heat network grew on average by 10% per year since 2005. County
networks (which include growth in suburban areas outside the large prefecture-level cities) have
Page | 22 grown on average by 20% per year since 2005, although this rate has slowed to roughly 11% per
year since 2013, similar to city-level network growth rates. When all networks are taken into
account, it appears likely that the NUH district heating networks (including city, county, town and
village) could collectively increase by as much as 13.5 billion m2 by 2020, nearly 60% greater than
in 2015.
Table 2 • Existing and potential future district heat floor area coverage in key NUH regions
2015 2020
District heat
District heat
Urban Urbanisation District heat Target network with
network with
inhabitants rate network urbanisation target
peak density
(millions) (%) (million m2) (%) population
(million m2)
(million m2)
Heilongjiang 22.4 59% 625 63% 667 847
Liaoning 29.5 67% 1,045 72% 1 123 1 123
Jilin 15.2 55% 480 60% 524 588
Beijing 18.8 86% 585 86% 585 664
Tianjin 12.8 83% 377 84% 382 458
Hebei 38.1 51% 588 60% 692 1 587
Henan 44.4 47% 224 56% 267 1 873
Shanxi 20.2 55% 541 60% 590 779
Shandong 56.1 57% 902 62% 981 2 162
Shaanxi 20.5 54% 240 62% 276 831
Inner 15.1 60% 449 65% 486 581
Mongolia
Gansu 11.2 43% 161 50% 187 462
Ningxia 3.7 55% 100 60% 109 143
Qinghai 3.0 50% 5 60% 6 126
Xinjiang 11.2 47% 307 58% 379 487
NUH 322.2 57% 6,629 64% 7 254 12 710
Source: National Bureau of Statistics, 2017.
Key message • While there are no official targets for district heating coverage, the NUH district heating
network is still likely to continue growing, consistent with historical trends.
Heat demand will continue to increase
The average space heating intensity (in terms of final energy consumption per m2) of buildings
connected to the district heat network in northern China was around 130 kilowatt-hours (kWh) per
m2 in 2013. That energy intensity can vary considerably, depending on building age, design and
occupant behaviour. For instance, the average performance of city network buildings (typically
dense, high-rise, multi-family units) is about 15% better than county network buildings (often less
dense, low-to mid-rise buildings with greater thermal exposure per m2).You can also read