Does the City of Mississauga need More Car Pool Lots? - YorkSpace
←
→
Page content transcription
If your browser does not render page correctly, please read the page content below
Does the City of Mississauga need More Car Pool
                             Lots?
         A Geographic Information Systems Analysis using QGIS
                               Software

                                   By Aamna Buttar & Bisma Butt

Professor: Justin Podur

Geographical Information Systems - ENVS 4520

April 30th 2015

This work is licensed under a Creative Commons Attribution 3.0 Unported License

                                                                                  1
Introduction

       Traffic congestion is a common issue in many cities across the nation. It is no doubt that

the rapidly increasing population and the reliance on automobiles have played a pivotal role in

this problem. As Ontario’s third largest city, traffic congestion in Mississauga has become a

prominent issue. From 2006 to 2011, the city experienced a 6.7% population increase, hence the

2011 population of 713,443 increased by 44,884 residents from 668,559 in 2006 (City of

Mississauga). Traffic congestion in the city of Mississauga, as well as other cities have various

negative implications for the population, which include environmental, social, and health

concerns and thus this report will discuss how this problem can be relieved. Because there are

various negative implications as a result of this congestion, the city has taken the appropriate

steps in order to tackle this issue. This report will mainly be looking at the addition of carpool

lots in order to decrease some of the large amount of traffic within the city.

Hypothesis

       Implementing additional carpool lots within the city of Mississauga will help relieve

traffic congestion, negative environmental effects and further enhance the LRT service. The

project will analyze existing growth and traffic trends plus the availability of vacant land.

Additionally, we will analyze solutions already put into effect for non-congested road conditions

such as, public transportation, bike lanes and the Autoshare Pilot Program.

Environmental Effects

       The pollutants emitted from vehicles are rather dangerous for the residents of nearby

areas. Some of the main toxins that are responsible for contributing to poor air quality as a result

of increased vehicle use are; nitrogen oxide, sulfur dioxide, carbon dioxide, and carbon

monoxide (Sanders, 2012). When higher levels of nitrogen oxide are produced from a number of

                                                                                                     2
vehicles, it can prove to be toxic to humans (Sanders, 2012). Nitrogen oxides are produced as a

result of the high pressure and temperature conditions in an car engine (EPA, n.d.). This toxin is

amongst those which are precursor to the formation of ozone, and also contribute to higher

occurrence rate of acid rain (EPA, n.d.). Moreover, sulfur dioxide is another primary cause of

acid rain. The third emitted toxin of concern has only in recent years begun to be viewed as a

pollution concern. As a matter of fact, the U.S. Environmental Protection Agency has raised

awareness on the idea that this product of combustion may be harmful. Carbon dioxide is

amongst the greenhouse gases that “traps the earth’s heat and contributes to the potential for

global warming” (EPA, n.d.). Carbon dioxide contributes to climate change by insulating more

heat from the sun (Sanders, 2012). Nonetheless, with the increased occurrence of global warming

comes its own set of environmental problems. The final contaminant related to vehicle use is

carbon monoxide, which is a product of incomplete combustion and “occurs when carbon in the

fuel is partially oxidized rather than fully oxidized to carbon dioxide” (EPA, n.d.). This can pose

threat to human life because it reduces the flow of oxygen in the bloodstream. Although, it does

not play a primary role in air pollution, carbon monoxide is still partially responsible for poor air

quality seeing as “approximately 85 per cent of the CO emitted in Ontario in 2006 came from the

transportation sector” (Ontario, 2010).

                                                                                                     3
Social Diseconomies

        An increase in the amount of congestion within cities can also have a negative social

effect on the individuals that have to travel in such conditions. Firstly, traffic results in a lot of

wasted time which can otherwise be used for other activities. In today’s day and age, time is very

closely correlated with money and as such there is an economic cost of the time that is wasted on

busy streets (Robinson, 1984). Although this type of diseconomy is difficult to measure, it can

have significant impacts (Robinson, 1984). Another negative impact caused by traffic is the high

noise levels (Robinson, 1984). In cities such as Mississauga, where most of area is enclosed by

high rise buildings, these noise levels may be further intensified (Robinson, 1984). The final

social diseconomy that results due to traffic congestion is vibration. This vibration made by

heavy vehicles is very problematic especially for cities because it creates foundation problems

(Robinson, 1984). Moreover, in such heavily populated areas, road maintenance costs increase

and may not be done as frequently, which may cause further problems such as accidents

(Robinson, 1984). Thus, it is clear that traffic congestion brings with it, many social

diseconomies.

Health Effects

        Although there are no direct health effects of traffic congestion, the significant amount of

air pollution caused by this phenomenon plays major role in deteriorating the health of

individuals (Levy et al., 2010). Traffic-related air pollutants are associated with many adverse

health effects, including mortality, non-allergic respiratory morbidity, allergic illness and

symptoms, cardiovascular morbidity, cancer, preterm birth, and decreased male fertility (Zhang,

2010). Many studies suggest that traffic-related air pollutants increase the risk of respiratory

symptoms (Levy et al., 2010 & Zhang, 2010). As a matter of fact, poor ozone, which results

                                                                                                         4
from an increase in air pollution can “impair lung function, especially in children and adults with

asthma, with a higher number of sufferers resulting in high-traffic urban areas” (Sanders, 2012).

Air pollution impairs the lung functions because it adds additional stress to an individual’s heart

and lungs, in order to work harder to supply the body with oxygen ("Health Effects", 2015).

Furthermore, long term exposure to polluted air can have permanent health effects which include

“accelerated aging of the lungs, loss of lung capacity, decreased lung function, development of

diseases such as asthma, bronchitis, emphysema, and possibly cancer, and shortened life span”

("Health Effects", 2015). It is also important to note that air pollution is something that certain

people are more susceptible to. It may pose as a higher risk problem to individuals with “heart

disease – such as coronary artery disease or congestive heart failure, individuals with lung

disease – such as asthma, emphysema or chronic obstructive pulmonary disease, pregnant

women, outdoor workers, children under age 14, whose lungs are still developing, and athletes

who exercise vigorously outdoors” ("Health Effects", 2015).

Why Traffic Congestion Occurs

       In order to come up with viable solutions to the problem of traffic congestion, it is

important to first understand the root of the cause. Traffic has become an ordinary phenomenon

in various cities within Canada. It occurs when there is a large amount of population growth

within a region that otherwise was not as prepared for the increase as they could have been.

Individuals are generally attracted to regions where there are employment opportunities, and

Mississauga is a diverse city that caters to each and every persons desires. Due to the dense

population of the city, there are employment opportunities available in any possible job sector.

According to the City of Mississauga’s website, due to the “magnitude of the industrial and

commercial base located in Mississauga, this city has become one of the most significant

                                                                                                      5
employment growth centers within the GTA; more than 52,000 businesses employ over 425, 000

of which 54.5% commute from Toronto, Brampton, Oakville, and beyond” (City of Mississauga,

n.d.). Hence, it is no surprise that people from other cities are travelling to Mississauga each and

every day for employment purposes.

       Another reason as to why traffic congestion occurs is due to the lack of planning. Cities

with larger amounts of local populations should be able to use other modes of transportation to

travel to closer locations. With the addition of sidewalks, pathways, and bike lanes, individuals

will not be inclined to resort to their personal vehicle when travelling shorter distances.

Moreover, with the addition of carpool lots around the city, individuals will find it to be much

more efficient and convenient to carpool. Thus, by providing residents with a variety of ways in

which travelling can be made possible with ease; it will allow the traffic congestion in the city of

Mississauga to settle down.

Solutions

       Because most of the individuals travelling to and from the city are probably commuting

via a personal vehicle, implementing more carpool lots within the city will help alleviate the

traffic problem, as well as provide many other benefits. To begin with, the obvious benefit of

carpooling is that it will save individuals money. It allows individuals to “share the cost of gas

and parking, cutting expenses by nearly 50% or more, depending on the amount of occupants in

the car” (Spence, n.d.). According to the Canadian Automobile Association, the average yearly

cost of operating a car can add up to $9,000 a year, roughly $25 a day. As such, sharing vehicles

and splitting costs can benefit individuals economically (Trans Canada Carpool, 2010).Not only

is carpooling economically beneficial individually, but also socially, as it will help reduce the

                                                                                                       6
costs we as residents pay towards the “construction of new roads, road maintenance and air

pollution related health costs” (Spence, n.d.).

       On the note of air pollution, carpooling is extremely beneficial for the environment.

Sharing vehicles will regulate and reduce greenhouse gases which will ultimately result in better

air quality within the city (Spence, n.d.). Not only does it minimize the amount of air pollution,

but it also conserves habitats around the city because of the decrease in demand for new roads

and parking lots (Trans Canada Carpool, 2010). Moreover, carpooling can have positive effects

on one’s health and wellbeing. According to Environment Canada, “air pollution caused by

vehicular travel is linked to a number of health concerns including respiratory diseases,

cardiovascular disease, allergies and neurological effects”, these risks can be avoided by

carpooling (Spence, n.d.). Studies also show that carpooling is less stressful than commuting

alone and thus benefits one’s mental state (Spence, n.d.). Research shows that individuals who

commute by means other than a “single-occupancy vehicle demonstrate lower levels of stress,

higher morale, and lower blood pressure” (Trans Canada Carpool, 2010). It is clear that there are

many benefits associated with carpooling and consequently it is the most viable option for

reducing traffic congestion within the city of Mississauga. The program which is currently in tact

within the city is called, “The Autoshare Pilot Program”. This program is applicable to various

divisions of Mississauga, depending on the resident’s location. It provides access to cars which

are owned by the program and are for the use of residents. The carpool lots for Autoshare allow

residents to park and then borrow the Autoshare vehicle with a group of people to car pool

together.

                                                                                                     7
Data Acquisition and Map Analysis
In order to analyze where carpool lots within the City of Mississauga will best assist in
alleviating traffic congestion, certain data had to be obtained. The first type of map that needed
to be obtained was a base map of the city of Mississauga. This map would then be used to assess
where traffic was higher within the city, as well as where existing carpool lots are located.
Information that needed to be acquired included existing carpool lots, traffic counts, bus routes,
existing pathways and bike lanes, Autoshare locations, and the land use makeup of the city. To
access this particular information about the City of Mississauga, open source data was obtained
from the City of Toronto website. All of the maps collected and made for this study were
reflected in the common projection reference system, World Geodetic System 84 (WGS84)/
UTM zone 17N, EPSG: 32617.
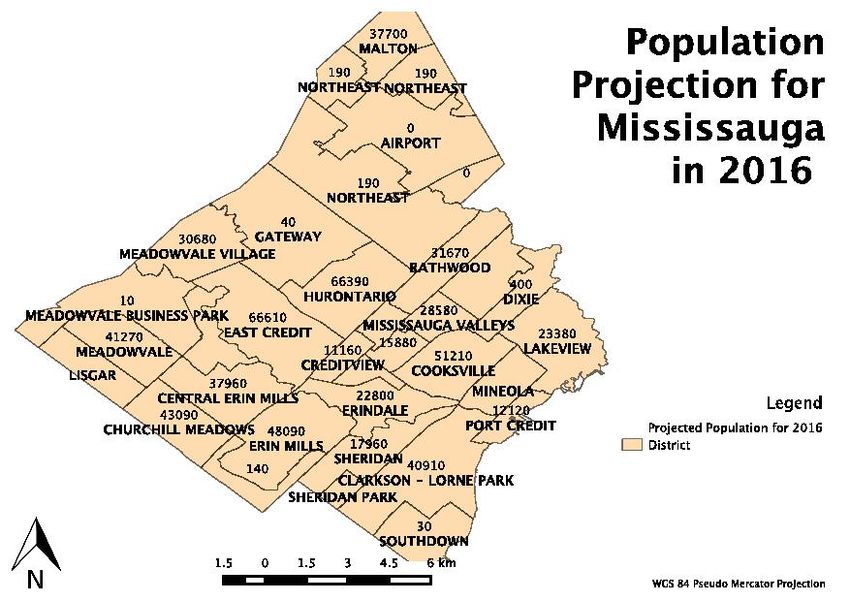
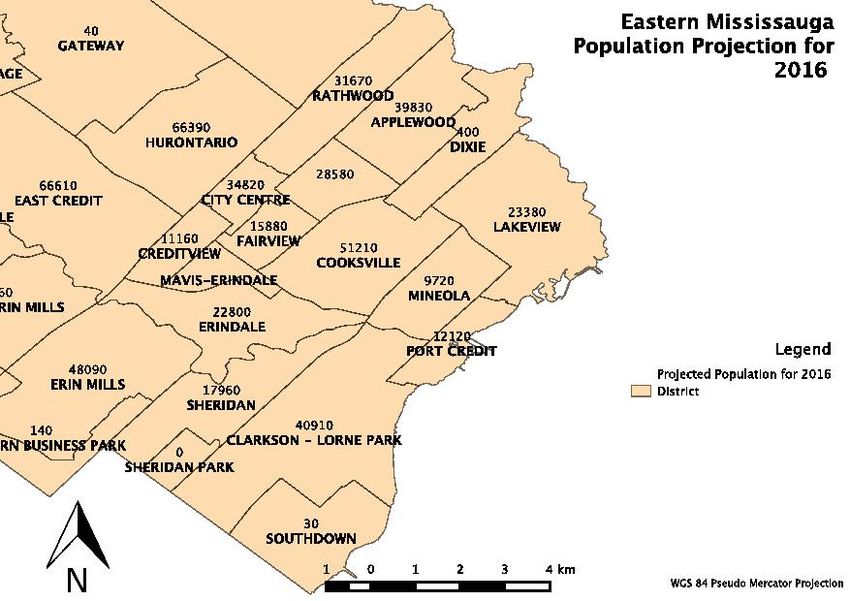
Map 1 through 4; depict the first base map that was used within this study. These maps
illustrate the population projection for Mississauga in 2016. This map layer provides the
information required to see where traffic is, and will continue to be higher than other wards.
Using this information allows us to better select sites for the building of new carpool lots. This
map divides the city of Mississauga by the appropriate wards that the city has implemented. As
evident in the map, the heart of Mississauga appears to have the largest population and hence the
most traffic. Combining this information with other data layers has allowed us to find the most
suitable locations for additional carpool lots. The chosen locations are placed in areas such that
they will not contribute to any further traffic congestion, rather alleviate it.
8
Map 1:

Map 2:

         9
Map 3:

Map 4:

         10
Chart 2.
Forecast
for
Future
Popula:on
Increase
(%)
From
2026-‐2031
2.23
Time
Period
From
2021-‐2026
2.34
From
2016-‐2021
2.24
2.16
2.18
2.2
2.22
2.24
2.26
2.28
2.3
2.32
2.34
2.36
Percentage
Change
(%)
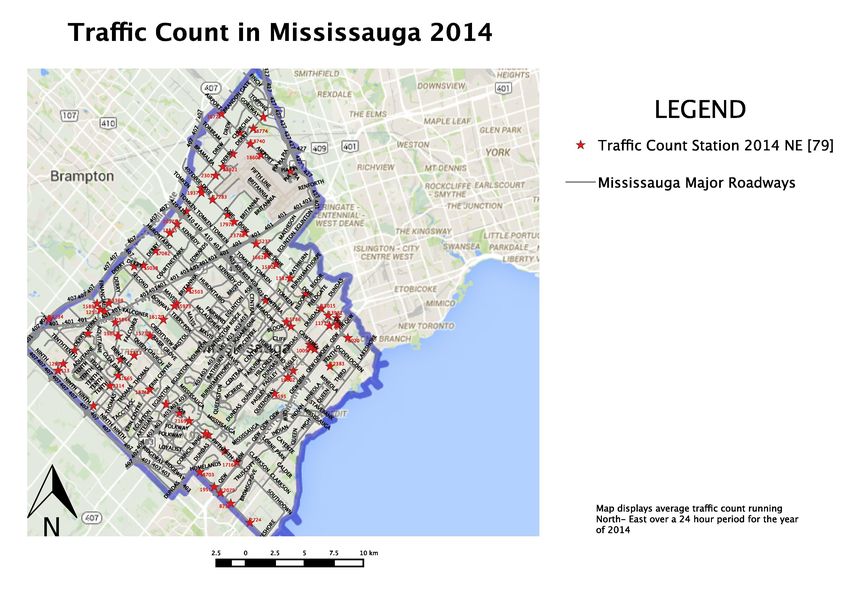
The second base map that was used was a street map obtained from Google images,
which shows the streets and major highways in the city. This map allowed us to illustrate layers
with various different features on them in order to show the information we collected. Map 5
depicts a map of the existing major bus routes that operate in the city. Seeing where the major
bus routes run throughout the city gives us a better understanding of where there is a lot of
human and car traffic. As from the population projection map, the bus routes also illustrate that
the heart of the city has the most traffic that needs to be dispersed. Knowing where the major bus
routes are has provided us with additional information on where to locate our carpool lots. This
is because people may want to meet up near a major bus route in order to carpool with other
people, as it makes it easier to reach the location rather than a secluded carpool lot. Furthermore,
we have placed additional carpool lots near major bus routes because there is a higher flow of
traffic near such areas.
11
Map 5:

Using the previous base map of Missisuaga, we were able to construct additional maps with

varying features. Map 6 illustrates the existing carpool lots in the city, as well as where there is

vacant land for new lots. These lands include un-built areas that can be used to build new carpool

lots. However, there are also locations in Mississauga, such as malls and bus terminals that can

also be used for carpool lots, given the right permits are used. Using these vacant lands will

allow for the building of a bigger carpool lot and hence we will choose a carpool lot in one of

these locations as well. In this map, we have also chosen to illustrate already existing carpool

lots. This allows us to better spread out the lots in order for an optimal decrease in traffic

congestion. As shown, the city of Mississauga only has 3 carpool lots and given the amount of

traffic within the city, there is immense need for a few more. Next, this map also shows

AutoShare locations in Mississauga along with Environmentally Friendly Commuter

Alternatives in Mississauga in map 6. Autoshare is a city-established car sharing pilot program.

                                                                                                       12
We will further examine whether or not this pilot program appears to be successful and as such

will implement more locations for car sharing. The alternative methods include bicycle lanes.

Understanding where there are existing bike lanes allows us to see where there is a lot of

pedestrian traffic and as such implementing future carpool lots in such locations will be

effective. Lastly, this map shows the major roads within the city of Mississauga, which is an

important component to include in any analysis being done for a city. Roads provide us with a

sense of areas where there is existing traffic.

Map 6:

                                                                                                 13
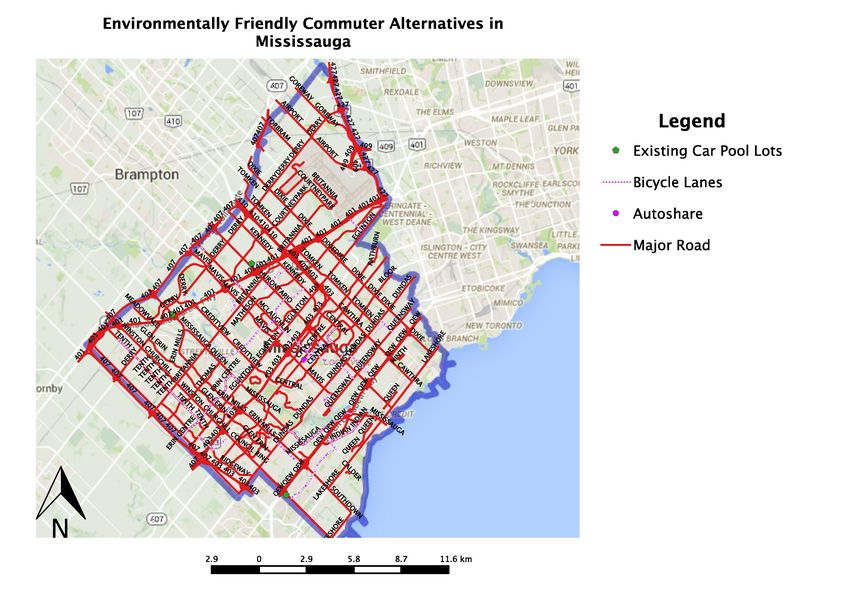
The final map that was created illustrates the locations in the city where traffic is counted. These

traffic count stations allow city officials and planners to appropriately provide for the existing

population by implementing what needs to be added. In this case, these traffic count stations

allow us to obtain specific attribute data that allows us to identify locations of higher traffic

density. Map 8 shows the locations where these traffic count devices are installed.

Map 8:

                                                                                                     14
Chart Analysis

Statistical and aspatial data was also obtained in regards to the population density in

Mississauga. Chart 1 shows the traffic change from 2012 to 2014 in the various major regions of

the city. The ‘difference’ column shows whether or not the change was positive or negative in

the area. Chart 2 illustrates the figures in chart 1 in a bar graph format, comparing the traffic

count from the years 2012 and 2014. The final diagram (chart 3), which is a pie chart, illustrates

the population growth from 2012 to 2014 in Mississauga also depicted in Table 1. Unlike the

previous data, this is not showing traffic increase, but rather population increase. Because

population density is closely correlated with an increase in traffic, it is important to assess both.

This information allows us to computationally select areas that have more traffic and further

allows for analysis on where the carpool lots will be most efficient.

Chart 1: Summary of Traffic Count:

       Road                   2014        2012 Difference

       Erin Mills Pkwy      316075     323553                  -7478

       Mississauga Road     119468       86741                32727

       Britannia Road       237636     237937                   -301

       Dixie Road           440884     408356                 32528

       Derry Road           579164     396462                182702

       Airport Road         174184     165497                   8687

       Cawthra Road         187778     174623                 13155

       Winston Churchill
       Boulevard            142704     143405                   -701

       Queensway            154445     138256                 16189

                                                                                                    15
Chart 2:
Traffic
Count
-‐
Mississauga
Major
Roads
600000
500000
400000
300000
200000
2014
100000
0
2012
Table 1:
MID_203
DISTRICT MID_2016 MID_2021 MID_2026 1
APPLEWOOD 39830 40260 41030 41950
CENTRAL ERIN MILLS 37960 40150 42090 43770
CHURCHILL MEADOWS 43090 43690 44120 44500
CITY CENTRE 34820 41140 44580 46410
CLARKSON - LORNE
PARK 40910 41300 41770 42300
COOKSVILLE 51210 53820 58880 64670
CREDITVIEW 11160 11270 11340 11400
EAST CREDIT 66610 67770 68920 70060
ERIN MILLS 48090 48890 50040 51380
ERINDALE 22800 22700 22760 22900
FAIRVIEW 15880 15890 16450 16980
HURONTARIO 66390 67480 68130 68550
16
LAKEVIEW                      23380           24120        24860       25540

       LISGAR                        32210           31900        31720       31640

       MALTON                        37700           37270        37020       36910

       MEADOWVALE                    41270           41200        41360       41670

       MEADOWVALE VILLAGE            30680           31450        32070       32670

       MINEOLA                        9720            9800         9970       10170

       MISSISSAUGA VALLEYS           28580           28550        28620       28750

       PORT CREDIT                   12120           12590        13140       13690

       RATHWOOD                      31670           31750        32040       32450

       SHERIDAN                      17960           17990        18200       18460

       STREETSVILLE                  12570           13020        13490       13930

       Population Totals            757800          775170       793770       811890

                             From 2016-      From 2021-
       Percentage Change     2021            2026            From 2026-2031

                                                             2.23182943
                               2.240798793     2.343248044            5

                                                                                  17
Chart 3:
Popula:on
Increase
in
Mississauga
780
Neighbourhoods
Rise
From
2016-‐2021
450
1570
500
1360
1990
APPLEWOOD
CENTRAL
ERIN
MILLS
400
5810
2120
2160
1410
CHURCHILL
MEADOWS
CITY
CENTRE
2160
CLARKSON
-‐
LORNE
PARK
COOKSVILLE
1100
CREDITVIEW
EAST
CREDIT
3290
ERIN
MILLS
FAIRVIEW
11590
3450
HURONTARIO
LAKEVIEW
MEADOWVALE
MINEOLA
240
PORT
CREDIT
RATHWOOD
13460
1390
SHERIDAN
STREETSVILLE
GIS Techniques for Site Selection
With the collection of data and map, in order to further assess where to place carpool lots within
Mississauga, QGIS was used in order to implement various tools and techniques. A complete
Cost Analysis was implemented for the project. The first step that was taken to find a suitable
location based on the population density was to obtain a dataset of the population from the City
of Mississauga open data website. The dataset was a shape file that had polygons depicting what
areas were high in residential density. Because polygons were separate based on buildings or
townhouse complexes and we were looking for area clusters, a spatial join was conducting,
dissolving those polygons within the same region, as one. Next, centroids were made for each of
18
the dissolved residential regions. The creation of centroids pinpoints the center most part of that
specific residential area. Using the previously constructed map of vacant land available in
Mississauga, we assessed the lot that would be most effective in catering to a large population
but would also have enough room for a spacious carpool lot. After selecting the site most
suitable for this purpose, the road graph plugin on QGIS was used in order to obtain the shortest
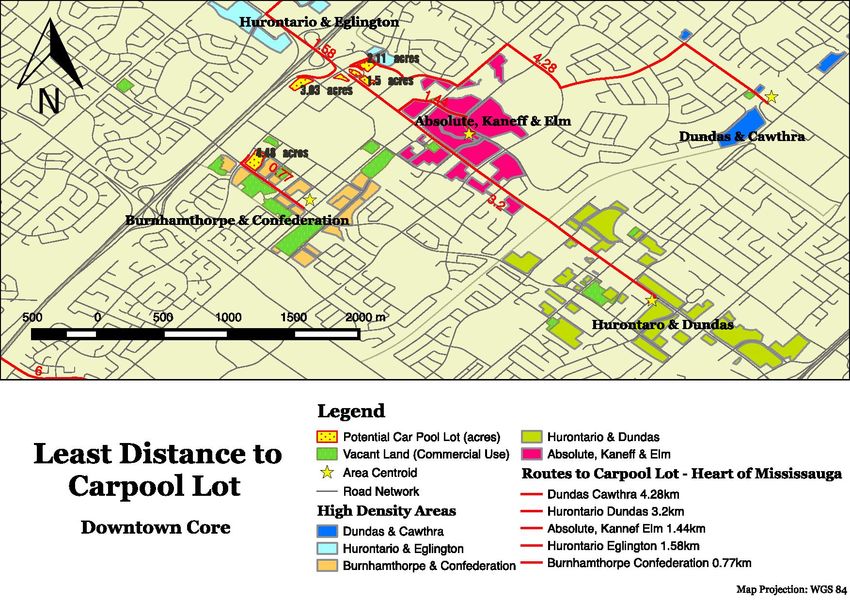
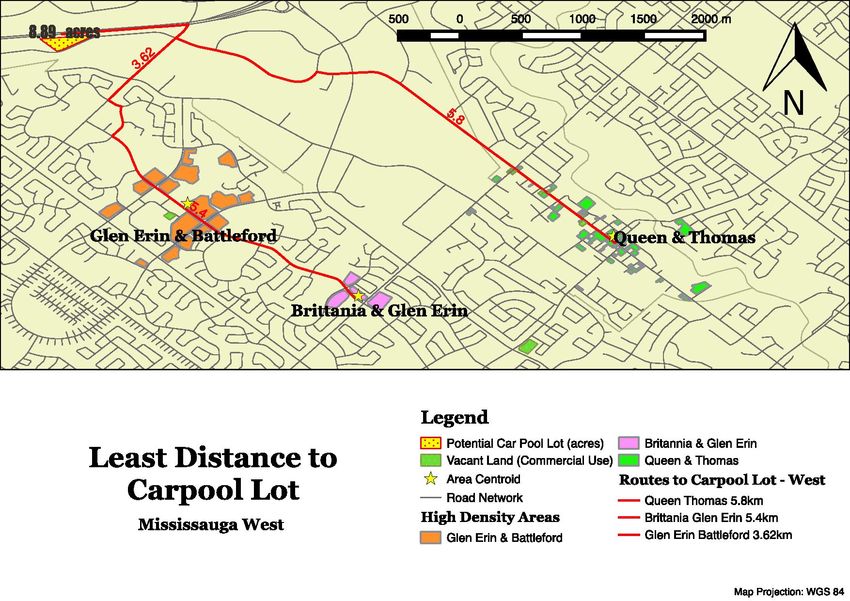
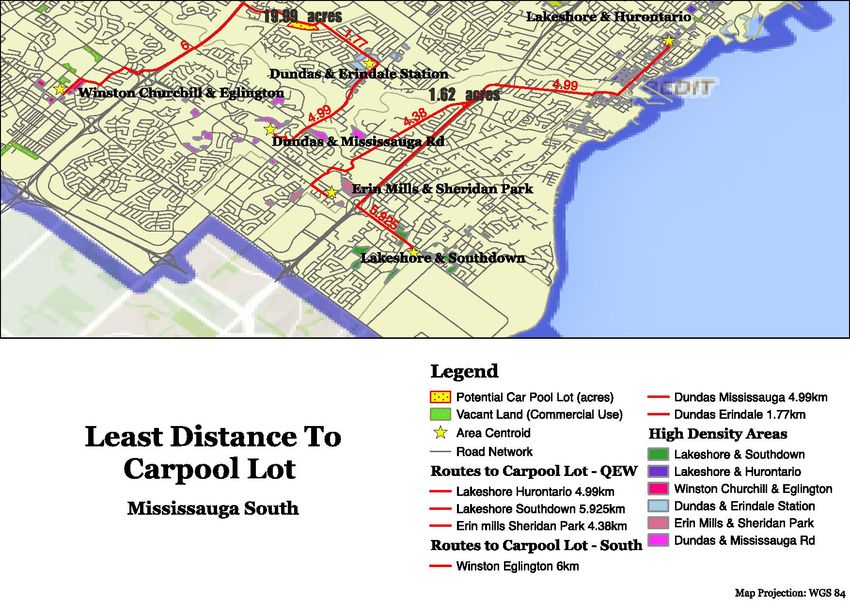
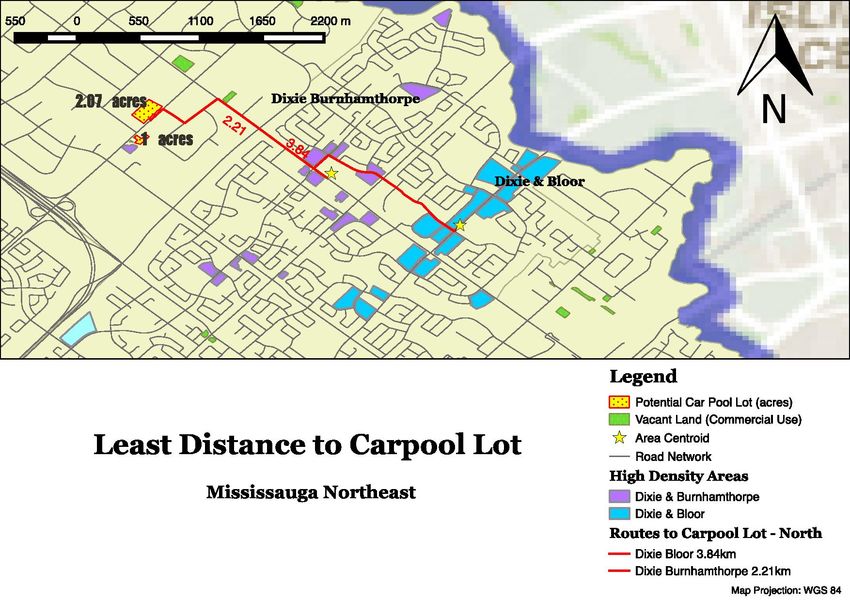
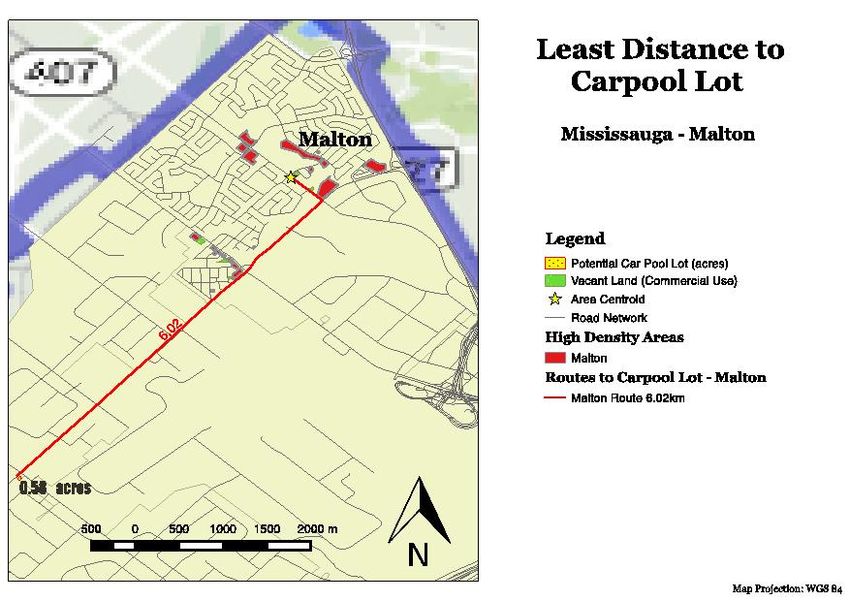
route from each neighborhood to that specific carpool lot. The maps shown below (Maps 9-14)
show high density neighbourhoods and their assigned carpool lots. In implementing carpool lots
in the city along with a program such as Autoshare, it is important that specific lots are assigned
or designated to residents of certain areas, as shown in the maps below. All of the densely
populated areas have a carpool lot located within 6 km distance of the area centroid making the
program relieve congestion on major traffic routes and alleviate pollution from high traffic areas.
To finish the analysis, cost is applied. Assuming that each person will drive themselves to the
carpool lot location many factors were input into the analysis. The first factor being vehicle fuel
efficiency. Each person drives various vehicle types, whether an SUV, smart car, hybrid or a V6
V4 or V8 engine on an automatic or manual transmission. Depending on their car specs, gas
consumptions varies and for this an average was required. A readily available summary of these
specs was available on the website of the U.S. Department of Energy known as the “Fuel
Economy Data File”. This was appropriate to use as Canadian and U.S. residents have common
vehicle makes. This dataset communicated an average the average miles per gallon for a vehicle
to be 26.73 miles per gallon which converted to 11.4 kilometers per liter. (U.S. Department of
Energy, 2016) Chart 4 below demonstrates the findings from the cost analysis.
19
Chart 4:

                                                            One Side      Round Trip    One Week
Region              Route                      Kilometers   Cost ($)      Cost ($)      Cost ($)
Mississauga South   Lakeshore Hurontario             4.99   0.481491228   0.962982456    2.40745614
                    Lakeshore Southdown             5.925   0.571710526   1.143421053   2.858552632
                    Erin Mills Sheridan Park         4.38   0.422631579   0.845263158   2.113157895
                    Winston Eglington                   6   0.578947368   1.157894737   2.894736842
                    Dundas-Misssissauga              4.99   0.481491228   0.962982456    2.40745614
                    Dundas-Erindale                  1.77   0.170789474   0.341578947   0.853947368
Mississauga
Northeast           Dixie-Bloor                      3.84   0.370526316   0.741052632   1.852631579
                    Dixie-Burnhamthorpe              2.21   0.213245614   0.426491228    1.06622807
Mississauga West    Queen-Thomas                      5.8   0.559649123   1.119298246   2.798245614
                    Brittania-Glen Erin               5.4   0.521052632   1.042105263   2.605263158
                    Glen Erin-Battleford             3.62   0.349298246   0.698596491   1.746491228
Malton              Malton                           6.02   0.580877193   1.161754386   2.904385965
Downtown core       Dundas-Cawthra                   4.28   0.412982456   0.825964912   2.064912281
                    Hurontario-Dundas                 3.2    0.30877193    0.61754386   1.543859649
                    Absolute, Elm, Kannef            1.44   0.138947368   0.277894737   0.694736842
                    Hurontario-Eglington             1.58    0.15245614   0.304912281   0.762280702
                    Burnhamthorpe-
                    Confederation                    0.77 0.074298246 0.148596491 0.371491228

                                                                                           20
Map 9:

Map 10:

          21
Map 11:

Map 12:

          22
Map 13:

          23
24
You can also read