DRAFT - A Traffic Safety Study for the City of Goleta Systemic Safety Analysis Report
←
→
Page content transcription
If your browser does not render page correctly, please read the page content below
A Traffic Safety Study
                       for the City of Goleta
                                             Including:
   Systemic Safety Analysis Report
                   Local Road Safety Plan

                                     T
                                  AF
                      R
          D

                                                April 2021
                                                Prepared By:

__________________________________________________________________________________________________
City of Goleta                                                                                       1
TSS, SSAR & LRSP
APRIL 2021 | DRAFT FINAL REPORT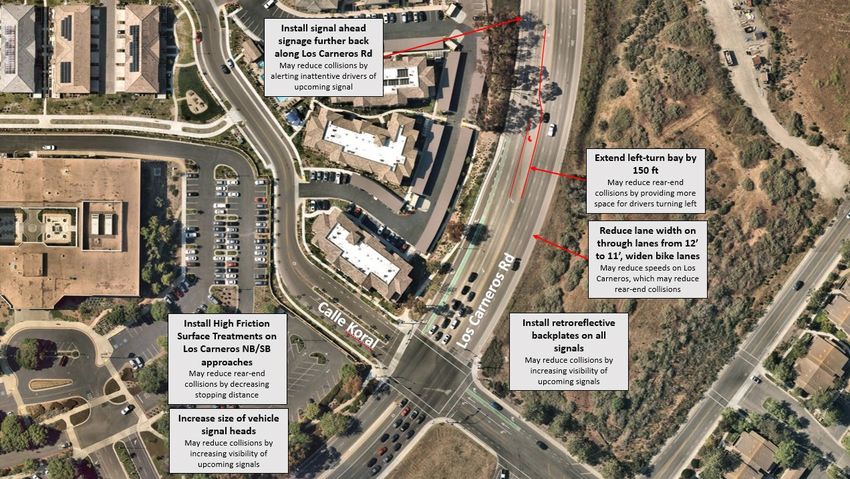
EXECUTIVE SUMMARY
This Systemic Safety Analysis Report (SSAR) proactively evaluates the City of Goleta’s transportation
network, using criteria to analyze the saf ety of all road users (drivers, bicyclists, and pedestrians), the
interaction of modes and saf ety countermeasures, inf luences on the roadway network f rom adjacent
municipalities, and proactively consider mitigation measures. In order to recommend systemic
improvements, the SSAR analyzes crash data on an aggregate basis to identify high-risk roadway
characteristics, rather than looking exclusively at high-collision concentration locations through site
analysis. This SSAR will help develop and prioritize any necessary traffic safety countermeasures along
major corridors and intersections.
The City of Goleta has already taken considerable steps in improving traffic safety over the years, but still
has room for improvement. According to 2017 data from the California Office of Traffic Safety, The City of
Goleta is above average compared to peer counties/municipalities in the amount of collisions that result in
f atalities or injuries (ranked 14 out of 97 peer municipalities, 97 being the highest). These data suggest that
vehicular collisions and collisions with bicyclists and pedestrians occur more f requently here than in other
municipalities similar to Goleta. The City of Goleta has implemented many improvements including
complete streets initiatives, intersection improvements, and improvements to the bicycle and pedestrian
networks.

                                    T
Goleta’s collision history was analyzed to identify locations with elevated risk of collisions either through
their collision histories, or their similarities to other locations that do have more active collision patterns.
                                 AF
Using a network screening process, locations within the City that will most likely benefit f rom safety
enhancements were identified. Using historic collision data, collision risk factors for the entire network are
derived. The outcomes informed the identification and prioritization of engineering and non-infrastructure
saf ety measures that address certain roadway characteristics and related behaviors that contribute to motor
vehicle collisions with active transportation users.
The Systemic Saf ety Analysis Report identif ied countermeasures f or both inf rastructure and non-
inf rastructure improvements. The report then applies Crash Modification Factor’s (CMFs), which are used
                     R
to estimate the saf ety ef fects of highway improvements to compare and prioritize the highway safety
improvements. The application of an appropriate CMF can influence the decision to implement a particular
project, and the misapplication of CMFs can lead to misinformed decisions.
         D

The f ollowing locations were evaluated one step further to develop specific case studies based on the
recommended improvements and will provide guidance f or f uture saf ety studies, project development
programs, and grant applications.
        •    Segment: Cathedral Oaks Road from Glenn Annie Road to Los Carneros Road
        •    Segment: Patterson Avenue from Hollister Avenue to Debbie Lane
        •    Segment: Ellwood Beach Drive from Strehle Lane to Entrance Road
        •    Segment: Calle Real f rom Encina Lane to Kingston Avenue
        •    Segment: Alondra Drive from Nectarine Avenue to Mallard Avenue
        •    Intersection: Hollister Avenue and Storke Road
        •    Intersection: Fairview Avenue and Calle Real
        •    Intersection: Storke Road and Marketplace Drive
        •    Intersection: Cathedral Oaks Road and Glen Annie Road
        •    Intersection: Calle Real and Encina Lane
        •    Intersection: Cathedral Oaks and Fairview Avenue
        •    Intersection: Los Carneros Avenue and Calle Koral

______________________________________________________________________________________________________
2                                                                                                     City of Goleta
                                                                                               TSS & SSAR & LRSP
                                                                                APRIL 2021 | DRAFT FINAL REPORT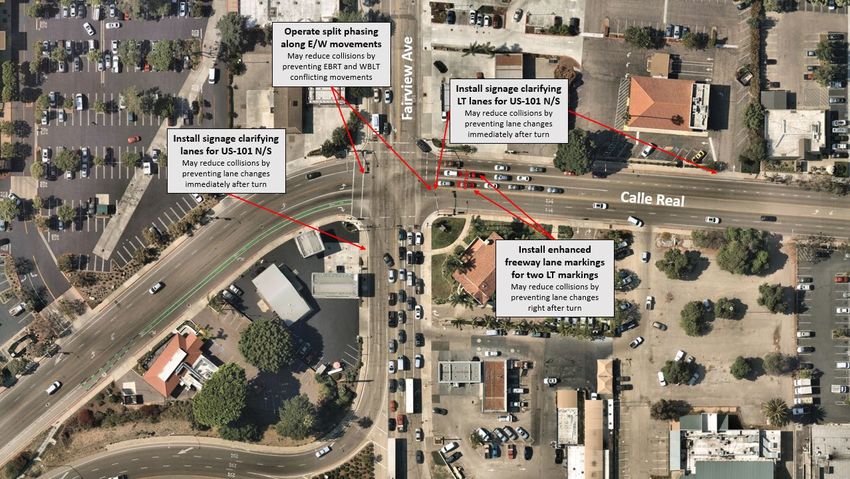
•    Intersection: Cathedral Oaks Rd and Los Carneros Road

This document also includes a Local Road Safety Plan (LRSP). The LRSP builds upon the analysis
completed in the SSAR. To further advance the commitment to safety, the LRSP can be used to guide
decision-making as projects and opportunities arise. The LRSP outlines visions & goals that will guide the
City’s planning efforts and identifies safety partners that the City can work with to implement safety
improvements. The plan also identifies three emphasis areas that the City should focus on: vulnerable
road users, impaired driving, and aggressive driving. Goals and strategies to address these focus areas
are laid out, as well as a framework for evaluation and implementation.
(Per section 148 of Title 23, United States Code [23 U.S.C. §148(h) (4)]: REPORTS DISCOVERY AND
ADMISSION INTO EVIDENCE OF CERTAIN REPORTS, SURVEYS, AND INFORMATION—
Notwithstanding any other provision of law, reports, surveys, schedules, lists, or data compiled or collected
f or any purpose relating to this section, shall not be subject to discovery or admitted into evidence in a
Federal or State court proceeding or considered for other purposes in any action for damages arising from
any occurrence at a location identified or addressed in the reports, surveys, schedules, lists, or other data.)

                                     T
SIGNATURE PLACEHOLDER_____________________________
Signature line
                                  AF
By signing and stamping this Systemic Saf ety Analysis Report, the engineer is attesting to this report's
technical information and engineering data upon which local agency's recommendations, conclusions, and
decisions are made.
                      R
            D

__________________________________________________________________________________________________
City of Goleta                                                                                          3
TSS, SSAR & LRSP
APRIL 2021 | DRAFT FINAL REPORT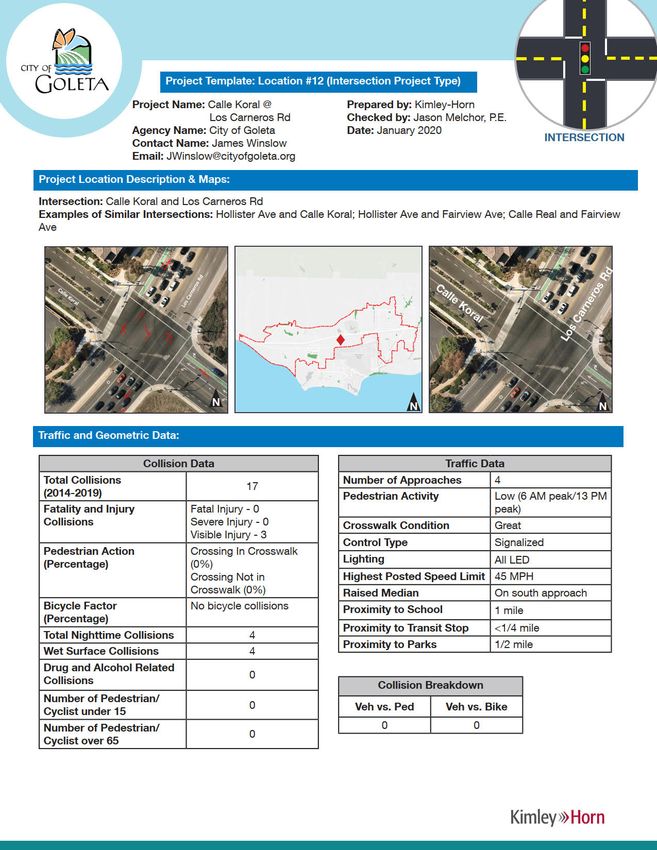
Table of Contents
Executive summary .................................................................................................................... 2
1    Introduction......................................................................................................................... 7
    1.1      Purpose...................................................................................................................... 7
    1.2      Goals & Objectives ......................................................................................................10
2    Existing Conditions .............................................................................................................11
    2.1      Brief Overview of City ..................................................................................................11
    2.2      Plans & Policies ..........................................................................................................12
    2.3      Existing f acilities .........................................................................................................12
     2.3.1      Roadway network ....................................................................................................12
     2.3.2      Bike & Ped network..................................................................................................12
     2.3.3      Transit network........................................................................................................13
3    Data Utilized in Analysis Process ..........................................................................................15

                                             T
    3.1      Roadway Network .......................................................................................................15
    3.2      Collisions ...................................................................................................................17
     3.2.1      Goleta Valley Cottage Hospital Trauma Center ............................................................18
                                          AF
    3.3      Volumes ....................................................................................................................19
4    Public Outreach..................................................................................................................21
    4.1      Public Workshop .........................................................................................................21
    4.2      Emergency Services & Enforcement Meeting Summary ....................................................21
                           R
    4.3      LRSP Stakeholder meeting...........................................................................................21
    4.4      LRSP Public Meeting ...................................................................................................21
5    Data Analysis .....................................................................................................................22
           D

    5.1      Guiding Materials ........................................................................................................22
     5.1.1      Local Roadway Saf ety Manual...................................................................................22
     5.1.2      Highway Safety Manual ............................................................................................22
    5.2      Analysis Techniques....................................................................................................23
     5.2.1      Collision Analysis.....................................................................................................23
     5.2.2      Site Visits ...............................................................................................................24
    5.3      Issues Identification.....................................................................................................25
    5.4      Results ......................................................................................................................26
     5.4.1      Summary of the Data Analysis ...................................................................................26
     5.4.2      Highest Occurring Crash Types .................................................................................27
     5.4.3      High-Risk Intersections and Corridors .........................................................................28
    5.5      Benefit to Cost Ratio Process........................................................................................30
______________________________________________________________________________________________________
4                                                                                                                          City of Goleta
                                                                                                                    TSS & SSAR & LRSP
                                                                                                     APRIL 2021 | DRAFT FINAL REPORT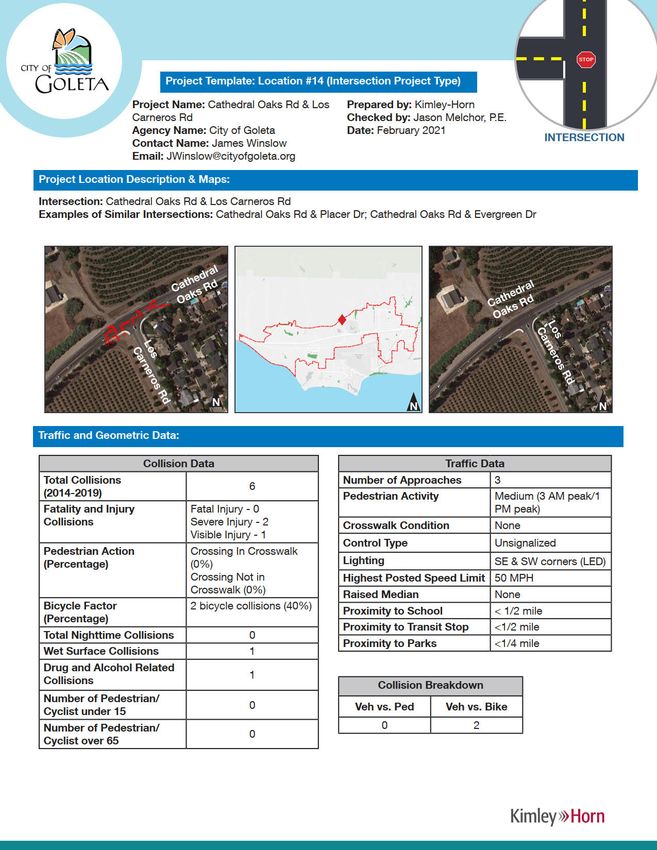
6    Inf rastructure recommendations ............................................................................................31
    6.1      Countermeasure Selection Process ...............................................................................31
     6.1.1      Crash Modification Factors........................................................................................31
    6.2      General City-Wide Safety Project Recommendations........................................................31
    6.3      Saf ety Project Sheet Templates ....................................................................................34
    6.4      Prioritized Projects ......................................................................................................63
7    Non-infrastructure recommendations .....................................................................................71
8    Action Plan ........................................................................................................................74
    8.1      Implementation Strategies ............................................................................................74
     8.1.1      Near- & Mid-Term Focus Areas .................................................................................74
    8.2      Prioritization Process ...................................................................................................76
    8.3      Future Analysis ...........................................................................................................77
    8.4      Funding Recommendations ..........................................................................................77

                                            T
9    Local Road Safety Plan – to be incorporated in 2021 with LRSP Grant .......................................79
    9.1      5 E’s of Traff ic Safety...................................................................................................79
    9.2      Vision & Goals ............................................................................................................80
                                         AF
    9.3      Saf ety Partners ...........................................................................................................80
    9.4      Emphasis Areas..........................................................................................................80
     9.4.1      Vulnerable Road Users.............................................................................................81
     9.4.2      Impaired Driving ......................................................................................................81
                          R
     9.4.3      Aggressive Driving ...................................................................................................82
    9.5      Evaluation & Implementation.........................................................................................82
10        Data Appendices ............................................................................................................83
            D

Appendix a: Count Data.............................................................................................................84
Appendix B: Collision Data .........................................................................................................85

__________________________________________________________________________________________________
City of Goleta                                                                                                                     5
TSS, SSAR & LRSP
APRIL 2021 | DRAFT FINAL REPORT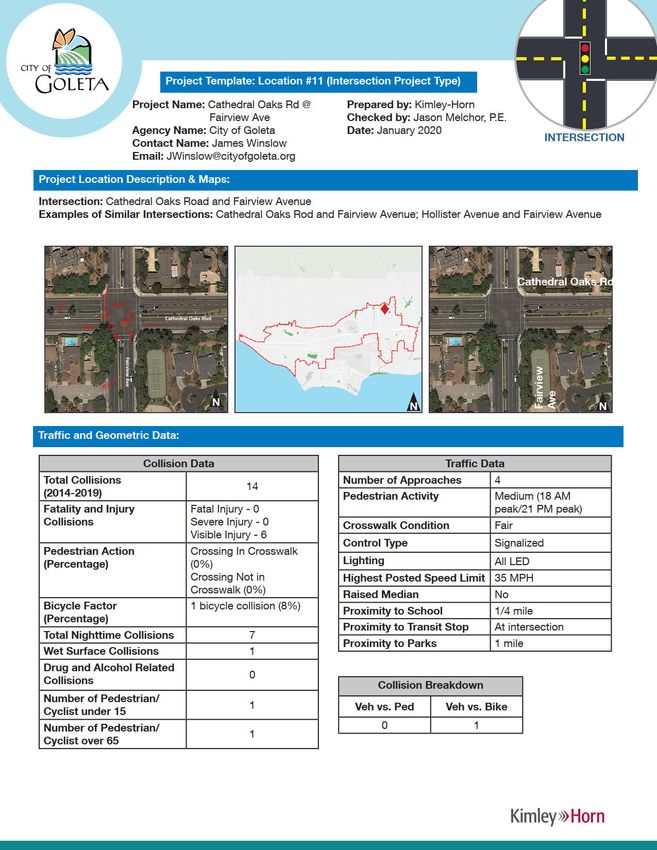
Table of Figures
Figure 1 – Functional Classification Map (City of Goleta General Plan)............................................... 8
Figure 2 – Study Corridors .......................................................................................................... 9
Figure 3 – Future Active Transportation Network Map (BPMP).........................................................13
Figure 4 – MTD Transit Routes in the Goleta Area .........................................................................14
Figure 5 – Function Classification Network....................................................................................16
Figure 6 – Intersection and Mid-block Collisions (2014-2019)...........................................................17
Figure 7 – Critical Crash Rate Formula.........................................................................................24
Figure 8 - Collisions by Cause ....................................................................................................26
Figure 9 - Collisions by Type.......................................................................................................28

Table of Tables
Table 1 – Traffic Count Locations ................................................................................................19
Table 2 – Top Intersection Based on Collisions Only ......................................................................28
Table 3 – Top Segments Based on Collisions Only ........................................................................29
Table 4 - City-Wide Safety Project Recommendations ....................................................................33

                                           T
                                        AF
                          R
           D

______________________________________________________________________________________________________
6                                                                                                                      City of Goleta
                                                                                                                TSS & SSAR & LRSP
                                                                                                 APRIL 2021 | DRAFT FINAL REPORT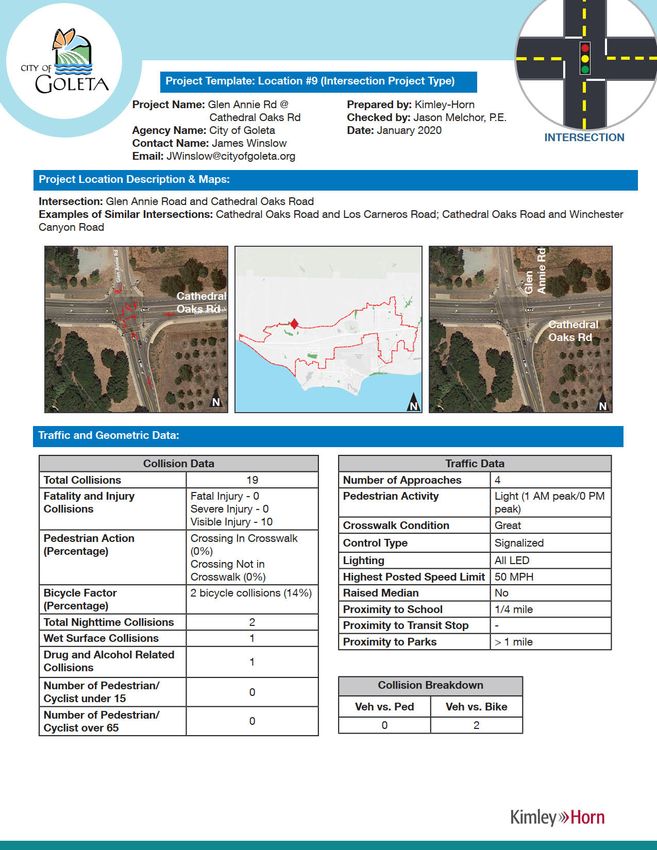
1 INTRODUCTION
1.1 PURPOSE
This Traf f ic Safety Study (TSS) report contains the required elements of a Systemic Safety Analysis Report
(SSAR) and a Local Road Safety Plan (LRSP), per Caltrans guidance. The Systemic Safety Analysis Report
(SSAR) portion of the report proactively evaluates the City of Goleta’s transportation network using criteria
f ocused on identifying f actors that negatively impact safety on all modes, with special attention paid to
pedestrian and bicycle safety. The SSAR analyzes collision data on an aggregate basis to identify high-risk
roadway characteristics to recommend systemic improvements, rather than responding to locations as
crashes occur. This approach acknowledges that crash rates at specific locations are not a def initive
indicator of saf ety challenges and that countermeasures should be, to the greatest extent possible,
implemented proactively to prevent crashes from occurring. The LRSP builds upon the analysis completed
in the SSAR. To f urther advance the commitment to safety, the LRSP can be used to guide decision-making
as projects and opportunities arise. The LRSP outlines visions & goals that will guide the City’s planning
ef f orts and identifies safety partners that the City can work with to implement safety improvements. The
plan also identifies emphasis areas that the City should f ocus on. Goals and strategies to address these

                                     T
f ocus areas will be laid out, as well as a f ramework for evaluation and implementation.
The Traf f ic Saf ety Study was developed with special attention to pedestrian and bicycle safety
countermeasures to improve saf e mobility throughout the City given that those users are the most
                                  AF
vulnerable and are disproportionately likely to be injured or killed in a traf f ic crash. The TSS includes an
analysis of roadways and intersections within the City of Goleta as displayed in Figure 1. Countermeasures
were developed specific to signalized intersections, non-signalized intersections, mid-block crossings, and
roadway segments.
Bef ore the TSS was initiated, the City identified corridors that are particularly important to mobility within
and through the City to be focus areas f or the study. However, the TSS began with a review of all public
                      R
corridors and intersections within or adjacent to the city limits of Goleta to ensure a complete network
screening process to determine city-wide crash rates and comparative crash patterns. Data from the City’s
Bicycle and Pedestrian Master Plan were used to inform the study corridors. The study corridors are shown
in Figure 2. As analysis of the study area was conducted, locations with the highest potential to benefit
          D

f rom improvements were advanced f or f urther analysis. This process is discussed in more detail in the
Analysis section of this report.

__________________________________________________________________________________________________
City of Goleta                                                                                          7
TSS, SSAR & LRSP
APRIL 2021 | DRAFT FINAL REPORT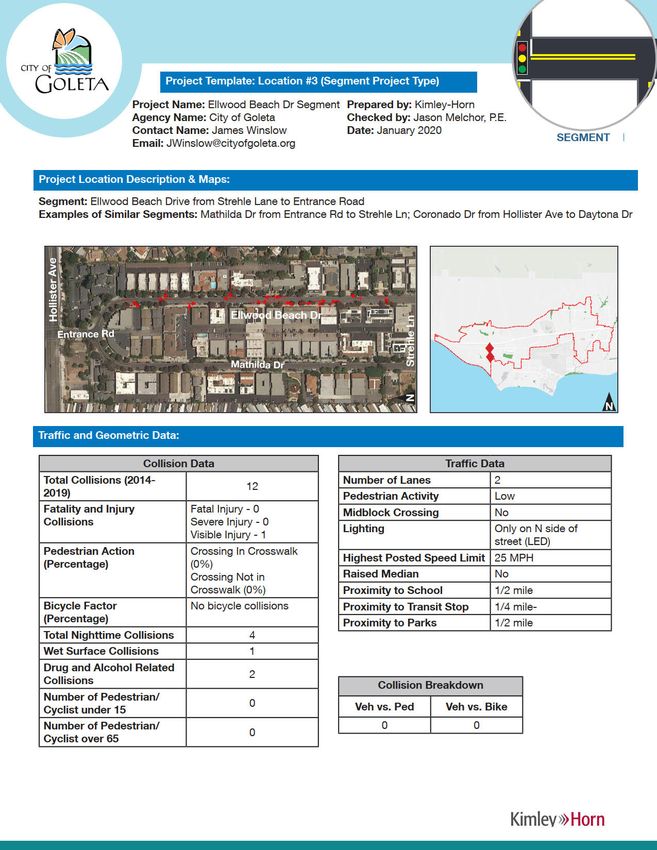
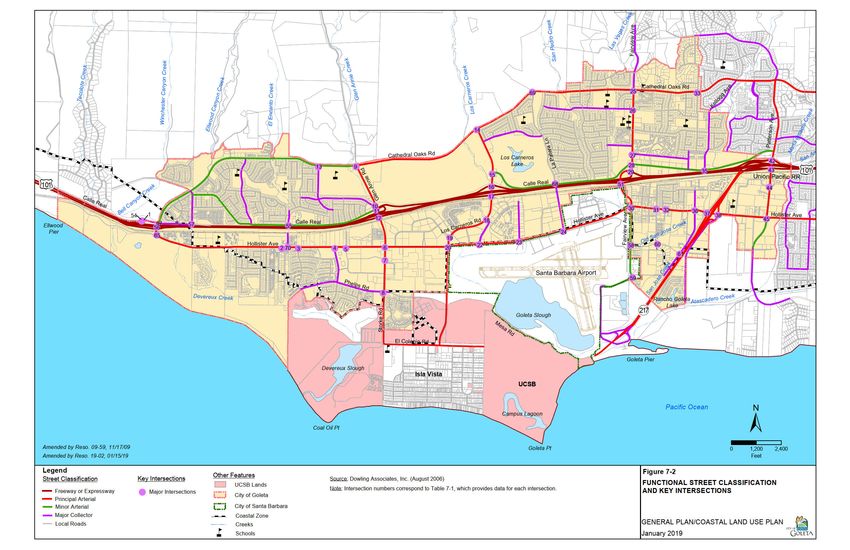
Figure 1 – Functional Classification Map (City of Goleta General Plan)

                                                                            T
                                                      AF
                                       R
                            D

______________________________________________________________________________________________________
                                       8                                                                                                  City of Goleta
                                                                                                                                   TSS & SSAR & LRSP
                                                                                                                    APRIL 2021 | DRAFT FINAL REPORT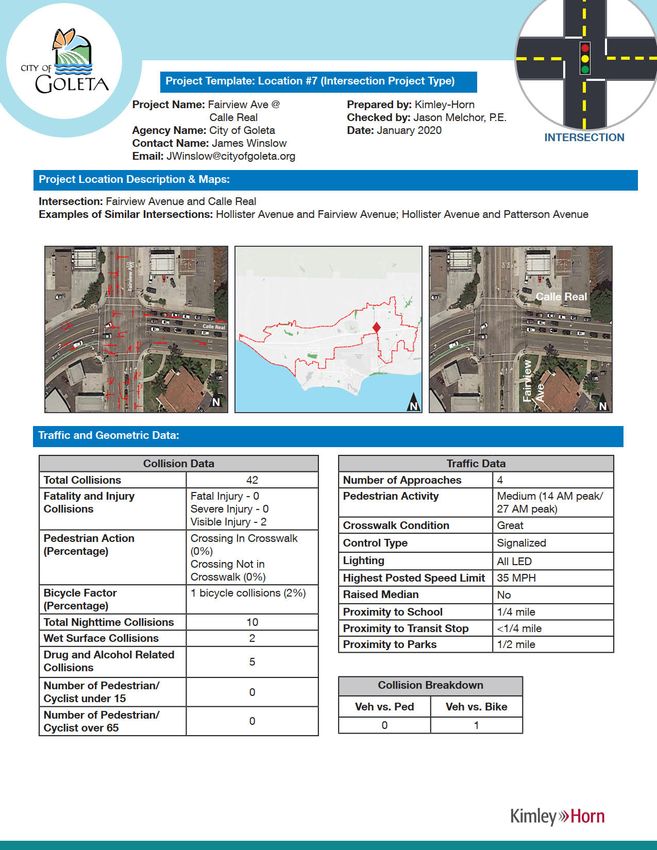
Figure 2 – Study Corridors

                                                                              T
                                                        AF
                                            R
                                D

__________________________________________________________________________________________________
City of Goleta                                                                                       9
TSS, SSAR & LRSP
APRIL 2021 | DRAFT FINAL REPORT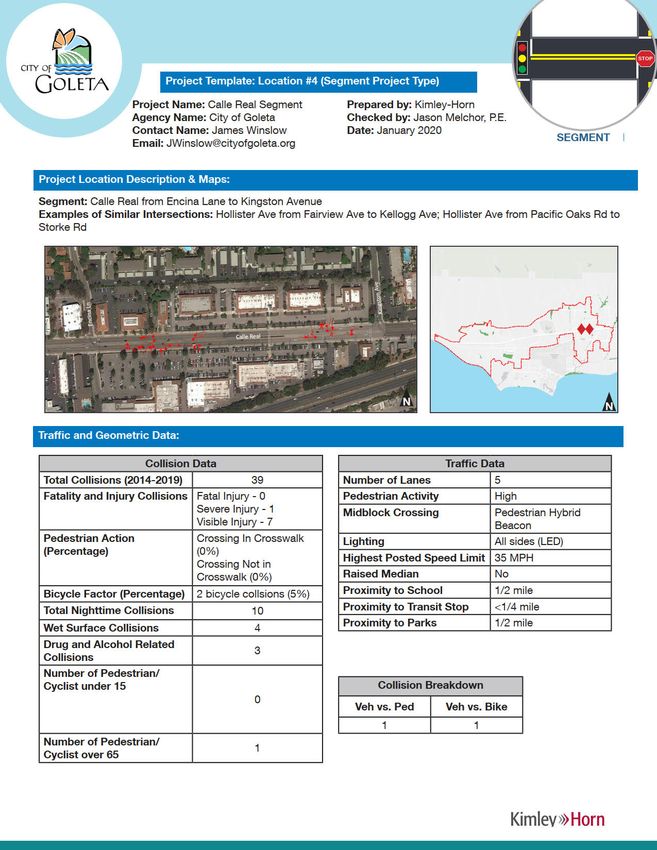
1.2 GOALS & OBJECTIVES
This project proactively evaluates the transportation network using guidance f rom the Local Roadway
Safety Manual and Caltrans’ Systemic Safety Analysis Report Program Guidelines. Mitigation measures
were evaluated using criteria to analyze the saf ety of road users (drivers, bicyclist, and pedestrians), the
interaction of modes, inf luences on the roadway network f rom adjacent municipalities, and the potential
benef its of safety countermeasures. The benefits from performing this level of traffic safety evaluation have
been shown to make local agencies more competitive for state and federal funding for safety projects, and
better address the fact that more than half of all traffic collisions occur on local roads.
Additionally, the data-driven approach provides the platform f or the collision statistics to inf orm areas or
modal user types that have a higher potential for collisions within the City. This affords for a more equitable
evaluation of recommendations.
A review of the goals and objectives that were developed through previous planning projects (i.e. Goleta
General Plan/Coastal Land Use Plan and Goleta Bicycle and Pedestrian Master Plan) was used to inspire
the development of goals and objectives for this traffic safety study. The Goals and Objectives for this
project have been identified as follows:
Goal #1: Identify areas with a high risk for collision.

                                    T
Objectives:
     a) Identif y intersections and segments in need of mitigation.
     b) Identif y areas of interest with respect to safety concerns for pedestrians and bicycles.
                                 AF
Goal #2: Develop a systemic process, which can be used to incorporate safety
improvements into regular maintenance and reconstruction projects.
Objectives:
     a) Demonstrate the systemic process’ ability to identify locations with higher risk f or collisions based
        on present characteristics closely associated with severe collisions.
     b) Demonstrate, through the systemic process, the gaps and data collection activities that can be
                     R
        improved upon.
     c) Integrate a process f or incorporating f uture planned improvements to the street and highway
        system based on land use and forecasted traffic volumes in the systemic process.
Goal #3: Analyze safety data to identify vehicle-related transportation enhancements to
          D

impact safety
Objectives:
     a) Evaluate risk and collision history to identify safety countermeasures.
     b) Identif y systemic improvements that can be implemented at locations of similar characteristics to
        help reduce vehicular collisions.
     c) Identif y traffic operations as well as infrastructure countermeasures for vehicular collisions.
     d) Identif y countermeasures that may help to reduce the number of f atal collisions resulting from a
        particular collision type.
Goal #4: Analyze safety data to enhance bicyclist and pedestrian infrastructure to impact
safety
Objectives:
     a) Evaluate risk and collision history to identify safety countermeasures.
     b) Identif y systemic improvements that can be implemented at locations with similar characteristics to
        improve bicycle and pedestrian infrastructure to encourage increased use by all ages groups.

______________________________________________________________________________________________________
10                                                                                                    City of Goleta
                                                                                               TSS & SSAR & LRSP
                                                                                APRIL 2021 | DRAFT FINAL REPORT
c) Identif y non-inf rastructure improvements (policies and programs) that can be implemented to
encourage safe behaviors
d) Encourage increased walking for recreational and other purposes by developing an interconnected,
saf e, convenient, and visually attractive pedestrian circulation system.
Goal #5: Identify non-infrastructure recommendations for the City
Objectives:
a) Identif y existing policies and programs within the City that can be integrated into safety
improvements
b) Identif y existing programs within the City and where there is potential to develop programs to
increase awareness of bicycle and walking benefits and to encourage residents to bicycle and walk
to work, shopping, school, and for recreation.
Goal #6: Identify funding for future safety projects
Objectives:
a) Create the outline f or a prioritization process that can be used in this and f orth-coming cycles to
apply for HSIP funding.
b) Use the systemic process to create Project Sheet Templates and apply f or HSIP f unding
consideration.
T
c) Demonstrate the correlation between the proposed safety countermeasures with the Vision Zero
Initiative and the California State Highway Safety Plan.
d) Identif y f unding sources that can be used f or saf ety projects as they relate to construction of
AF
transportation facilities.
e) Develop a coordination system f or interagency discussion regarding transportation plans and
f unding programs.
2 EXISTING CONDITIONS
R
2.1 BRIEF OVERVIEW OF CITY
The City of Goleta, located in Santa Barbara County, was incorporated in 2002. The City has a population
D
of 30,911 (2019 American Community Survey). Goleta is bordered by Isla Vista, which includes the
University of Calif ornia, Santa Barbara (UCSB), including the Santa Barbara Airport exclave. US-101
traverses Goleta and connects the City to key locations throughout California. SR 217 is a local f reeway
connector running through Goleta to Isla Vista and UCSB.
Even before its incorporation, Goleta had an important role in Santa Barbara County. In the late 19th century,
the area was known f or its dairy industry. By 1930, the oil industry had started to develop, which promoted
the construction of facilities to support these business endeavors. The agriculture industry remained strong
through the mid-twentieth century and remains an important part of tradition in the City today, even as major
companies have shifted employment trends into service and technology industries. As industry continued
to f lourish more homes and services were established throughout the area. Today, the City is known for its
great schools, proximity to the Pacific Ocean, and opportunities with the neighboring university.
Major attractions in Goleta include Goleta Beach, South Coast Railroad Museum, and Coronado Butterfly
Preserve. While Isla Vista is the primary location f or student housing, some seek out housing options in
Goleta. Santa Barbara County sees steady tourism throughout the year due to its mild climate.
__________________________________________________________________________________________________
City of Goleta 11
TSS, SSAR & LRSP
APRIL 2021 | DRAFT FINAL REPORTAs Goleta’s population continues to grow, the City is working to prepare for the f uture demands on its
inf rastructure and resources. Construction projects in the area include additional housing, mixed-use
development, office space, and industry f acilities. Road improvements are happening through the City to
promote complete streets initiatives, street widening f or enhanced saf ety and ef f iciency, highway
improvements f or US-101, and intersection improvements. The City is also working on developing a new
passenger rail station that would encourage more ridership using the Goleta stop to the Pacific Surfliner
route.
2.2 PLANS & POLICIES
Existing plans, policies, recently completed plans, and planned or on-going projects within the City of Goleta
were reviewed as part of the existing conditions. High-level key points regarding transportation
improvements and saf ety-related topics were included in the review. The f ollowing identify some of the
more recent plans and projects that were used as a reference in the analysis process.
• Goleta General Plan (2006)
• Hollister Complete Streets Corridor Plan
• Goleta Bicycle/Pedestrian Master Plan
• 101 Overpass Project
• Cathedral Oaks Interim Crib Wall Repair Project
T
• Cathedral Oaks Pavement Rehabilitation Project
• Ekwill & Fowler Roads Extension
• Armitos Pedestrian & Bike Bridge Project
AF
• Fairview Avenue/Stow Canyon Road Sidewalk Infill Project
• Old Town Sidewalk Infill Project
• Rectangular Rapid Flashing Beacons at Chapel Street and Pedestrian Hybrid Beacons at Kingston
Avenue
2.3 EXISTING FACILITIES
R
A review of the transportation network (roadway, transit, bicycle, and pedestrian facilities) was completed
to evaluate the existing conditions of the City of Goleta. Understanding the existing gaps in the network,
recent improvements, and the challenges and opportunities set the framework for the later project analysis
and issues identification. The f ollowing section provides a summary of the existing conditions this TSS
D
analysis is based upon.
2.3.1 ROADWAY NETWORK
US-101 bisects the City of Goleta and is a major inf luencer on the roadway network. There are only five
north-south crossing over US-101 which impacts the f ormation of neighborhood roadway networks that
would provide increased north-south connectivity. Higher roadway network densities exist in residential
neighborhoods and Old Town Goleta, while commercial and industrial areas have more sparse roadway
networks.
From the City General Plan (2006), Figure 1 above displays the f unctional classification of the roadway
network. Six of the main connecting corridors through the City are identified as Principal Arterial, with four
Minor Arterials and more than twenty Major Collectors. The limited US-101 crossovers and lack of grid
network constrain the existing connections of this mostly built-out roadway network.
2.3.2 BIKE & PED NETWORK
In 2018, the City of Goleta f inalized their Bicycle and Pedestrian Master Plan (BPMP) which incorporated
aspects of regional planning and previous master plans dating back to the 2005 Interim Bicycle
Transportation Plan. The development of the BPMP involved comprehensive community engagement,
______________________________________________________________________________________________________
12 City of Goleta
TSS & SSAR & LRSP
APRIL 2021 | DRAFT FINAL REPORTincluding public workshops, online surveys, and consultation with a technical advisory committee. This input
f rom the public informed the f ocus areas of the BPMP and will continue to inform the f ocus areas of the
LRSP. The plan also integrates the Hollister Avenue Complete Streets Corridor Plan and other project
spotlights. In addition to the conventional bicycle treatments identified in this plan, enhanced bicycle, low
stress, pedestrian, and traffic calming treatments are described.
The BPMP is f ocused on developing more active corridors. Sidewalk inf ill is prioritized in areas with
connection to transit. Transit access is also an emphasis factor for identifying gaps in the bicycle network.
Figure 3 displays a comprehensive map of the bicycle and pedestrian facilities that are both existing and
planned so the desired end-product of the active transportation network is shown.
Figure 3 – Future Active Transportation Network Map (BPMP)
T
AF
R
D
Source: Bicycle and Pedestrian Master Plan (2018)
2.3.3 TRANSIT NETWORK
Bus transit services are provided to the City of Goleta through the Metropolitan Transit District (MTD), with
a number of routes. MTD also provides connections f rom the University of California at Santa Barbara to
the area between North Goleta and Carpinteria. The Clean Air Express service also provides connections
to the cities of Santa Barbara, Santa Maria, and Lompoc. Figure 4 displays the MTD routes that serve
Goleta (as of 2019).
__________________________________________________________________________________________________
City of Goleta 13
TSS, SSAR & LRSP
APRIL 2021 | DRAFT FINAL REPORTFigure 4 – MTD Transit Routes in the Goleta Area
T
AF
In addition to bus transit, the Goleta area is also served by Amtrak’s Pacific Surfliner. In 2019, a new Goleta
Train Depot Station Area Master Plan was created to plan f or the development of a new multimodal train
station at the location of the existing Amtrak platform which will also provide connections to bus transit.
As part of the BPMP, the City of Goleta identified ways to enhance transit access via bicycling and walking.
R
D
______________________________________________________________________________________________________
14 City of Goleta
TSS & SSAR & LRSP
APRIL 2021 | DRAFT FINAL REPORT3 DATA UTILIZED IN ANALYSIS PROCESS
3.1 ROADWAY NETWORK
The collision analysis, which is described in detail in the section Data Analysis, groups City roadways by
f unctional classification. Figure 5 shows the roadway classifications that were used in the analysis. This
classification designated each corridor as either an Arterial, Collector, or Minor street in order to compare
the f unctional design and capacity. Caltrans facilities were included in the crash analysis, but detailed site
reviews and countermeasure recommendations were limited to City roadways.
T
AF
R
D
__________________________________________________________________________________________________
City of Goleta 15
TSS, SSAR & LRSP
APRIL 2021 | DRAFT FINAL REPORTFigure 5 – Function Classification Network
T
AF
R
D
______________________________________________________________________________________________________
16 City of Goleta
TSS & SSAR & LRSP
APRIL 2021 | DRAFT FINAL REPORT3.2 COLLISIONS
From January 1, 2014 through December 31, 2019, just under 1,800 collisions were recorded on public
roadways in the City of Goleta. Collision records were allocated to intersection and the mid-block segments
of the roadway. Using data for the past five-year period allows the analysis to prove trends in collisions by
location and types. This time period also allows the analysis to take into account effects of past roadway
improvements and construction projects.
Figure 6 shows the locations of collisions at intersections and along segments of the corridors. The largest
number of collisions are located at the intersection of Hollister Ave & Storke Road, and along the segment
of Calle Real f rom Encina Ln to Kingston Ave. Unsafe speed accounted f or 26% of all collisions as the
highest contributing factor. The two next highest contributing factors were improper turning and automobile
right-of-way violations, each at 19% of all collisions.
Figure 6 – Intersection and Mid-block Collisions (2014-2019)
T
AF
R
D
__________________________________________________________________________________________________
City of Goleta 17
TSS, SSAR & LRSP
APRIL 2021 | DRAFT FINAL REPORT3.2.1 GOLETA VALLEY COTTAGE HOSPITAL TRAUMA CENTER
The City is identifying a way to incorporate data from the Goleta Valley Cottage Hospital Trauma Center
to f urther inform the LRSP and future analysis.
T
AF
R
D
______________________________________________________________________________________________________
18 City of Goleta
TSS & SSAR & LRSP
APRIL 2021 | DRAFT FINAL REPORT3.3 VOLUMES
Traf f ic volumes are used to estimate crash rates which can be used to identify safety opportunities in
locations where lower traf f ic volume also means lower numbers of collisions. Crash rates are then
aggregated f or each intersection type and roadway classification to develop systemic crash rates. These
systemic crash rates are then compared against crash rates at individual intersections. For this Study,
Average Daily Traffic (ADT) volumes were taken from recently completed traffic counts. These counts were
taken by previous City consultants, GHD, Kittleson & Associates, and Marketing Planning Solutions.
Tube counts or turning movement counts (TMCs) were collected at the locations identified in Table 1. The
turning movement counts were collected f rom Tuesday, October 8th to Thursday, October 10th, 2019.
Turning movement counts were measured for vehicles during the AM/PM peak periods, and for pedestrians
and bicyclists during the AM/MD/PM peak periods. Tube counts were collected on Thursday, October 10th,
2019 f or the entire 24-hour period.
Table 1 – Traffic Count Locations
Roadway
Limits/Cross Street(s) Count Type
Segment
Calle Real Encina Ln & Kingston Ave Tube
T
Calle Real Los Carneros Rd & La Patera Ln Tube
Calle Real San Rossano Dr & Ellwood Station Rd Tube
Cathedral Oaks Rd Brandon Dr & Evergreen Dr Tube
AF
Cathedral Oaks Rd Glen Annie Rd & Los Carneros Rd Tube
Cathedral Oaks Rd Santa Marguerita Dr & Fairview Ave Tube
Fairview Ave Stow Canyon Rd & Berkeley Rd Tube
Fairview Ave US-101 SB & Hollister Ave Tube
Glen Annie Rd Cathedral Oaks Rd & Calle Real Tube
R
Hollister Ave Rutherford St & Kellogg Wy/Kinman Ave Tube
Hollister Ave Cortona Dr & Coromar Dr Tube
Hollister Ave Santa Barbara Shores Dr & Palo Alto Dr Tube
Los Carneros Rd Cremona Dr & Raytheon Dr Tube
D
Storke Rd Phelps Rd & Whittier Dr Tube
Cathedral Oaks Rd Winchester Canyon Rd Turning Volume
Cathedral Oaks Rd Calle Real Turning Volume
Hollister Ave Cathedral Oaks Rd Turning Volume
Hollister Ave Entrance Rd Turning Volume
Hollister Ave Cannon Green Dr Turning Volume
Storke Rd Santa Felicia Dr Turning Volume
Storke Rd Marketplace Dr Turning Volume
Hollister Ave Storke Rd Turning Volume
Calle Real US-101 SB Turning Volume
Calle Real Glen Annie Rd/US-101 NB Turning Volume
Cathedral Oaks Rd Glen Annie Rd Turning Volume
Los Carneros Rd Hollister Ave Turning Volume
__________________________________________________________________________________________________
City of Goleta 19
TSS, SSAR & LRSP
APRIL 2021 | DRAFT FINAL REPORTRoadway
Limits/Cross Street(s) Count Type
Segment
Los Carneros Calle Koral Turning Volume
Los Carneros Rd US-101 SB Turning Volume
Los Carneros Rd US-101 NB Turning Volume
Los Carneros Rd Calle Real Turning Volume
Los Carneros Rd Cathedral Oaks Rd Turning Volume
Hollister Ave Fairview Ave Turning Volume
Fairview Ave US-101 SB Turning Volume
Fairview Ave US-101 NB Turning Volume
Calle Real Fairview Ave Turning Volume
Cathedral Oaks Rd Fairview Ave Turning Volume
Hollister Ave Kellogg Ave Turning Volume
Hollister Ave SR-217 SB Turning Volume
Hollister Ave SR-217 NB/Ward Dr Turning Volume
Calle Real Kellogg Ave Turning Volume
T
Hollister Ave Patterson Ave Turning Volume
Patterson Ave US-101 SB Turning Volume
Patterson Ave
AFUS-101 NB Turning Volume
Patterson Ave Overpass Rd Turning Volume
Fairview Ave Mandarin Turning Volume
Nectarine Ave Mandarin Ave Turning Volume
Hollister Ave Nectarine Ave/Pine Ave Turning Volume
Hollister Ave Rutherford St Turning Volume
R
D
______________________________________________________________________________________________________
20 City of Goleta
TSS & SSAR & LRSP
APRIL 2021 | DRAFT FINAL REPORT4 PUBLIC OUTREACH
4.1 PUBLIC WORKSHOP
A public meeting was held on Wednesday July 24, 2019
f rom 6:00-7:00PM at the Goleta Community Center
(5679 Hollister Avenue). During this meeting, a
presentation was given to provide an overview of the
project including a description of the project, an
explanation of the SSARP, desired project outcomes,
and the overall project timeline. Af ter the presentation,
the meeting broke into an open house f ormat and
encouraged participants to provide f eedback on maps
and comment cards. This inf ormation was used to help
identify areas of concerns for local stakeholders.
4.2 EMERGENCY SERVICES & ENFORCEMENT MEETING SUMMARY
T
A meeting was held with the County Sherriff’s/Police Department to discuss their observations in the f ield
of the trends and patterns they have seen of the years. Additionally, the enf orcement priorities and their
outcomes were described to identify ways to incorporate the local enforcements knowledge and perspective
AF
into potential countermeasures for the City of Goleta.
4.3 LRSP STAKEHOLDER MEETING
A meeting with selected stakeholders was held on Thursday April 8, 2021 at 1:30 PM (virtually through
Zoom). Stakeholders included City staf f, local law enf orcement, and representatives f rom UCSB,
community groups and other organizations. During this meeting, a presentation was given to provide an
overview of the project, an explanation of the LRSP, a breakdown of citywide safety background and trends,
R
and identif ied emphasis areas, and a walkthrough of recommended safety improvements and prioritized
projects. Af ter the presentation, the meeting broke into small f ocus groups where participants were
encouraged to provide f eedback. This inf ormation was used to help identify areas of concerns f or local
stakeholders.
D
4.4 LRSP PUBLIC MEETING
A public meeting will be held on Wednesday April 28, 2021 at 5:00 PM (virtually through zoom).
PLACEHOLDER FOR PUBLIC MEETING SUMMARY
__________________________________________________________________________________________________
City of Goleta 21
TSS, SSAR & LRSP
APRIL 2021 | DRAFT FINAL REPORT5 DATA ANALYSIS
The f ollowing section describes the data analysis process undertaken to evaluate saf ety of the
transportation network in the City of Goleta at a systemic level. Using a network screening process,
locations within the City that will most likely benefit f rom safety enhancements will be identified. Using
historic collision data, collision risk factors for the entire network are derived. The outcomes will inform the
identification and prioritization of engineering and non-infrastructure safety measures that address certain
roadway characteristics and related behaviors that contribute to crashes.
5.1 GUIDING MATERIALS
5.1.1 LOCAL ROADWAY SAFETY MANUAL
The Local Roadway Safety Manual: A Manual for California’s Local Road Owners (Version 1.5, April 2020)
purpose is to encourage local agencies to pursue a proactive approach to identifying and analyzing safety
issues, while preparing to compete f or project f unding opportunities. A proactive approach is def ined as
analyzing the safety of the entire roadway network by through either a one-time, network wide analysis, or
by routine analyses of the roadway network. 1
According to the Local Roadway Safety Manual (LRSM), “The Calif ornia Department of Transportation
T
(Caltrans) – Division of Local Assistance is responsible for administering California’s federal safety funding
intended for local safety improvements.”
To provide the most benefit and to be competitive for funding, thus leading to countermeasure selection the
AF
report should f ocus on both intersections and roadway segments and be considerate of roadway
characteristics and traffic volumes. The result should be a list of locations that are most likely to benefit
f rom cost-effective countermeasures, preferably prioritized by benefit/cost ratio. The manual suggests using
a mixture of quantitative and qualitative measures to identify and rank locations that considers both crash
f requency and crash rates. These f indings should then be screened for patterns such as crash types and
severity to aid in the determination of issues causing higher numbers of crashes and the potential
countermeasures that could be most effective. Qualitative analysis should include field visits and a review
R
of existing roadway characteristics and devices. The specific roadway context can then be used to assess
what conditions may increase safety risk at the site and systematic level.
Countermeasure selection should be supported using Crash Modification Factors (CMFs). These f actors
D
are the peer reviewed product of before and af ter research that quantifies the expected rate of collision
reduction that can be expected f rom a given countermeasure. If more than one countermeasure is under
consideration, the LRS provides guidance on how to apply CMFs appropriately.
5.1.2 HIGHWAY SAFETY MANUAL
“The AASHTO Highway Safety Manual (HSM), published in 2010, presents a variety of methods for
quantitively estimating crash f requency or severity at a variety of locations.” 2 This f our-part manual is
divided into Parts: A) Introduction, Human Factors, and Fundamentals, B) Roadway Safety Management
Process, C) Predictive Method, D) Crash Modification Factors.
Chapter 4 of Part B of the HSM discusses the Network Screening process. The Network Screening Process
is a tool f or an agency to analyze their entire network and identify/rank locations that (based on the
1
Local Roadway Safety Manual (Version 1.5) 2016. Page 5.
2
AASHTO, Highway Safety Manual, 2010, Washington D.C.,
http://www.highwaysafetymanual.org/Pages/About.aspx
______________________________________________________________________________________________________
22 City of Goleta
TSS & SSAR & LRSP
APRIL 2021 | DRAFT FINAL REPORTimplementation of a countermeasure) are most likely to least likely to realize a reduction in the f requency
of collisions.
The HSM identifies five steps in this process: 3
1. Establish Focus: Identif y the purpose or intended outcome of the network screening analysis.
This decision will influence data needs, the selection of performance measures and the screening
method that can be applied.
2. Identify Network and Establish Reference Populations: Specify the types of sites or f acilities
being screened (i.e., segments, intersections, geometrics) and identify groupings of similar sites or
f acilities.
3. Select Performance Measures: There are a variety of perf ormance measures available to
evaluate the potential to reduce crash frequency at a site. In this step, the performance measure is
selected as a f unction of the screening focus and the data and analytical tools available.
4. Select Screening Method: There are three principle screening methods described in this chapter
(i.e., ranking, sliding window, peak searching). Each method has advantages and disadvantages;
the most appropriate method for a given situation should be selected.
5. Screen and Evaluate Results: The f inal step in the process is to conduct the screening and
analysis and evaluate the results.
T
The HSM provides a number of statistical methods f or screening roadway networks to identify high risk
locations based on overall collision histories. In addition to f lat crash quantities, the method used in this
AF
study is referred to as Critical Crash Rate (CCR).
5.2 ANALYSIS TECHNIQUES
5.2.1 COLLISION ANALYSIS
The initial steps of the collision analysis involved establishing reference populations of roadway segments
and intersections that have similar characteristics. For this study, intersections were grouped by their control
type (signalized, unsignalized, roundabout) and segments by their f unctional classification (Arterial,
R
Collector, Minor). Individual collision rates were calculated for each sub-population. The population level
crash rates were then used to assess whether or not a specific location has more or f ewer crashes than
expected. These sub-populations were also used to determine typical crash patterns to help identify
locations where unusual numbers of specific crash types are seen.
D
Critical Crash Rate (CCR) Analysis
Reviewing the number of collisions at a location is a good way to understand the cost to society incurred at
the local level but does not give a complete indication of the level of risk for those who use that intersection
or roadway segment on a daily basis. The Highway Saf ety Manual describes the Critical Crash Rate
method, which provides a statistical review of locations to determine where risk is higher than that
experienced by other similar locations. It is also the f irst step in analyzing f or patterns that may suggest
systemic issues that can be addressed at that location, and proactively at others to prevent new safety
challenges from emerging.
The Critical Crash Rate compares the observed crash rate to the expected crash rate at a particular location
based on facility type and volume using a locally calculated average crash rate f or the specific type of
intersection or roadway segment being analyzed. Based on traffic volumes and a weighted citywide crash
rate f or each f acility type, a critical crash rate threshold is established at the 95% confidence level to
3
AASHTO. Highway Safety Manual. 2010. Washington, DC. Page 4-2.
__________________________________________________________________________________________________
City of Goleta 23
TSS, SSAR & LRSP
APRIL 2021 | DRAFT FINAL REPORTdetermine locations with higher crash rates that are unlikely to be random. The threshold is calculated for
each location individually based on its traffic volume and the crash profile of similar facilities.
Figure 7 – Critical Crash Rate Formula
Source: Highway Safety Manual
Data Needs
CCR can be calculated using:
T
• Daily entering volume for intersections, or vehicle miles travelled (VMT f or roadway segments;
• Intersection control types to separate them into like populations;
• Roadway functional classification to separate them into like populations;
AF
• Collision records in GIS or tabular form including coordinates or linear measures.
Strengths
• Reduces low volume exaggeration
• Considers variance
• Establishes comparison threshold
R
Network Screening Analysis
The network screening process builds upon the CCR process in order to associate additional factors with
D
the locations. These f actors were 1) collision injury (f atality, severe injury, other visible injury, property
damage only), 2) collision type (broadside, head-on, sideswipe, bicycle, pedestrian, other), 3)
environmental factors (lighting, wet roads, intoxicated drivers). With these additional factors, the locations
were f urther analyzed and assigned a new rank.
From the results of the CCR and network screening analyses, ten intersections in each intersection type
(signalized, unsignalized, roundabout) and ten roadway segments f rom each segment type (arterial,
collector, minor) were chosen. These intersections and roadway segments were chosen based upon total
number of collisions, high CCR f actors, high number of fatalities/severe injuries, and several other factors.
The City reviewed these chosen intersections/segments, and 15 locations (5 roadway segments and 10
intersections) were chosen for issue identification analysis.
5.2.2 SITE VISITS
Site visits were conducted throughout the course of this project. Site visits are an integral aspect of Systemic
Saf ety Analysis. Through these site visits, confirmation of existing conditions as well as visual observations
are documented f or use in analysis. Site visits are conducted at various times in order to identify any
______________________________________________________________________________________________________
24 City of Goleta
TSS & SSAR & LRSP
APRIL 2021 | DRAFT FINAL REPORTimportant f eatures that play a role in the saf ety of an intersection or segment of roadway during light and
dark conditions.
Based upon a preliminary collision analysis, ten locations were identified f or a site visit with Kimley-Horn
and City staff. The f ollowing ten locations were visited on July 24, 2019:
• Signalized Intersections
o Hollister Ave and Storke Road
o Calle Real and Fairview Ave
o Marketplace Dr and Storke Rd
o Calle Real and Encina Lane
• Unsignalized Intersections
o Hollister Ave and Santa Felicia Dr
o Los Carneros Rd and Calle Koral
• Pedestrian Signals
o Calle Real and Fairview Shopping Centers
• Segments
o Storke Rd, from US-101 SB Ramps to Hollister Ave
o Cathedral Oaks Rd, from Glen Annie Rd to Los Carneros Rd
T
o Calle Real, f rom Encina Ln to Kingston Ave
5.3 ISSUES IDENTIFICATION
AF
Following the CCR and network screening analyses, 15 locations (f ive roadway segments and ten
intersections) were chosen f or f urther analysis during issues identification. Diagrams of the collisions
occurring at these locations during the study period have been developed to visually display their placement
and type at each location. From these diagrams, location-specific issues were identified, and preliminary
countermeasures were developed for further discussion with the City.
R
Intersections
Following the collision analysis, the following ten intersections were identified for issue identification:
• Intersection of Hollister Avenue and Storke Road
D
• Intersection of Fairview Avenue and Calle Real
• Intersection of Marketplace Drive and Storke Road
• Intersection of Glenn Annie Road and Cathedral Oaks Boulevard
• Intersection of Calle Real and Encina Lane
• Intersection of Cathedral Oaks Boulevard and Fairview Avenue
• Intersection of Calle Koral and Los Carneros Road
• Intersection of Cathedral Oaks Rd and Los Carneros Road
Roadway Segments
Following the collision analysis, the following five roadway segments were identified for issue identification:
• Cathedral Oaks Blvd from Glenn Annie Road to Los Carneros Road
• Patterson Avenue from Hollister Avenue to Patterson Place
• Ellwood Beach Drive from Strehle Lane to Entrance Road
• Calle Real f rom Encina Lane to Kingston Avenue
• Alondra Drive from Nectarine Avenue to Mallard Avenue
__________________________________________________________________________________________________
City of Goleta 25
TSS, SSAR & LRSP
APRIL 2021 | DRAFT FINAL REPORT5.4 RESULTS
The f ollowing section displays the results of the analysis process which evaluated the collisions by cause,
crash type, and location.
5.4.1 SUMMARY OF THE DATA ANALYSIS
Cause of Collision
As shown in Figure 8, the most f requent contributing f actor as identified by the responding officer for
collisions are unsaf e speed (25%), followed by auto R/W violation (21%), improper turning (19%), and
pedestrian violations (9%). The remaining causes f or collisions total just over a quarter of the collisions
within Goleta. Other common reasons of collisions are unsaf e starting/backing, traffic signals and signs,
and unsaf e lane changes. Within Goleta, 13% of all reported collisions involved lane departure. Caltrans
def ines collisions involving lane departure as those with collision types listed as ‘Head-On’, ‘Hit Object’, or
‘Overturned’.
Figure 8 - Collisions by Cause
26% Unsafe Speed
19% Improper Turning
T
19% Auto R/W Violation
9% Driving Under Influence
5%
6% Traffic Signals and Signs
AF
5% Unsafe Starting or Backing
26% 5% Unsafe Lane Change
5%
2% Wrong Side of Road
1% Unknown
6% 1% Improper Passing
1% Other Hazardous Movement
1% Other Than Driver or Ped
R
1% Ped R/W Violation
9% 1% Pedestrian Violation
19%
1% Following Too Closely
0.4% Impeding Traffic
D
19%
0.4% Other Improper Driving
0.3% Other
0.3% Other Than Driver
0.1% Lights
0.1% Hazardous Parking
Active Transportation
Goleta promotes active transportation and has an extensive bicycle and pedestrian inf rastructure
throughout the City. As discussed in earlier sections of this report, one fatality within the Goleta involved a
bicyclist. Regarding all collisions within the City, 6% involved bicycles and 3% involved pedestrians. The
statewide averages are 3% and 4% for collisions involving bicycles and pedestrians, respectively.
Driver Age
Aging Drivers (ages 65 and up) and Young Drivers (ages 15-20) are more often found at fault for collisions
in which they are involved. The collision data f or the study period indicate that 17% of collisions within
Goleta involved Aging Drivers and 22% involved Young Drivers. Both these f igures are higher than the
______________________________________________________________________________________________________
26 City of Goleta
TSS & SSAR & LRSP
APRIL 2021 | DRAFT FINAL REPORTproportion of City population that is 65+ and aged 15-20, which is 15.6% and 5.8%, respectively. This
percentage of Young Driver collisions is higher than those found statewide and could be influenced by the
proximity of the University of California at Santa Barbara.
Behavioral Driving
Behavioral attributes associated with drivers include, but are not limited to, aggressive driving and impaired
driving. The level of involvement of these two behavioral categories on collisions within Goleta have been
evaluated as part of this study.
Caltrans def ined aggressive driving as driving behaviors that include speeding, tailgating, and other
reckless maneuvers (as identified by the on-scene of ficer). Within Goleta, approximately 33% of all
collisions were categorized as involving aggressive driving, which is lower than the statewide average of
40%.
Collisions involving drugs or alcohol include all collisions where there was any evidence of drug or alcohol
use by the driver. Approximately 10% of collisions within the Goleta were associated with alcohol or drugs.
This rate is roughly double the statewide average. This is different f rom impaired driving statistics in that
drivers do not need to exceed the legally defined threshold of intoxication to be counted. Caltrans considers
any level of alcohol consumption to have the potential to impact driver responsiveness and decision making.
T
Other Modes and Challenge Areas
Caltrans guidance encourages examination of additional modal breakdown and challenge areas based on
trends seen statewide. The f ollowing Caltrans identif ied challenge areas represent more than 1% of
collisions within Goleta.
AF
• Motorcycle collisions comprise approximately 3% of all reported collisions, which is roughly equal
to the state average
• Collisions involving commercial vehicles comprise approximately 2% of all reported collisions,
which is nearly half the state average. This is defined as collisions involving commercial vehicles,
school buses, or other types of buses.
R
• 2% of all reported collisions took place within a work zone, defined as areas noted as ‘Construction
or Repair Zone’ which is nearly three-times the state average.
5.4.2 HIGHEST OCCURRING CRASH TYPES
D
As shown in Figure 9, broadside collisions accounted f or 32% of all collisions, f ollowed by rear-end
collisions (29%), and sideswipe collisions (17%). Of the remaining 22%, the common collision types include
hit object, head-on, and vehicle-pedestrian collisions.
__________________________________________________________________________________________________
City of Goleta 27
TSS, SSAR & LRSP
APRIL 2021 | DRAFT FINAL REPORTYou can also read