EARLY ONLINE RELEASE - EARLY ONLINE ...
←
→
Page content transcription
If your browser does not render page correctly, please read the page content below
The Meteorological
                                              Society of
                                              Japan

   Scientific Online Letters on the Atmosphere (SOLA)

         EARLY ONLINE RELEASE

This is a PDF of a manuscript that has been peer-reviewed
and accepted for publication. As the article has not yet been
formatted, copy edited or proofread, the final published
version may be different from the early online release.

This pre-publication manuscript may be downloaded,
distributed and used under the provisions of the Creative
Commons Attribution 4.0 International (CC BY 4.0) license.
It may be cited using the DOI below.

The DOI for this manuscript is

DOI: 10.2151/sola. 2021-008.

J-STAGE Advance published date: Feb 9, 2021

The final manuscript after publication will replace the
preliminary version at the above DOI once it is available.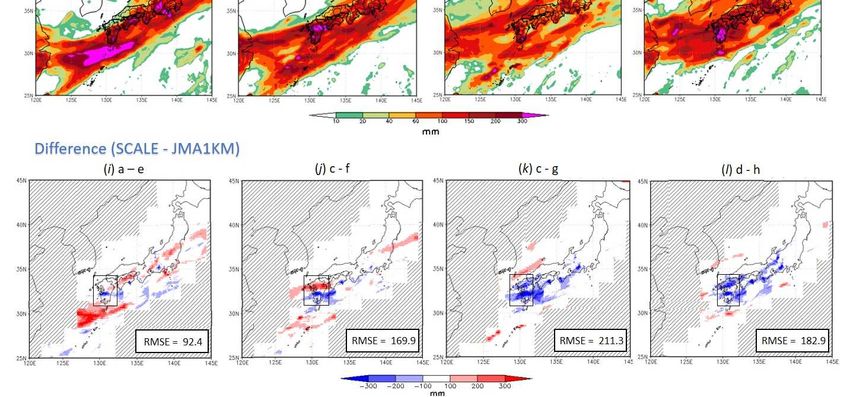
SOLA2021, Vol.17, XXX-XXXX, doi: 10.2151/sola.2021-008

           Predictability of the July 2020 Heavy Rainfall with the

                                               SCALE-LETKF

           James Taylor1, Arata Amemiya1, Takumi Honda1, Yasumitsu Maejima1 and Takemasa

                                                    Miyoshi1,2,3,4,5
                       1
                           RIKEN Research Center for Computer Science (R-CCS), Kobe, Japan
            2
                RIKEN interdisciplinary Theoretical and Mathematical Sciences Program, Japan
   3
       Department of Atmospheric and Oceanic Science, University of Maryland, College Park,

                                                   Maryland, USA
                 4
                     Japan Agency for Marine-Earth Science and Technology, Yokohama, Japan
       5
           Prediction Science Laboratory, RIKEN Cluster for Pioneering Research, Kobe, Japan

Corresponding author: James Taylor, RIKEN, Kobe, Hyogo 650-0047, Japan. E-mail:

james.taylor@riken.jp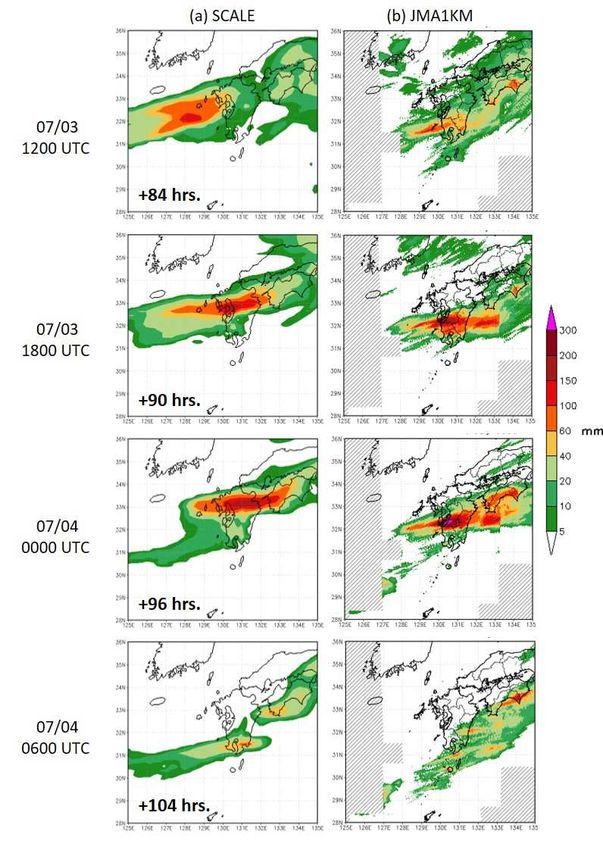
SOLA2021, Vol.17, XXX-XXXX, doi: 10.2151/sola.2021-008

Abstract

The predictability of the July 2020 heavy rainfall event that saw record-breaking rainfall over

Western Japan in July 2020 is examined with the near real-time SCALE-LETKF numerical

modelling system in a low resolution 18-km configuration setting. Ensemble-mean 5-day rainfall

total forecasts showed close agreement with Japanese Meteorological Agency 1-km precipitation

analyses in relation to the large-scale distribution of rainfall and to location of heaviest rainfall

over Kyushu. Onset and duration of rainfall at specific sites across Kyushu were also well

predicted by the forecasts. However, the precise prediction of heavy rainfall, including over the

worst-hit Kumamoto and Kagoshima prefectures, was severely underestimated.

Examination of the atmospheric conditions at the time of the heavy rainfall from reanalysis

datasets and ensemble member forecasts showed very high humidity over central Kyushu with

strong transport of moisture from the southwest to central regions. In addition, strong low-level

convergence was observed to the west of Kyushu in both reanalysis and best performing member

forecasts during the time of heavy rainfall, suggesting a potential contributing factor to the record-

breaking rainfall.

Citation: Taylor, J., A. Amemiya. T. Honda, Y. Maejima and T. Miyoshi, 2020: Predictability of

the July 2020 Heavy Rainfall with the SCALE-LETKF. SOLA Vol.16,doi:10.2151/sola.2021-008

                                                  2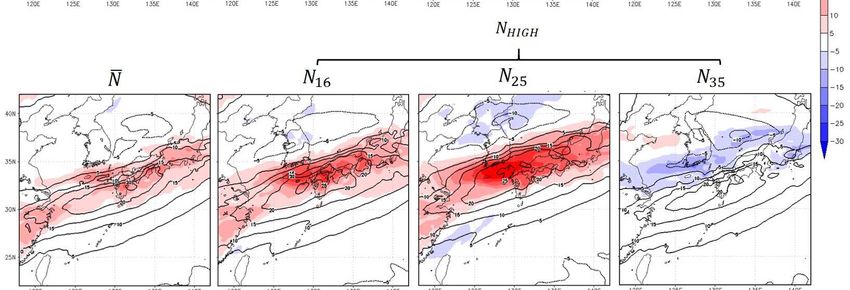
SOLA2021, Vol.17, XXX-XXXX, doi: 10.2151/sola.2021-008

1.   Introduction

July 2020 saw Japan experience a month-long period of torrential rainfall, with record-breaking

rainfall across many parts of Western and Eastern Japan, including Kyushu, Shikoku and Nagano.

According to Government statistics, rainfall totals exceeded 2000 mm in many places, including

in Nagano and Kochi prefectures, while parts of northern and southern Kyushu, including Tokai

and Tohoku, recorded their highest 24-, 48- and 72-hour rainfall totals in history (Government of

Japan, 2020). Some of the worst-affected areas were in Kumamoto and Kagoshima prefectures,

which saw extremely high intensity rainfall between July 3 and July 7, leading to flooding of the

Kuma River and several thousand buildings to be submerged. As of 3 September 2020, 84

fatalities had been reported as a direct result of the heavy rainfall (Fire and Disaster Management

Agency, 2020).

Severe convective weather systems bringing sudden, high intensity rainfall are a common

occurrence in Japan, especially during the summer months when the Baiu front (BF) transports

very moist air from the southern monsoon regions towards Japan (Matsumoto et al. 1971,

Akiyama 1973; 1975, Ninomiya and Shibagaki 2007). In July 2018, record-breaking heavy

rainfall fell in parts of Hokkaido and Western Japan, with some prefectures, including Miyazaki

and Kochi, receiving over 1000 mm in 12 days. Following such extreme rainfall events,

collaborative efforts are made by the research community to understand the primary factors that

led to the excessive rainfall e.g., Shimpo et al. (2019), Takemura et al. (2019) and review the

predictability of these disastrous events through numerical weather prediction (NWP) e.g.,

Kotsuki et al. (2019).

In this study we investigate the predictability of the July 2020 heavy rainfall with the near real-

time (NRT) SCALE-LETKF modelling system (Lien et al. 2017). This system couples the

Scalable Computing for Advanced Library and Environment - Regional Model (SCALE-RM,

Nishizawa et al. 2015; Sato et al. 2015) with the Local Ensemble Transform Kalman Filer (LETKF,

                                                3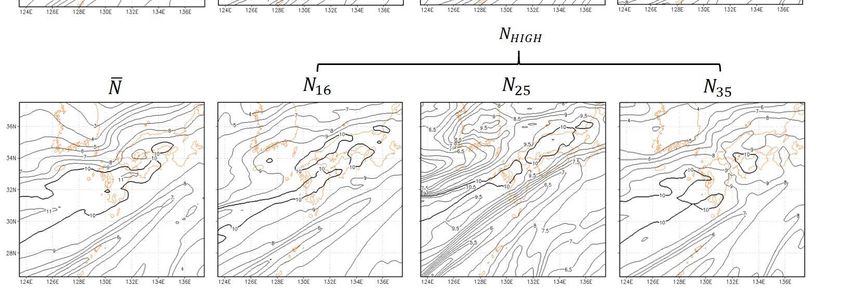
SOLA2021, Vol.17, XXX-XXXX, doi: 10.2151/sola.2021-008

Hunt et al. 2007) and has been developed specifically for prediction of severe rainfall events in

Japan (Miyoshi et al. 2016a, 2016b). The NRT version has been running experimentally since

May 2015 (Lien et al. 2017), providing near-real-time weather analyses and forecasts at 18-km

resolution for a synoptic-scale domain centered over Japan. The near real-time refers to the fact

that there is a time delay between the availability of the assimilated observations from U.S.

National Centers for Environmental Prediction (NCEP) operational system (PREPBUFR) and the

data assimilation cycle. The overriding goal of the system is to perform very high-resolution,

convective-scale experiments for precise prediction of sudden severe weather at local scale, using

a rapid update cycling approach with observations from Phased Array Weather Radar e.g.,

Maejima et al. (2017). For this, analyses and forecasts from the low 18-km resolution

configuration are used to provide initial and boundary conditions. Therefore, for the success of

the high-resolution experiments, it is vital that the 18-km model configuration captures the current

and near-future large-scale atmospheric conditions. Recently, the NRT SCALE-LETKF

successfully demonstrated its capability for high-resolution, near real-time forecasting with a 2-

week long experiment, becoming the first-ever NWP operations at 500-m resolution, refreshed

every 30 seconds using observations from a dual-polarization PAWR covering the Tokyo

metropolitan area.

In this study we examine the performance of the 18-km resolution configuration of the NRT

SCALE LETKF to predict the July 2020 heavy rainfall, and in particular, the extreme heavy

rainfall that fell across central and southern Kyushu beginning early morning of 4 July until 7

July. In addition, we investigate the atmospheric conditions from ensemble member forecasts and

reanalysis datasets over this period to understand what features of the large-scale conditions may

have caused the excessive rainfall.

This paper is organized as follows. In Section 2 we provide a description of the NRT SCALE-

LETKF and experiment settings are described. Section 3 presents results and discussion. Section

                                                 4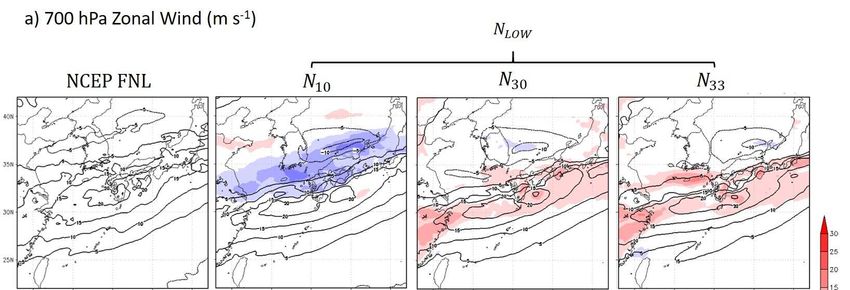
SOLA2021, Vol.17, XXX-XXXX, doi: 10.2151/sola.2021-008

4 presents conclusions and plans for future work.

2.   Methodology

This NRT SCALE-LETKF couples the regional version of the SCALE model (SCALE-RM;

Nishizawa et al. 2015; Sato et al. 2015) with the LETKF (Hunt et al. 2007), a variant of the EnKF

data assimilation schemes. Several parametrization schemes are used, including the Kain-Fritsch

mass flux scheme (Kain and Fritsch 1993) for convective parameterization, a 6-class single-

moment bulk microphysics scheme (Tomita 2008), the Smagorinsky-Lilly sub-grid model

turbulence scheme (Smagorinsky 1963; Lilly 1962), the Model Simulation radiation TRaNsfer

code (MSTRN) X (Sekiguchi and Nakajima 2008), a Beljaars-type bulk surface-flux model

(Beljaars and Holtslag 1991) and a simple single-layer urban canopy model (Kusaka et al. 2001).

Sea surface temperature is assumed to be constant given by the initial condition.

The setup of the NRT SCALE LETKF is similar to that described in Lien et al. (2017). Namely,

a single large domain (hereafter ‘D1’) measuring 5760 km × 4320 km in the zonal and meridional

range respectively is constructed, centered at Japan. Horizontal grid spacing for D1 is 18-km,

equating to 320 × 240 grids, with 36 terrain following vertical levels from the surface up to

approximately 30-km height. The ensemble size is 50. Data assimilation (DA) cycling is

performed every 6 hours, assimilating conventional observation data from NCEP PREPBUFR,

which includes upper-air and surface in-situ observations and satellite derived data such as

satellite winds, but excluding radiance data. PREPBUFR data is provided by the National Oceanic

and Atmospheric Administration (NOAA)’s National Operational Model Archive and

Distribution System (NOMADS; http://nomads.ncep.noaa.gov/). Since PREPBUFR data is

available after the analysis time in each DA cycle the data assimilation and ensemble forecasts

are performed, in actuality, several hours after the model analysis time. Hence, it is termed the

near-real time SCALE-LETKF.

                                                5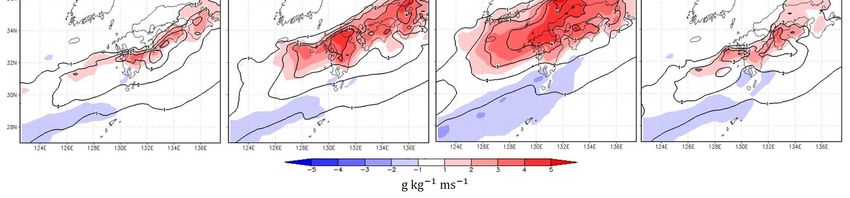
SOLA2021, Vol.17, XXX-XXXX, doi: 10.2151/sola.2021-008

In each DA cycle, 9-hour ensemble forecasts are conducted to evolve the error covariance for the

4D-LETKF (Hunt et al. 2004). Conventional observations are assimilated with a 3 to 9 hour

forecast window for each DA cycle. Lateral boundary conditions for the first 6-hour ensemble

forecasts were from the NCEP Global Forecasting System (GFS) 0.5° analyses, with the same

data applied to all 50 members. After each analysis, a 120-hour deterministic forecast is initialized

from the ensemble mean, which uses GFS 0.5° operational deterministic forecasts for lateral

boundary conditions. The state variables analyzed in the NRT SCALE-LETKF consist of the

horizontal and vertical wind components, temperature, pressure and mixing ratios of water vapor,

cloud water, cloud ice, rain, snow and graupel. Covariance inflation is applied through a

combination of multiplicative inflation and relaxation to prior perturbation (RTPP; Zhang et al.

2004). This process involves initially increasing the background error covariance by a factor of

1.25 before relaxing the analysis perturbation to the background perturbation with a weight of 0.8

for the background and 0.2 for the analysis. This is performed to consider the inhomogeneous

observation coverage.

In this study we examine the performance of the 120-hour (5-day) deterministic (ensemble-mean)

forecasts initialized at 0000 UTC between 30 June and 3 July (4 forecasts in total). Verification

of the forecasts come from Japan Meteorological Agency (JMA) Radar/Rain-gauge 1-km

precipitation analysis (hereafter ‘JMA1KM’). This dataset is the rapid-update version of the JMA

analysis rainfall, which gives the instantaneous rainfall rate at 1-km resolution every 10 minutes

(available from http://database.rish.kyoto-u.ac.jp/). Precipitation records from JMA Automated

Meteorological Data Acquisition System (AMeDAS) stations are also used at specific locations

around Kyushu.

For examination of large-scale atmospheric conditions, we use the individual ensemble member

forecasts initialized at 0000 UTC 1 July and reanalysis datasets ERA-5 0.25° reanalysis data

(European Centre for Medium-Range Weather Forecasts 2019 and NCEP Global Data

                                                 6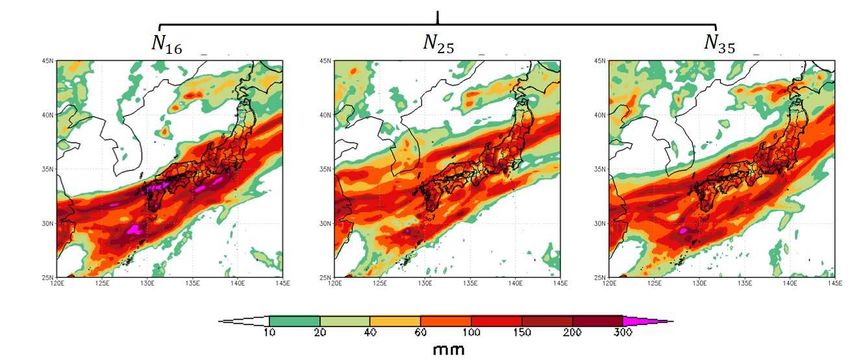
SOLA2021, Vol.17, XXX-XXXX, doi: 10.2151/sola.2021-008
Assimilation System/Final (GDAS/FNL) 0.25° Global Tropospheric Analyses and Forecast
Grids).
Results and discussion
3.1 Ensemble-mean precipitation forecasts (120-hr deterministic forecasts)
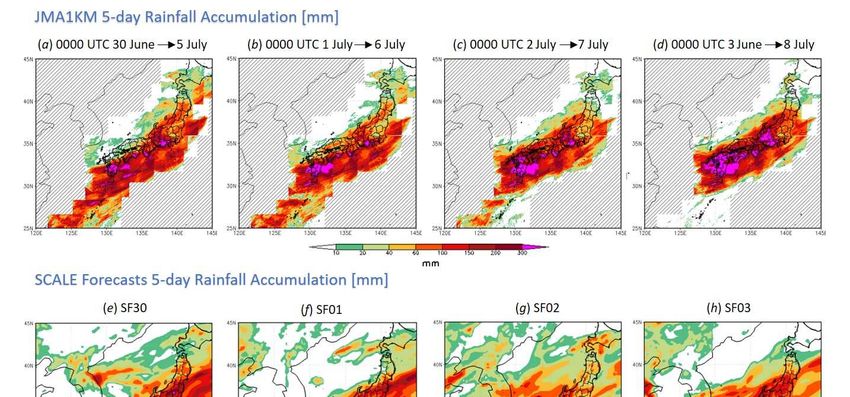
Figure 1 presents the 5-day accumulated rainfall totals beginning at 0000 UTC on 30 June, 1, 2
and 3 July estimated from JMA1KM (Figure 1a through to Figure 1d), together with the 5-day
forecasts of accumulated rainfall from SCALE deterministic (ensemble-mean) forecasts
initialized at 0000 UTC on 30 June and 1, 2, and 3 July, hereafter SF30, SF01, SF02 and SF03
respectively (Figure 1e through to Figure 1h). JMA1KM totals show the characteristic elongated
rain zone of the BF extending from southern Kyushu to southern Hokkaido, with the heaviest
concentrations of rainfall located over southern Kyushu, Shikoku and along the southern Honshu
coastline. Successive 5-day totals show the rain zone moving progressively northwards,
characteristic of the northward shift of the BF at this time of year. Comparing JMA1KM totals
with the SCALE forecasts, the latter show good skill in predicting the overall large-scale
distribution of rainfall, location of heaviest rainfall and the steady northwards migration of the
rain zone. For instance, in the early forecast, SF30 (Figure 1e) successfully predicts the heavy
concentration of rainfall (>300 mm) over southern Kyushu, southern Shikoku and along the
southern Honshu coastline, extending from the Kansai to Kanto regions. The lower rainfall
accumulations over northern Kyushu, north Chugoku and Tohoku regions are also well predicted
in SF30. Subsequent forecasts SF01, SF02 and SF03 continue to accurately predict the heaviest
concentrations of rainfall over Kyushu and west-east orientation of the rain zone, further
demonstrating the skillful representation of the large-scale rain zone in the deterministic forecasts.
That being said, large differences are found with the JMA1KM analyses, particularly in areas
such as Kumamoto prefecture, on the western side of Kyushu, which saw some of the heaviest
7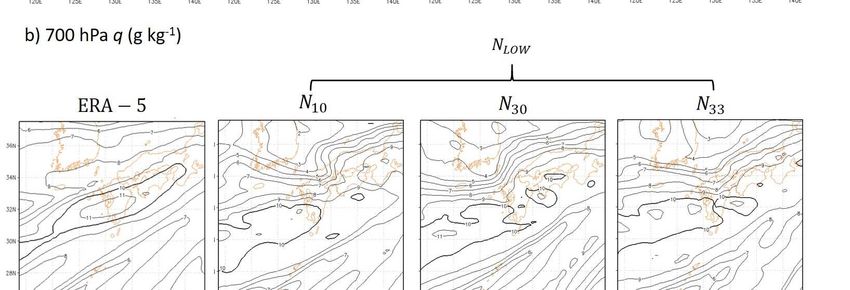
SOLA2021, Vol.17, XXX-XXXX, doi: 10.2151/sola.2021-008

concentrations of rainfall. Across this region, all four forecasts severely underestimate rainfall

totals, with deficiencies over 300 mm (Figures 1i - l). For example, SF01 (Figure 1f) shows the

heaviest rainfall shifted further north than in JMA1KM (Figure 1j), leading to an overestimation

of rainfall over northern Kyushu and underestimation over southern Kyushu. SF02 and SF03 both

severely underestimate rainfall accumulation over most of Kyushu. The extent of accumulated

rainfall error over Kyushu is reflected in the root-mean square error (RMSE), calculated between

the 5-day rainfall totals from SCALE with JMA1KM over a domain spanning 129.2 – 132.2°E,

30.9 – 34.2°N (shown by the black box in Figures 1i - l). For the RMSE calculation, the JMA 1-

km data is interpolated onto the SCALE 18-km model grid. The RMSE for each 5-day forecast,

shown in Figures 1i - l, is extremely high e.g., 211.3 mm for SF02, underlining the difficulty to

accurately predict the heavy accumulation of rainfall in the preceding days leading up to the event.

However, substantial quantities of rain are predicted in some forecasts e.g., SF30 and SF01,

suggesting the conditions for extreme rainfall were being generated in the forecasts. For example,

Figure 2 shows previous 6-hour rainfall accumulation forecasts between 1200 UTC 3 July and

0600 UTC 4 July from SF01. The forecasts show a band of heavy rain approaching Kyushu from

the west, which intensifies to produce excessive rainfall rates over 200 mm by 1800 UTC 3 July.

The scale and intensity of the rainband is largely consistent with JMA1KM, demonstrating the

ability of the model to forecast convective activity that led to the extremes of rainfall. However,

in this case, the rain is erroneously forecast further north than in JMA1KM, leading to large RMSE.

Errors in the precise prediction of heavy rainfall over Kyushu is further highlighted in Figure 3,

which shows the cumulative rainfall and 6 hourly rainfall totals from the forecasts, JMA1KM

(averaged over the same 18-km × 18-km region represented by the model) and JMA AMeDAS

rain gauge stations at 5 locations across Kyushu, including Kumamoto, Akune, Hitoyoshi,

Miyazaki and Kagoshima. Across the central areas, that include Hitoyoshi, Akune and Miyazaki,

all four forecasts severely differ from JMA1KM totals. For instance, at Akune, the rainfall

                                                 8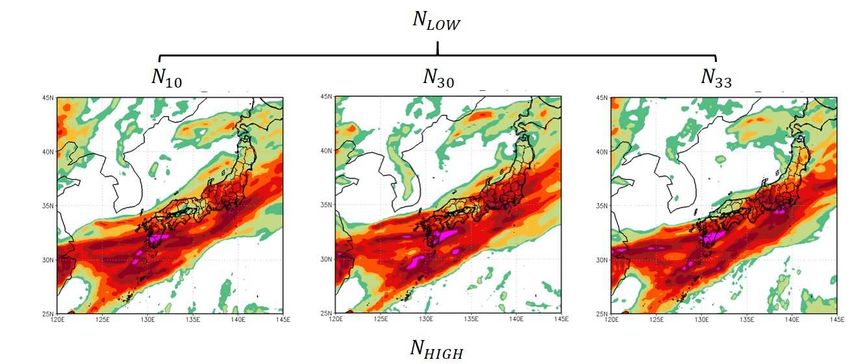
SOLA2021, Vol.17, XXX-XXXX, doi: 10.2151/sola.2021-008

recorded by JMA1KM is over 10 times that in SF02 (Figure 3G). In Kumamoto, SF01 massively

overestimates rainfall, with approximately 300 mm of rain predicted over a 12-hour period,

compared to estimates of approximately 50 mm from JMA1KM/AMeDAS. The inability of the

forecasts to predict the very high rainfall intensities at these locations is expected given the coarse

resolution of the model domain, which at 18-km horizontal resolution is not able to represent the

atmospheric processes that are fundamental to convective development. Moreover, the 18-km

resolution in this model configuration simply does not allow for the variability of rainfall at local

level to be represented. However, as was shown in Figure 2, large rainfall errors also appear to be

due to inaccurate positioning of the BF in the forecasts. Nevertheless, Figure 3 highlights a

success of the forecasts to accurately predict the onset, duration and breaks in rainfall across

Kyushu several days in advance. For instance, JMA1KM and AMeDAS show the heavy rainfall

begins at approximately 0000 UTC 3 July and persists for 30 - 36 hours until 0600 - 1200 UTC 4

July, after which time there is a break when little to no rain is recorded. In all four forecasts, the

onset and duration of the rains is relatively well predicted, suggesting that the forecasts capture

the northward progression of the rain zone. This marks an important achievement of the low-

configuration NRT SCALE-LETKF to capture the large-scale convective activity associated with

the BF, which would be critical for the success of higher resolution convective scale experiments.

3.2 Ensemble forecast analysis

In this section, we examine the large-scale atmospheric conditions during the period of heavy

rainfall from reanalysis datasets and ensemble member forecasts to investigate contributing

factors that may have led to the rainfall over Kyushu being so extreme. For this part, we focus on

member forecasts initialized at 0000 UTC 1 July which most skillfully predicted the event, based

upon RMSE of 5-day accumulated rainfall. We also examine those ensemble member forecasts

which least skillfully predicted the rainfall over Kyushu to understand if similar errors in

                                                  9
SOLA2021, Vol.17, XXX-XXXX, doi: 10.2151/sola.2021-008
atmospheric conditions led to their inferior forecasts. The 3 member forecasts with lowest RMSE
i.e., best-performing, were identified as N10, N30 and N33 (collectively ‘NLOW’). The 3 member
forecasts with highest RMSE i.e., worst-performing were N16, N25 and N35 (collectively ‘NHIGH’).
The 5-day accumulated rainfall forecasts for these six members are presented in Figure 4, which
clearly show NLOW outperform NHIGH in prediction of rainfall over Kyushu. Figure 5 presents
forecasts of 1-day averaged (between 0000 UTC 3 July – 0000 UTC 4 July) 700 hPa zonal wind
(m s-1) and 700 hPa specific humidity (q, g kg-1) from the NLOW, NHIGH and ensemble-mean ( )
forecasts initialized on 0000 UTC 1 July (SF01), alongside estimates from NCEP FNL (zonal
winds) and ERA-5 reanalysis (humidity). Previous studies have described the strong association
of the low-level jet stream and high humidity from a “moist tongue” that extends from the south
tropical regions with areas of heavy rainfall along the BF (Matsumoto et al. 1971). Here, the 700
hPa zonal winds (Figure 5a) show the characteristic low-level jet positioned over southern Kyushu
in NCEP FNL and in most of the member forecasts. The NLOW forecasts show the location of the
jet in close agreement with NCEP FNL, with jet maximum located over southern Kyushu. By
comparison, N16 and N25 show the jet positioned further north, with jet maximum over northern
Kyushu, suggesting a large northerly bias in the positioning of the BF. In Figure 5b, very high q
(>10 g kg-1, thick contour lines), indicative of the characteristic moist-tongue, is shown extending
from the southwest in all forecasts and in ERA-5 during the heavy rainfall. This moist-tongue of
warm air is associated with vertical advection of water vapor (Ninomiya and Shibagaki 2007) and
closely associated with regions of intense rainfall (Matsumoto et al. 1971). ERA-5 shows the
extension of the moist-tongue squarely across central Kyushu, with exceptionally high q (11 g kg-
1
) over the region where some of the highest intensity rainfall was recorded. Humidity in this
region is notably higher than in any of the member forecasts, which may suggest an
underestimation of water vapor was a factor to their underestimation of rainfall. In the NHIGH
forecasts, the region of very moist air is seen extending much further north than in either ERA-5
10SOLA2021, Vol.17, XXX-XXXX, doi: 10.2151/sola.2021-008
or the NLOW forecasts, further signaling the northerly bias of the BF in those forecasts. Combined
with this, Figure 6 presents the 1-day averaged forecasts of 700 hPa moisture transport Vq (g kg-
1
m s-1), where V is the horizontal wind vector, which shows much greater flow of moisture to
regions of northern Kyushu and Sea of Japan in the NHIGH forecasts. While the strong inflow of
water vapor and higher levels of water vapor in these regions does not necessary dictate that heavy
rainfall will occur (Matsumoto 1971), the availability of high water vapor over these regions
creates conditions for heavy rainfall to occur. The NLOW forecasts on the other hand, show strong
Vq extending only as far north as central Kyushu, and towards the region where high intensity
rainfall occurred, in good agreement with the reanalysis. This good level of consistency shown
between the NLOW forecasts and NCEP FNL of the moisture flow suggests it was an important
reason to their accurate prediction of rainfall over Kyushu.
Finally, previous studies of the BF have observed regions of strong convergence to the right rear
of low level jet maximum, with high-water vapor coinciding with regions low-level convergence
during periods of heavy rainfall (Matsumoto 1971). In light of these studies, we investigated
whether regions of strong convergence were present during the period of heavy rain and whether
this was predicted in member forecasts. Figure 7 presents the 1-day-averaged 850 hPa divergence
between 0000 UTC 3 July – 0000 UTC 4 July from the NCEP FNL analyses and ensemble
forecasts. A clear buildup of strong convergence to the west of Kumamoto and Kagoshima
prefectures, coinciding with the approximate location of the right rear of the low-level jet, is
observed during this time in both the reanalysis and in N10 and N33, with weaker convergence
further west of Kyushu in N30. The presence of convergence here suggests a strong buildup of
moisture and convective instability prior to and during the time of heavy rainfall. Furthermore,
the presence this feature in the NLOW forecasts suggests another important reason as to these
members superior prediction of heavy rainfall over Kyushu.
11SOLA2021, Vol.17, XXX-XXXX, doi: 10.2151/sola.2021-008
4. Summary
We investigated the predictability of the extreme heavy rainfall that fell over Kyushu in July 2020
using a low 18-km resolution configuration of the near real-time (NRT) SCALE-LETKF system.
Forecasts of 5-day accumulated rainfall initialized at 0000 UTC between 30 June and 3 July
showed the system was capable of successfully predicting the large-scale elongated rain zone of
the Baiu Front and the heaviest rainfall over Kyushu several days in advance of the event. The
model also displayed good skill at predicting the approximate onset and duration of rainfall over
specific sites across Kyushu, as well as the large rainfall accumulations in excess of 300 mm.
However, the precise location of heaviest rainfall was not well predicted, with large differences
between the ensemble-mean forecasts and JMA 1-km precipitation analyses. In addition, all of
forecasts severely underestimated the heaviest rain over worst-hit Kumamoto prefecture.
Nevertheless, the success of the model to represent the large-scale distribution of rainfall in
forecasts and predict the high intensities of rainfall was considered important validation of the
system to provide representative large-scale atmospheric conditions for conducting higher
resolution experiments for near real-time NWP operation.
Examination of the large-scale atmospheric conditions from reanalysis and best performing
ensemble member forecasts showed the maximum of the low-level jet stream situated to the south
of Kyushu, with strong moisture flux extending as far north as Kumamoto prefecture. In addition,
very high humidity rates up to 11 g kg-1 were present over central and southern Kyushu during
the time of extreme rainfall, indicating the availability of a vast supply of moisture for extreme
rainfall to occur. It was noted that humidity levels were underestimated by the model forecasts
over this region, which may have led to their underestimation of rainfall. Finally, it was shown
that strong convergence was present to the west of Kumamoto prefecture, which was well-
predicted in best performing members forecasts, suggesting this condition might also been
important to the predictability of heavy rainfall over central Kyushu.
12SOLA2021, Vol.17, XXX-XXXX, doi: 10.2151/sola.2021-008
In future studies, we plan to investigate the predictability of the event with higher resolution
experiments with the SCALE-LETKF and to perform a more comprehensive review of the multi-
scale contributing factors that led to the event.
Acknowledgements
This work was supported by Japan Science and Technology Agency (JST) Advanced Intelligence
Project (AIP) Acceleration Research (grant number JPMJCR19U2) and by MEXT as “Program
for Promoting Researches on the Supercomputer Fugaku” (Large Ensemble Atmospheric and
Environmental Prediction for Disaster Prevention and Mitigation). The study was also partly
supported by RIKEN special post-doctoral fellow program and JSPS Kakenhi (grant number
20K14558). The results were obtained using computational resources of the Oakforest-PACS
Supercomputer System (Project IDs: hp190051 and hp20026). The SCALE-LETKF code is based
on the open-source code available at https://github.com/takemasa-miyoshi/letkf. SCALE-RM is
an open-source basic library for weather and climate model available from https://scale.riken.jp/.
All numerical experiment results are archived locally at RIKEN Centre for Computational
Science (R-CCS), Kobe, Japan. The JMA 1 km precipitation analysis data were collected and
distributed by the Research Institute for Sustainable Humanosphere, Kyoto University, available
at http://database.rish.kyoto-u.ac.jp/index-e.html. The authors would like to thank the other
members of the Data Assimilation Research Team, RIKEN R-CCS for useful discussion. Finally,
the authors thank the two anonymous reviewers for their constructive comments and suggestions.
References
Akiyama, T. 1973: The large-scale aspects of the characteristic features of the Baiu front. Pap.
Meteor. Geophy., 24, 157-188
Akiyama, T. 1975: Southerly transversal moisture flux into the extremely intense rainfall zone in
13SOLA2021, Vol.17, XXX-XXXX, doi: 10.2151/sola.2021-008
the Baiu season. J. Meteor. Soc. Japan, 53, 304-316
Beljaars, A. C. M., and A. A. M. Holtslag, 1991: Flux parameterization over land surfaces for
atmospheric models. J. Appl. Meteor., 30, 327−341.
European Centre for Medium-Range Weather Forecasts. 2019, updated monthly. ERA5
Reanalysis (0.25 Degree Latitude-Longitude Grid). Research Data Archive at the National
Center for Atmospheric Research, Computational and Information Systems Laboratory.
https://doi.org/10.5065/BH6N-5N20. Accessed 8 October 2020.
Fire and Disaster Management Agency (FDMA), 2020: About the damage situation due to
heavy rain in July 2nd year of Reiwa (Available online at
https://www.fdma.go.jp/disaster/info/items/201001_ooame52.pdf accessed 11 November
2020) (in Japanese).
Government of Japan, 2020: Reports on The Heavy Rain Event of July 2020 (Available online at
http://www.bousai.go.jp/updates/r2_07ooame/pdf/r20703_ooame_36.pdf accessed 18
September 2020) (in Japanese).
Hunt, B. R., E. J. Kostelich, and I. Szunyogh, 2007: Efficient data assimilation for spatiotemporal
chaos: A local ensemble transform Kalman filter. Physica D, 230, 112−126
Kain J. S. and J. M. Fritsch (1993) Convective Parameterization for Mesoscale Models: The Kain-
Fritsch Scheme. In: Emanuel K.A., Raymond D.J. (eds) The Representation of Cumulus
Convection in Numerical Models. Meteorological Monographs. American Meteorological
Society, Boston, MA. https://doi.org/10.1007/978-1-935704-13-3_16
Kotsuki, S., K. Terasaki, K. Kanemaru, M. Satoh, T. Kubota, and T. Miyoshi, 2018: Predictability
of record-breaking rainfall in Japan in July 2018: Ensemble forecast experiments with the
near-real-time global atmospheric data assimilation system NEXRA. SOLA, 15A, 1−7
Kusaka, H., Kondo, H., Kikegawa, and Y., Kimura, F. 2001: A Simple Single-Layer Urban
Canopy Model for Atmospheric Models: Comparison with Multi-Layer and Slab Models.
14SOLA2021, Vol.17, XXX-XXXX, doi: 10.2151/sola.2021-008
Bound. Layer Meteor., 101, 329-358
Lien, G.-Y., T. Miyoshi, S. Nishizawa, R. Yoshida, H. Yashiro, S. A. Adachi, T. Yamaura, and H.
Tomita, 2017: The near-real-time SCALE-LETKF system: A case of the September 2015
Kanto-Tohoku heavy rainfall. SOLA, 13, 1−6.
Lilly, D., 1962: On the numerical simulation of buoyant convection. Tellus, 14:148–171
Maejima, Y., M. Kunii, and T. Miyoshi, 2017: 30-second-uptae 100-m mesh data assimilation
experiments: A sudden local rain case in Kobe on 11 September 2014. SOLA, 13, 174–180.
Matsumoto, S., T. Fujita and T. Asai, 1962: Analysis of low-level jet associated with the heavy
rain observed over Japan, Juen, 24-31.
Matsumoto, S., S. Yoshizumi, M. Takeuchi, 1970: On the structure of the Baiu front and
associated intermediate-sale disturbances in the lower atmosphere. J. Meteor. Soc. Japan, 48,
479-491
Matsumoto, S., K. Ninomiya, and S. Yoshizumi, 1971: Characteristics of the Baiu front with
heavy rainfall. J. Meteor. Soc. Japan, 49, 267-281
Miyoshi, T., and co-authors, 2016a: “Big Data Assimilation” revolutionizing severe weather
prediction. Bull. Amer. Meteor. Soc., 97, 1347−1354.
Miyoshi, T., and co-authors, 2016b: “Big Data Assimilation” toward post-peta-scale severe
weather prediction: An overview and progress. P. IEEE, 104, 2155−2179.
National Centers for Environmental Prediction/National Weather Service/NOAA/U.S.
Department of Commerce. 2015, updated daily. NCEP GDAS/FNL 0.25 Degree Global
Tropospheric Analyses and Forecast Grids. Research Data Archive at the National Center
for Atmospheric Research, Computational and Information Systems Laboratory.
https://doi.org/10.5065/D65Q4T4Z. Accessed 8 October 2020.
Ninomiya K., and Y. Shibagaki, 2007: Multi-Scale Features of the Meiyu-Baiu Front and
Associated Precipitation Systems. J. Meteor. Soc. Jp., 112, 1−31.
15SOLA2021, Vol.17, XXX-XXXX, doi: 10.2151/sola.2021-008
Nishizawa, S., H. Yashiro, Y. Sato, Y. Miyamoto, and H. Tomita, 2015: Influence of grid aspect
ratio on planetary boundary layer turbulence in large-eddy simulations. Geosci. Model Dev.,
8, 3393−3419, doi:10.5194/gmd-8-3393-2015.
Sato, Y., S. Nishizawa, H. Yashiro, Y. Miyamoto, Y. Kajikawa, and H. Tomita, 2015: Impacts of
cloud microphysics on trade wind cumulus: Which cloud microphysics processes contribute
to the diversity in a large eddy simulation? Prog. Earth Planet. Sci., 2, 23
Sekiguchi, M., and T. Nakajima, 2008: A k-distribution-based radiation code and its
computational optimization for an atmospheric general circulation model. J. Quant.
Spectrosc. Radiat. Transfer, 109, 2779−2793
Shimpo, A., et al., 2019: Primary Factors behind the Heavy Rain Event of July 2018 and the
Subsequent Heat Wave in Japan. SOLA., 15A, 13–18
Smagorinsky. J., 1963: General circulation experiments with the primitive equations. Mon.
Weather Rev., 91:99–164.
Takemura, K., S. Wakamatsu, H. Togawa, A. Shimpo, C. Kobayashi, S. Maeda and H. Nakamura,
2019: Extreme moisture flux convergence over western Japan during the Heavy Rain Event
of July 2018. SOLA., 15A, 49–54
Tomita, H., 2008: New microphysical schemes with five and six categories by diagnostic
generation of cloud ice. J. Meteor. Soc. Japan, 86A, 121−142, doi:10.2151/jmsj.86A.121.
Zhang, F., C. Snyder, and J. Sun, 2004: Impacts of initial estimate and observation availability on
convective-scale data assimilation with an ensemble Kalman filter. Mon. Wea. Rev., 132,
1238−1253
List of Figure Captions
Fig. 1. Top-row: 5-day accumulated precipitation (mm) calculated from Japan Meteorological Agency
(JMA) Radar Precipitation Analysis (JMA1KM) in the period starting 0000 UTC on a) 30 June, b) 1
16SOLA2021, Vol.17, XXX-XXXX, doi: 10.2151/sola.2021-008
July, c) 2 July and d) 3 July. Middle-row: SCALE ensemble-mean 5-day forecasts of accumulated
rainfall for forecasts initialized at 0000 UTC e) 30 June (SF30), f) 1 July (SF01), g) 2 July (SF02) and
h) 3 July (SF03). Bottom-row: Difference between JMA1KM and SCALE forecasts (SCALE –
JMA1KM). Blue/red shading corresponds to dryer/wetter SCALE forecasts. The black box in i, j, k, l
shows the domain used to calculate RMSE between the SCALE 5-day rainfall total forecasts and
JMA1KM 5-day rainfall totals, the values of which are given in i, j, k, l. Hatching in a, b, c, d, i, j, k, l
represent regions of no data.
Fig. 2. (a) SCALE ensemble-mean forecasts of previous 6 hour accumulated precipitation (mm) at 84,
90, 96- and 104-hour lead times initialized at 0000 UTC 1 July (SF01). (b) JMA1KM estimates of 6-
hour rainfall accumulations over the equivalent periods
Fig. 3. 5-day timeseries of cumulative rainfall (mm) at 5 locations (see map) across Kyushu beginning
0000 UTC a) 30 June, b) 1 July, c) 2 July and d) 3 July from JMA1KM (black line), AMeDAS stations
(blue line) and SCALE ensemble-mean forecasts (red line). Bars show previous 6-hour rainfall totals.
Both SCALE and JMA1KM values represent average precipitation totals covering an 18 km × 18 km
region, the locations of which are indicated by the blue square regions on the map. AMeDAS data
represents single-point stations totals.
Fig. 4: 5-day forecasts of accumulated rainfall initialized at 0000 UTC 1 July (SF01) from the 3
best/worst (NLOW / NHIGH) performing ensemble members based on RMSE of rainfall over Kyushu
using JMA 1km precipitation analyses interpolated onto the 18-km SCALE grid
Fig. 5. 1-day averaged (0000 UTC 3 July – 0000 UTC 4 July) forecasts of a) 700 hPa zonal wind (m
s-1, contours) and b) 700 hPa specific humidity (q, g kg-1 contours) from the ensemble mean , NLOW
and NHIGH initialized on 0000 UTC 1 July. Shading in zonal wind figures show differences from NCEP
17SOLA2021, Vol.17, XXX-XXXX, doi: 10.2151/sola.2021-008
FNL (SCALE - NCEP FNL).
Fig. 6. As in Figure 5 but for forecasts of moisture flux (Vq, g kg-1 m s-1, contours). Shading shows
differences from NCEP FNL (SCALE - NCEP FNL).
Figure 7: As in Figure 5 but for divergence (shading, x10-5 s-1) and wind (vectors, m s-1) at 850 hPa.
18SOLA2021, Vol.17, XXX-XXXX, doi: 10.2151/sola.2021-008
Figure 1: Top-row: 5-day accumulated precipitation (mm) calculated from Japan Meteorological
Agency (JMA) Radar Precipitation Analysis (JMA1KM) in the period starting 0000 UTC on a)
30 June, b) 1 July, c) 2 July and d) 3 July. Middle-row: SCALE ensemble-mean 5-day forecasts
of accumulated rainfall for forecasts initialized at 0000 UTC e) 30 June (SF30), f) 1 July (SF01),
g) 2 July (SF02) and h) 3 July (SF03). Bottom-row: Difference between JMA1KM and SCALE
forecasts (SCALE – JMA1KM). Blue/red shading corresponds to dryer/wetter SCALE forecasts.
The black box in i, j, k, l shows the domain used to calculate RMSE between the SCALE 5-day
rainfall total forecasts and JMA1KM 5-day rainfall totals, the values of which are given in i, j, k,
l. Hatching in a, b, c, d, i, j, k, l represent regions of no data.
19SOLA2021, Vol.17, XXX-XXXX, doi: 10.2151/sola.2021-008
Figure 2: (a) SCALE ensemble-mean forecasts of previous 6 hour accumulated precipitation
(mm) at 84, 90, 96- and 104-hour lead times initialized at 0000 UTC 1 July (SF01) and (b)
JMA1KM estimates of 6-hour rainfall accumulations over the equivalent periods.
20SOLA2021, Vol.17, XXX-XXXX, doi: 10.2151/sola.2021-008
Figure 3: 5-day timeseries of cumulative rainfall (mm) at 5 locations
(see map) across Kyushu beginning 0000 UTC a) 30 June, b) 1 July,
c) 2 July and d) 3 July from JMA1KM (black line), AMeDAS
stations (blue line) and SCALE ensemble-mean forecasts (red line).
Bars show previous 6-hour rainfall totals. Both SCALE and
JMA1KM values represent average precipitation totals covering an
18 km × 18 km region, the locations of which are indicated by the
blue square regions on the map. AMeDAS data represents single-
point stations totals.
21SOLA2021, Vol.17, XXX-XXXX, doi: 10.2151/sola.2021-008
Figure 4: 5-day forecasts of accumulated rainfall initialized at 0000 UTC 1 July (SF01) from
the 3 best/worst (NLOW/ NHIGH) performing ensemble members based on RMSE of rainfall over
Kyushu using JMA1KM precipitation analyses interpolated onto the 18-km SCALE grid
22SOLA2021, Vol.17, XXX-XXXX, doi: 10.2151/sola.2021-008
Figure 5: 1-day averaged (0000 UTC 3 July – 0000 UTC 4 July) forecasts of a) 700 hPa zonal
wind (m s-1, contours) and b) 700 hPa specific humidity (q, g kg-1 contours) from the ensemble
mean , NLOW and NHIGH initialized on 0000 UTC 1 July. Shading in zonal wind figures show
23
differences from NCEP FNL (SCALE - NCEP FNL).SOLA2021, Vol.17, XXX-XXXX, doi: 10.2151/sola.2021-008 Figure 6: As in Figure 5 but for forecasts of moisture flux (Vq, g kg-1 m s-1, contours). Shading shows differences from NCEP FNL (SCALE - NCEP FNL). Figure 7: As in Figure 5 but for divergence (shading, x10-5 s-1) and wind (vectors, m s-1) at 850 hPa. 24
You can also read